






>Pauli133 m →top: let's get these displaying properly |
m further rework information for accuracy also and fixed typos |
||
| Line 1: | Line 1: | ||
{{Use Indian English|date=January 2020}} | {{Short description|Emerging Economy In India}} | ||
{{protection padlock|small=yes}} | |||
{{Use Indian English|date=January 2020}} | |||
{{Use dmy dates|date=March 2021}} | {{Use dmy dates|date=March 2021}} | ||
{{Infobox economy | {{Infobox economy | ||
| country = West Bengal | | country = West Bengal | ||
| image = | | image = [[File:MIGHTY_CHERRY_NEWTOWN_1.jpg|frameless|300px]] | ||
| image_size = | | image_size = 343px | ||
| caption = | | caption = [[Kolkata]], the financial centre and capital of [[West Bengal]] | ||
| year = 1 April – 31 March | | year = 1 April – 31 March | ||
| currency = [[Indian Rupee]] [[ | | currency = [[Indian Rupee]] (INR, ₹) | ||
| gdp = | | organs = As part of the [[India|Union of India]], as in [[G4 nations|G4]], [[G-20 major economies|G-20]], [[BRICS]], [[World Trade Organization|WTO]], [[World Customs Organization|WCO]], [[South Asian Free Trade Area|SAFTA]], [[BIMSTEC]], [[World Federation of Trade Unions|WFTU]], [[Bank for International Settlements|BIS]], [[Asian Infrastructure Investment Bank|AIIB]], [[Asian Development Bank|ADB]] and others | ||
| group = {{plainlist| | |||
*[[Developing country|Developing/emerging]]<ref>{{cite web |url=https://www.imf.org/external/pubs/ft/weo/2020/01/weodata/groups.htm |title=World Economic and Financial Surveys World Economic Outlook Database—WEO Groups and Aggregates Information April 2020 |website=IMF.org |publisher=[[International Monetary Fund]] |access-date=2 September 2020}}</ref> | |||
*Lower-middle income economy<ref>{{cite web |url=https://datahelpdesk.worldbank.org/knowledgebase/articles/906519-world-bank-country-and-lending-groups |title=World Bank Country and Lending Groups |publisher=[[World Bank]] |access-date=29 September 2019}}</ref>}} | |||
| population = {{increase}} 91,347,736 (2011 census) | |||
<br>{{increaseNeutral}} 106,031,000 (2026 est.) <ref>{{Cite web |title=MoHFW Projections |url=https://main.mohfw.gov.in/sites/default/files/Population%20Projection%20Report%202011-2036%20-%20upload_compressed_0.pdf |access-date=2024-06-16}}</ref> | |||
| gdp = {{increase}} {{INRConvert|22.78|lc}} (2026-27 FY est.)<br>{{increase}}{{INRConvert|102.3|lc}} (GDP PPP) (2026-27 FY est.)<ref>{{Cite web |title=West Bengal Budget Analysis 2025-26 |url=https://prsindia.org/budgets/states/west-bengal-budget-analysis-2025-26 |access-date=2025-03-15}}</ref><ref>{{Cite web |url=https://finance.wb.gov.in/writereaddata/Fiscal_Policy/FRBM26_Part1.pdf}}</ref> | |||
| gdp rank = [[List of Indian states and union territories by GDP|6th]] | | gdp rank = [[List of Indian states and union territories by GDP|6th]] | ||
| growth = | | growth = {{Increase}} 11.85% (Nominal) (2025-26 FY) <br /> {{Increase}} 8.62% (Real) (2025-2026 FY)<ref name=PRS25-26>{{cite web|url=https://prsindia.org/budgets/states/west-bengal-budget-analysis-2025-26 |title=West Bengal Budget Analysis 2025-26 |work=PRS Legislative Research |date=2025-03-15 |access-date=2025-03-15}}</ref> | ||
| per capita = {{INRConvert| | | per capita = {{increase}} {{INRConvert|214877|lk=r}} (2026-2027 FY)<ref name="MoSPI">{{cite web |title=GSVA/NSVA by Economic Activities |url=https://mospi.gov.in/sites/default/files/press_releases_statements/GSVA_NSVA_Economic_Activity/WestBengal_16082024.xlsx |website=MoSPI |access-date=16 August 2024 |location=Delhi |date=16 August 2024}}</ref> | ||
| per capita rank = [[List of Indian states and union territories by GDP per capita| | | per capita rank = {{plainlist| *[[List of Indian states and union territories by GDP per capita|21st]]}} | ||
| sectors = Agriculture: | | sectors = {{decrease}} Agriculture: 17.13% <br /> {{increase}} Industry: 29.77% <br /> {{increase}} Services: 53.10% <br />(2026–27)<ref name="WBBudget2026">{{cite report |author=Department of Finance |title=Budget Speech 2026-2027 (English) |url=https://finance.wb.gov.in/writereaddata/Budget_Speech/2026-2027_English_I.pdf |publisher=Government of West Bengal |date=2026 |access-date=February 19, 2026}}</ref> | ||
| components = | | components = | ||
| poverty = {{decreasepositive}} [[List of Indian states and union territories by poverty rate| | | poverty = {{decreasepositive}} 8.60% [[List of Indian states and union territories by poverty rate|15th]] in poverty (2022-23)<ref>{{Cite web |date=1 January 2024 |title=Multidimensional Poverty in India Since 2005-06 |url=https://www.niti.gov.in/sites/default/files/2024-01/MPI-22_NITI-Aayog20254.pdf |website=[[Niti Aayog]]}}</ref> | ||
| | | inflation = {{decreasepositive}} 3.63% (June, 2025 FY)<ref>{{Cite web |date=August 2024 |title=Statewise Inflation Rates (%) for August 2024 (based on CPI) |url=https://www.mospi.gov.in/dataviz-cpi-map|website=MoSPI}}</ref> | ||
| inflation = | | bankrate = | ||
| bankrate = | | hdi = {{increase}} 0.674 (2023) {{color|orange|medium}} <ref>{{cite web |title=Human Development |url=https://globaldatalab.org/shdi/table/shdi/IND/?levels=1+4&interpolation=0&extrapolation=0 |access-date=9 November 2025}}</ref> | ||
| hdi = {{increase}}0. | |||
| labor = | | labor = | ||
| occupations = | | occupations = | ||
| unemployment = 3. | | unemployment = 3.4% (2021-22)<ref>{{cite web|url=https://dge.gov.in/dge/sites/default/files/2023-07/Employment_Indicators_in_India_since_2017-18_to_2021-22.pdf |title=Employment Indicators in India 2021-22 |work=Directorate of Employment |access-date=2024-06-11}}</ref> | ||
| average gross salary = | | average gross salary = | ||
| gross median = | | gross median = | ||
| average net salary = | | average net salary = | ||
| net median = | | net median = | ||
| industries = | | industries = [[Mining]] • [[Steel]] • [[IT]] • [[Financial services]] • [[Manufacturing]] • [[Tourism in West Bengal|Tourism]] • [[Chemicals]] • [[Leather]] • [[Tea]] • [[Food processing]] • [[Textiles]] • [[Cement]] • [[Jute]] • [[Jewellery]] • [[Marine]] | ||
| exports = | | exports = {{Increase}} {{INRConvert|147259|c}} (2025-26 FY) <br>''' • Software exports''' : <br>{{Increase}} {{INRConvert|40000|c}} (2025-26) <ref name="TOI_BengalIT2026">{{cite news |last=Gangopadhyay |first=Sarthak |date=January 17, 2026 |title=Bengal IT sector poised for major expansion with Rs 30,000cr investment lined up |url=https://timesofindia.indiatimes.com/city/kolkata/bengal-it-sector-poised-for-major-expansion-with-rs-30000cr-investment-lined-up/articleshow/126590636.cms |work=[[The Times of India]] |access-date=February 15, 2026}}</ref><br> '''• Merchandise exports''' :<br>{{Increase}} {{INRConvert|107259|c}} (2025-26) <ref>{{cite web|url=https://dashboard.commerce.gov.in/commercedashboard.aspx |title=Import-Export Dashboard |work=Ministry of Commerce}}</ref> | ||
| export-goods = | | export-goods = IT<ref>{{cite news | ||
| export-partners = | |title=West Bengal's IT exports surge to ₹35,000 crores | ||
|newspaper=Ainvest | |||
|date=18 July 2025 | |||
|url=https://www.ainvest.com/news/west-bengal-exports-surge-35-000-crores-bengal-silicon-valley-project-progresses-42-companies-onboard-2507/ | |||
}}</ref> • metro rolling stock<ref>{{cite news | |||
|title=Titagarh Rail Systems expects rapid growth in passenger rail business | |||
|newspaper=The Times of India | |||
|date=19 June 2025 |url=https://timesofindia.indiatimes.com/city/kolkata/titagarh-rail-systems-expects-rapid-growth-in-passenger-rail-business/articleshow/121939334.cms | |||
}}</ref> • warships<ref>{{cite web | |||
|title=Garden Reach Shipbuilders & Engineers—Recent Export Orders | |||
|publisher=Garden Reach Shipbuilders & Engineers | |||
|access-date=6 September 2025 | |||
|url=https://grse.in/about-us/index.php | |||
}}</ref> • gold products • tea • iron and steel • precious metals • marine products • rice • textile products • agricultural products • coal • petrochemicals • leather products • jute • heavy machinery | |||
| export-partners = {{Tree list}} | |||
* {{flag|ASEAN}} 39%<ref>{{cite web |title=West Bengal exports significantly to Asian markets, with ASEAN countries accounting for about 39% of the state's total exports|url=https://www.ibef.org/states/west-bengal |website=India Brand Equity Foundation (IBEF) |access-date=8 March 2026}}</ref> | |||
* {{flag|Bangladesh}} 17.4%<ref>{{cite web | |||
|title=Bangladesh remains West Bengal’s second largest export partner |url=https://indiaseatradenews.com/bangladesh-remains-west-bengals-largest-export-partner/ | |||
|website=India Seatrade News | |||
|date=24 November 2023 | |||
|access-date=22 March 2026 | |||
}}</ref> | |||
* {{flag|European Union}} 13%<ref>{{cite web |title=West Bengal’s exports to the European Union have crossed ₹20,000 crore, driven largely by growth in software, agricultural and leather exports |url=https://wbidc.com/home/export |website=West Bengal Industrial Development Corporation (Government of West Bengal) |access-date=8 March 2026}}</ref> | |||
* {{flag|USA}} 12.3%<ref>{{cite news |title=Trump's 50% tariff hits Bengal: Rs 18,000 crore exports at stake; engineering, shrimps and leather to be worst-hit |url=https://timesofindia.indiatimes.com/city/kolkata/trumps-50-tariff-hits-bengal-rs-17000-crore-exports-at-stake-engineering-shrimps-and-leather-to-be-worst-hit/articleshow/123554427.cms |work=The Times of India |access-date=8 March 2026}}</ref> | |||
* {{flag|UAE}} 9%<ref>{{cite news |title=West Bengal exports to the United Arab Emirates stood at around US$1.49 billion in 2022–23|url=https://www.telegraphindia.com/west-bengal/mamata-banerjee-meets-uae-minister-of-state-for-foreign-trade-lulu-group-international-officials/cid/1968304 |work=The Telegraph |access-date=8 March 2026}}</ref> | |||
* {{flag|Nepal}} 2.9% | |||
* {{flag|Bhutan}} 2.6% | |||
and others 3.8% | |||
{{Tree list/end}} | |||
| imports = | | imports = | ||
| import-goods = | | import-goods = | ||
| import-partners = | | import-partners = | ||
| current account = | | current account = | ||
| gross external debt = | | gross external debt = | ||
| | | niip = | ||
| debt = | | debt = {{decreasepositive}} 37.98% of GSDP (2026–27 est.)<ref name="WBBudget2026">{{cite report |author=Department of Finance |title=Budget Speech 2026-2027 (English) |url=https://finance.wb.gov.in/writereaddata/Budget_Speech/2026-2027_English_I.pdf |publisher=Government of West Bengal |date=2026 |access-date=February 19, 2026}}</ref> | ||
| balance = - | | balance = {{decreasepositive}} {{INRConvert|-74532|c}} (3.4% of GSDP) (2026–27 est.)<ref name="WBBudget2026">{{cite report |author=Department of Finance |title=Budget Speech 2026-2027 (English) |url=https://finance.wb.gov.in/writereaddata/Budget_Speech/2026-2027_English_I.pdf |publisher=Government of West Bengal |date=2026 |access-date=February 19, 2026}}</ref> | ||
| revenue = | | revenue = {{increasePositive}} {{INRConvert|2.88|lc}} (2026–27 est.)<ref name="WBBudget2026">{{cite report |author=Department of Finance |title=Budget Speech 2026-2027 (English) |url=https://finance.wb.gov.in/writereaddata/Budget_Speech/2026-2027_English_I.pdf |publisher=Government of West Bengal |date=2026 |access-date=February 19, 2026}}</ref> | ||
| expenses = | | expenses = {{decreasepositive}} {{INRConvert|3.07|lc}} (2026–27 est.)<ref name="WBBudget2026">{{cite report |author=Department of Finance |title=Budget Speech 2026-2027 (English) |url=https://finance.wb.gov.in/writereaddata/Budget_Speech/2026-2027_English_I.pdf |publisher=Government of West Bengal |date=2026 |access-date=February 19, 2026}}</ref> | ||
| aid = | | aid = | ||
| credit = | | credit = | ||
| spelling = Oxford | | spelling = Oxford | ||
| | | gini = {{steady}} 0.25 (2023-24) {{color|green|low}} <ref>{{cite web|url=https://www.niti.gov.in/sites/default/files/2024-07/SDA_INDIA.pdf |title=NITI Aayog SDG Report |work=NITI Aayog}}</ref> | ||
}} | | FDI = {{INRConvert|13945.50|c}} <br/> (Oct 2019 - Dec 2024) <ref>{{cite web|url=https://dpiit.gov.in/sites/default/files/FDI%20Factsheet%20December_2024.pdf |title=FDI Factsheet |work=DPIIT}}</ref> | ||
[[ | }} | ||
The '''economy of West Bengal''' is a [[Mixed economy|mixed]] middle-income developing social market economy and the largest [[East India|Eastern Indian]] economy with a substantial [[Public sector undertakings in India|public sector]]. It is India's sixth-largest economy by nominal GDP and contributes to about 6.15% of India's total GDP. | |||
West Bengal is | [[West Bengal]] is the primary business and financial hub of [[East India|Eastern India]]. The state is primarily dependent on agriculture and medium-sized [[Industry (manufacturing)|industry]]. West Bengal has [[jute]] and [[tea]] industry. West Bengal is rich in minerals like [[coal]], [[limestone]], [[iron ore]], [[copper]], [[lead]] and [[zinc]]. | ||
== | Since the independence of India, The [[Green Revolution]] bypassed the state. However, there has been a significant spurt in food production since the 1980s.<ref name="hdrchap1">{{cite book|url= http://hdr.undp.org/en/content/west-bengal-human-development-report-2004 |title=West Bengal Human Development Report 2004 |publisher=Development and Planning Department, Government of West Bengal |isbn=81-7955-030-3 |date=May 2004 |access-date=2021-07-11}}</ref> | ||
Agriculture accounts for the largest share of the labour force. It contributed around | ==Agriculture and livestock== | ||
{{Pie chart|value1=17.13|value2=29.77|value3=53.10|color1=#33A02C|color2=#1F78B4|color3=#E31A1C|label1=Agriculture|label2=Industry|label3=Services|caption='''Contribution of various sectors to GDP (2025-26)'''}} | |||
Agriculture accounts for the largest share of the labour force. It contributed around 17.13% to the gross state domestic product (GSDP) in 2024–25. A plurality of the state's population are peasant farmers. | |||
===Major produce=== | ===Major produce=== | ||
[[Rice]] and [[potato]] are considered to be the principal food crops. The state is the largest source of the important food crop of rice, a staple diet across [[India]], with an annual output of around 16. | [[Rice]] and [[potato]] are considered to be the principal food crops. The state is the largest source of the important food crop of rice, a staple diet across [[India]], with an annual output of around 16.76 million tonnes (about 13% of total production in India) in FY 2021–22, and the second-largest producer of [[potatoes]] in India with an average annual output of 12 million tonnes (about 20% of total production in India) in FY 21–22.<ref>{{Cite web |title=Department of Agriculture and Farmer's Welfare |url=https://agriwelfare.gov.in/Documents/CWWGDATA/Agricultural_Statistics_at_a_Glance_2022_0.pdf}}</ref> [[West Bengal]] is also the second-largest fish producing state in India after [[Andhra Pradesh]] with an annual production of 20.45 lakh tonnes.<ref>{{cite web |title=Department of Fisheries |url=https://dof.gov.in/sites/default/files/2024-03/handbook_sp.pdf |access-date=26 May 2024 }}</ref>{{rp|16}} | ||
Apart from these, jute, sugarcane and wheat are the top crops of the state.<ref name=ibef2011/>{{rp|14}} Other major food crops include maize, [[pulses]], [[oil seed]]s, wheat, [[barley]], and vegetables. Tea is another important cash crop. [[Darjeeling]] is globally recognised for tea plantation of the acclaimed [[Darjeeling tea]] variety. | Apart from these, jute, sugarcane and wheat are the top crops of the state.<ref name="ibef2011">{{cite web |title=Ministry of Roads |url=https://morth.nic.in/sites/default/files/Basic%20Road%20Statistics%20in%20India-2018-19.pdf |access-date=24 May 2024 }}</ref>{{rp|14}} Other major food crops include maize, [[pulses]], [[oil seed]]s, wheat, [[barley]], and vegetables. Tea is another important cash crop. [[Darjeeling]] is globally recognised for tea plantation of the acclaimed [[Darjeeling tea]] variety. | ||
Below is a table of 2019 national output share of select agricultural crops and allied segments in West Bengal based on 2011 prices.<ref>[https://mospi.gov.in/sites/default/files/publication_reports/Agr_forestry-fishingBrochure%202022.pdf 2019 agricultural output of West Bengal based on the 2011 prices]</ref> | |||
{| class="wikitable" | |||
{| class="wikitable sortable mw-collapsible" | |||
|- | |- | ||
! Segment || National | ! Segment || National share % | ||
|- | |- | ||
| Jute || | | Jute || 88 | ||
|- | |- | ||
| Betel || 75. | | Betel || 75.2 | ||
|- | |- | ||
| | | Mesta || 40.9 | ||
|- | |- | ||
| | | Cauliflower || 40.5 | ||
|- | |- | ||
| Brinjal || | | Brinjal || 33.6 | ||
|- | |- | ||
| | | Sweet potato || 32.6 | ||
|- | |- | ||
| | | Tea || 28.9 | ||
|- | |- | ||
| | | Cabbage || 27 | ||
|- | |- | ||
| Jackfruit || 26.8 | | Jackfruit || 26.8 | ||
|- | |- | ||
| Pineapple || 25.2 | | Pineapple || 25.2 | ||
|- | |- | ||
| | | Potato || 24.7 | ||
|- | |- | ||
| | | Narcotics || 24.2 | ||
|- | |- | ||
| | | Okra || 23.3 | ||
|- | |- | ||
| | | Radish || 23.2 | ||
|- | |- | ||
| | | Inland fish || 22.6 | ||
|- | |- | ||
| | | Grass pea || 21 | ||
|- | |- | ||
| | | Litchi || 18.7 | ||
|- | |- | ||
| | | Sesamum || 15.3 | ||
|- | |- | ||
| | | Guava || 13.7 | ||
|- | |- | ||
| | | Masoor || 13.1 | ||
|- | |- | ||
| | | Sapota || 13.1 | ||
|- | |- | ||
| | | Paddy || 12.4 | ||
|- | |- | ||
| | | Papaya || 11.9 | ||
|- | |- | ||
| | | Egg || 11.3 | ||
|- | |- | ||
| Cashew nut || 9. | | Cashew nut || 9.6 | ||
|- | |- | ||
| | | Mango || 9.2 | ||
|- | |- | ||
| | | Tomato || 9.1 | ||
|- | |- | ||
| | | Meat || 9.1 | ||
|- | |- | ||
| | | Marine fish || 8.9 | ||
|- | |- | ||
| | | Water melon || 7.9 | ||
|- | |- | ||
| | | Green pea || 7.2 | ||
|- | |- | ||
| | | Chilli || 7.2 | ||
|- | |- | ||
| | | Cereal || 7 | ||
|- | |- | ||
| | | Dung || 7 | ||
|- | |- | ||
| | | Rapeseed and mustard || 6.8 | ||
|- | |- | ||
| | | Banana || 5.9 | ||
|- | |- | ||
| | | Straw and stalk || 5.4 | ||
|- | |- | ||
| | | Ginger || 5.3 | ||
|- | |- | ||
| | | Kitchen garden || 5.3 | ||
|- | |- | ||
| | | San hemp || 4.5 | ||
|- | |- | ||
| | | Garlic || 3.4 | ||
|- | |- | ||
| Moong || | | Moong || 2.8 | ||
|} | |} | ||
It is also the second largest tea-producing state in India, producing | It is also the second largest tea-producing state in India, producing 414.08 million kg of tea in 2022–23, accounting for 30.3% of the country's total tea production. In 2022–23, West Bengal produced approximately 1.48 million tonnes of sugarcane and 3.86 million tonnes of fruits. The state is the largest vegetables producing state in India with 26354.61 thousand MT of production in 2020. | ||
West Bengal accounts for nearly 10% of the country's edible oil production. The state produced a total of | West Bengal accounts for nearly 10% of the country's edible oil production. The state produced a total of 2.045 million tonnes of fish in 2022–23 as compared to 1.84 million tonnes during 2021-22 retaining second spot after Andhra Pradesh in fish production. West Bengal produced around 7649.74 thousand tonnes of milk in FY 23–24. | ||
The state is the | The state is the largest meat producing state in the country (including poultry), producing 1.293 million tonnes of meat in 2023-24.<ref>{{Cite web |date=27 November 2024 |title=Basic Animal Husbandry Statistics 2024 |url=https://dahd.gov.in/sites/default/files/2024-12/FinalBAHS2024Book12-12-24.pdf |page=116}}</ref> | ||
==Industry== | ==Industry== | ||
{{See also|List of industrial areas in West Bengal}} | |||
State industries are mostly localised in the | State industries are mostly localised in the cities of [[Durgapur]], [[Asansol]], [[Howrah]], [[Kharagpur]] and [[Haldia]] region.<ref name=wbidcindinf>{{cite web|url=http://www.wbidc.com/about_wb/industrial_infrastructure.htm|title=Industrial infrastructure|publisher=West Bengal Industrial Development Corporation|access-date=5 March 2012|archive-date=5 April 2012|archive-url=https://web.archive.org/web/20120405152957/http://www.wbidc.com/about_wb/industrial_infrastructure.htm|url-status=dead}}</ref> There are up to 10,000 registered factories in the state and the West Bengal state government has opened Shilpa Sathi (শিল্পসাথী), a single window agency in order to provide investors with all kinds of assistance in establishing and running industrial units.<ref>[http://www.webindia123.com/westbengal/economy/economy.htm Economy of West Bengal @ webindia123.com] Suni System (P) Ltd.</ref> | ||
The state's share of total industrial output in India was 9.8% in 1980–81, declining to 5% by 1997–98. However, the service sector has grown at a rate higher than the national rate.<ref name=hdrchap1/> | |||
[[Kolkata]] is noted as one of the major centres for industries including the IT industry. The planned cities of [[Bidhannagar]] and [[New Town, Kolkata]] are major IT hubs of East India. As of April 2019, Sector V of Bidhannagar had approx 1,500 companies. | |||
New Town has emerged as the second IT hub of Kolkata after [[Salt Lake City, Kolkata|Salt Lake]]. The [[List of tech parks in Kolkata#New Town|growing number of tech parks]] makes New Town a preferred destination for IT and ITes in East India. Several Information Technology majors are operational like [[Ericsson]], Accenture, Capgemini, Tech Mahindra, ITC Infotech, Mindtree, Adani Labs, [[British Telecom]], [[Tata Consultancy Services|TCS]], [[Wipro]], [[Infosys]], [[Cognizant]] etc. New Town also houses [[Bengal Silicon Valley Tech Hub]]. | |||
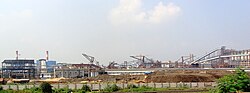
[[File:TataHitachiKgp.jpg|thumb|342x342px|Tata Hitachi plant at Vidyasagar Industrial Park in Kharagpur]] | |||
[[Bengal Silicon Valley Tech Hub]] is an under construction [[technology]] [[Business park|hub]] in the Indian state of [[West Bengal]], consisting of various [[Industrial park|tech parks]], buildings, projects and premises which work on the sectors like [[Information technology|IT]]/ITeS, [[Data Centre]], [[E-commerce]], [[Internet of things|IoT]], [[Knowledge process outsourcing|KPO]], [[Artificial intelligence|AI]], [[Research and development|R&D]] and [[Telecommunications|Telecom]]. The hub is projected to be completed in 2025, generating 1,00,000 direct jobs. As of 2022, the total investment in the hub is {{INRConvert|1|t}}. It is being built on an area of 250 acres. | |||
FinTech Hub (formerly known as ''International Financial Hub'') is a [[financial]], [[Commerce|commercial]] centre and [[business district]] located in [[New Town, Kolkata|New Town]]. The hub has the presence of a large number of banking, [[Financial services|financial]] companies and [[Law firm|legal]] institutions. Many major companies have their headquarters, offices and training centres operational or under construction. In 2010, inspired by the [[Bandra Kurla Complex]] in [[Mumbai]] and to turn Kolkata into an international financial centre, the then chief minister of West Bengal [[Buddhadeb Bhattacharjee]] and finance minister [[Asim Dasgupta]] proposed an International Financial Hub on 100 Acres of land in [[New Town, Kolkata|New Town]]. The union finance minister of that time, [[Pranab Mukherjee]] laid the foundation stone of the project on 13 October 2010. The project had a deadline to be completed in five years. In 2017, the project was relaunched as a FinTech hub. The purpose was to develop [[Fintech|financial technology]] industry in West Bengal. In 2020, 23 financial institutions had their offices setup in the hub. The first 10 acres were identified which was afterwards expanded. On 10 September 2021, HIDCO released an online portal for owing plots easily. Up to September 2021, 48 acres were allotted in 70 acres. As of 2022, 28 financial and legal institutions have their offices in FinTech hub. | |||
[[MSME]] contributes to a major portion of the GDP of West Bengal. West Bengal has the second highest MSME units in the country after [[Uttar Pradesh]]. According to [[Ministry of Statistics and Programme Implementation|National Sample Survey Office]] (NSSO) 73rd round of survey, [[West Bengal]] had 88.67 lakh MSME units (14% of total in India). | |||
[[File:TCS Gitabitan - DN 54-55 Sector V Salt Lake City - Kolkata 20170515121632.jpg|thumb|339x339px|TCS Gitobitan, Salt Lake]] | |||
There are numerous steel and other heavy engineering plants and production facilities in [[Durgapur, West Bengal|Durgapur]]. The centre has established a number of industries in the areas of tea, sugar, [[chemical]]s and [[fertiliser]]s. Natural resources like tea and [[jute]] in and nearby parts have made [[West Bengal]] a major centre for the [[jute]] and tea industries. West Bengal is at the forefront of leather processing and leather goods manufacturing and has around 666 units producing leather and leather related goods. Currently, 22-25% of India's tanning activity is undertaken in Kolkata and its suburbs. [[Kolkata Leather Complex]] is a planned leather industrial park at Karaidanga, [[Bantala]] near [[East Kolkata]]. It is Asia's largest leather complex. Bantala has approximately 500 tanneries. It already has fully operational 500 tanneries and leather goods manufacturing units on 1150 acres of land employing 5 lakh people. The investment has already been to the tune of {{INRConvert|25000|c}}. In July 2024, it was announced that it will have another 187 tanneries along with 139 footwear units entailing an investment of {{INRConvert|10000|c}} and generating employment for 2.5 lakh people.<ref>{{Cite news |date=19 July 2024 |title=Leather complex at Bantala: State expects Rs 10K cr investment, 2.5L jobs |url=https://www.millenniumpost.in/bengal/leather-complex-at-bantala-state-expects-rs-10k-cr-investment-25l-jobs-572360 |work=Millenium Post}}</ref> | |||
[[Kharagpur]] has also numerous industries of various types such as iron works, cement, chemicals, etc. The state's share of total industrial output in India was 9.8% in 1980–81, declining to 5% by 1997–98. However, the service sector has grown at a rate higher than the national rate.<ref name="hdrchap1" /> | |||
[[File:Bengal Intelligent Park - Commercial Building - Sector V - Salt Lake City - Kolkata 2016-05-09 3666.JPG|thumb|339x339px|Bengal Intelligent Park, Salt Lake]] | |||
[[File:Cognizant's Delivery Center in Kolkata - Bantala.jpg|thumb|339x339px|Cognizant, Bantala]] | |||
[[Jangal Sundari Karmanagari]] is an under construction industrial city complex and township in Jangalmahal, [[Purulia]]. Jangal Sundari Karmanagari has projected a potential investment of {{INRConvert|72000|c}}. {{INRConvert|1144|c}} has been used for creating basic infrastructures. The industrial city will generate employment for 1.5 lakh people. Major industries include cement, steel, auto component, engineering, MSME clusters, ceramics and electricals. | |||
In Phase I of the project, 1749 acres were allocated and in Phase II, 734 acres were allocated. | |||
Jangal Sundari Karmanagari has received investments from Rashmi Steel (800 acres), Shyam Steel (600 acres), Captain Steel (300 acres), Super Smelter, Maithan Alloys, Vikash Metal and Power Limited. As of March 2023, about 7 thousand people were employed in around 513 acres steel factory, which got an investment of {{INRConvert|3220|c}}. Shyam Steel is constructing has acquired 600 acres and has started construction (as of March 2023) of a steel plant in 600 acres with an investment of {{INRConvert|4591|c}} and expected employment of 10,000 people. A cement factory is under construction in 70 acres with an investment of {{INRConvert|400|c}}. | |||
[[Chittaranjan Locomotive Works]], [[Titagarh Rail Systems]], [[Texmaco Rail & Engineering]] and [[Jupiter Wagons]] are [[rolling stock]] manufacturers located in West Bengal. [[Titagarh Rail Systems]] is the second largest freight wagon manufacturer in India. [[Chittaranjan Locomotive Works]] is the largest locomotive manufacturer unit in the world, producing 431 locomotives in 2019–20. | |||
The first production unit of [[Hindustan Cables]] was set up in 1952 in [[Rupnarayanpur]], in technical collaboration with Standard Telephones and Cables Ltd. for production of paper insulated dry core cables. In 2007 updated and expanded Rupnarayanpur unit, with an installed capacity of 63 LCKM, manufactures polythene insulated jelly filled cables and aerial cables. Facilities for manufacturing 1 million pairs of telephone coiled cords and 1.5 million pieces of computer cords have been set up in the unit. The telephone cords (2 way ovular straight and 4 way ovular extensible etc.) conform to latest specification and cater to Indian market and the computer cords for Computer Industries. | |||
[[File:Modernisation of ISP.JPG|thumb|340x340px|IISCO Steel Plant, Asansol]] | |||
The [[Steel Authority of India]] [[IISCO]] (Indian Iron and Steel Company Ltd) steel-making plant at [[Kulti]] was the first such facility in India. It became well known during the 1960s and 1970s, with its company shares being traded on the [[London Stock Exchange]]. However, a decade later the company became loss-making until it was revived in 2006 when it merged with the [[Steel Authority of India]]. Modernisation at [[IISCO Steel Plant]] has helped the city develop at a very rapid pace. The plant's capacity will be raised from 0.4 MT to 2.5 MT of saleable steel, using what will be the biggest [[blast furnace]] in the country. As of 2015, the investment for modernisation was the single largest investment in West Bengal till then. | |||
The northern districts of [[Darjeeling district|Darjeeling]], [[Kalimpong district|Kalimpong]], [[Jalpaiguri district|Jalpaiguri]], [[Alipurduar district|Alipurduar]] are famous for growing tea and they are exported world-wide for their supreme taste and quality. Many tea processing units are present here which contribute to the economy of the districts. | |||
=== Semiconductor Fabrication Plant in Kolkata === | |||
Under a transformative collaboration with the [[United States]], India will get its first-ever national security semiconductor fabrication plant that will produce chips for use in military hardware in both countries as well as in critical telecommunication networks and electronics. The ambitious India-U.S. joint project was announced following talks between PM [[Narendra Modi]] and U.S. President [[Joe Biden]] in [[Wilmington, North Carolina|Wilmington]] on September 21, 2024. The first-ever India-US semiconductor fabrication partnership was described as a "watershed arrangement", according to a joint fact sheet on Modi-Biden talks.<ref>{{Cite web |title=Joint Fact Sheet: The United States and India Continue to Expand Comprehensive and Global Strategic Partnership |url=https://in.usembassy.gov/joint-fact-sheet-the-united-states-and-india-continue-to-expand-comprehensive-and-global-strategic-partnership/ |access-date=24 September 2024 |website=U.S. Embassy & Consulates in India|date=23 September 2024 }}</ref> | |||
The fab, which will be established with the objective of manufacturing [[infrared]], [[gallium nitride]] and [[silicon carbide]] semiconductors, will be enabled by support from the India Semiconductor Mission as well as a strategic technology partnership between Bharat Semi, 3rdiTech, and the U.S. Space Force. It will not only become India's first, but one of the world's first multi-material fab for national security. This facility will produce advanced semiconductors for advanced sensing, communication and power electronics, marking the first tech partnership between Indian businesses and the U.S. Space Force, as well as the first of its kind within the Quad group.<ref>{{Cite web |last=MyGovIndia |first=X |date=24 September 2024 |title=India & US Team up for Semiconductor Breakthrough |url=https://twitter.com/mygovindia/status/1838520694327620022 |access-date=24 September 2024 |website=MyGovIndia}}</ref> | |||
[[GlobalFoundries]] will set up GF Kolkata Power Center in Kolkata that will enhance mutually beneficial linkages in research and development in chip manufacturing and enable game-changing advances for zero and low emission as well as connected vehicles, internet of things devices, AI, and data centers. The semiconductor fabrication plant will be named "Durga Shakti".<ref>{{Cite web |date=23 September 2024 |title=India to get first national security semiconductor fabrication plant as part of collaboration with U.S. |url=https://www.thehindu.com/news/national/india-to-get-first-national-security-semiconductor-fabrication-plant-as-part-of-collaboration-with-us/article68672914.ece |access-date=23 September 2024 |website=The Hindu}}</ref> | |||
== Industrial parks/areas/towns in West Bengal == | |||
{| class="wikitable sortable" | |||
|+ | |||
|- | |||
!Name | |||
!Area | |||
!Location | |||
!Industrial Company/ companies | |||
!Industry | |||
|- | |||
|Panagarh Industrial Park | |||
|1458 Acres | |||
|[[Panagarh]], [[Burdwan District]] | |||
|Emami, Valve, Acer, Matix Fertilizers & Chemicals Ltd., H&R Johnson (India), HPCL, Globus Spirit Ltd., IOCL etc. | |||
|Cement, chemical fertilizers, Ammonia Plant, Urea Plant, bottling plant, Ceramic Tiles Manufacturing, distillery etc. | |||
|- | |||
|Vidyasagar Industrial Park | |||
|1167 Acres | |||
|[[Kharagpur]], [[West Medinipur]] | |||
|Tata-Hitachi, Indian Oil Corporation Limited, Orissa Aloy Steel private limited, Godrej Agrovet, Nutricraft India, Mahindra & Mahindra Limited, Megatherm Induction | |||
|Machinery, steel, oil | |||
|- | |||
|Barzora Industrial Park | |||
|432 Acres | |||
|Barzora, [[Bankura District]] | |||
|Anandabazar Patrika, Pratyaha Newspaper, X Pro India, Timespac, Nilkamal Plastics, Surya Alloy Industries, Tulip Fabrics, Steelex Electrocast, HP Ispat, Jain Spun Industries, Maan Concast, Lalwani Industrie, Embee Ferro Alloy, Jai Ambey Metals, Royal Touch Fablon etc. | |||
|Steel, plastic, newspaper, fabric, metals etc. | |||
|- | |||
|Haldia Industrial Park (WBIDC) | |||
|334 Acres | |||
|[[Haldia]], [[East Medinipur]] | |||
|Mitsubishi Chemicals Ltd., South Asian Petrochemicals Ltd, Indian Oil Corporation Limited (IOCL), Exide, Shaw Wallace, Tata Chemicals, Haldia Petrochemicals, Hindustan Lever Limited etc. | |||
|Petrochemicals and fertilizers | |||
|- | |||
|Haldia Industrial Park (WBIIDC) | |||
|120 Acres | |||
|[[Haldia]], [[East Medinipur]] | |||
|[[Exide]], [[Patanjali Ayurved]], PetroCarbon & Chemical Pvt. Ltd., Ralson Petrochemicals Ltd. | |||
|Batteries and petrochemicals | |||
|- | |||
|Raghunathpur Steel & Allied Industrial Park | |||
|1924 Acres | |||
|Raghunathpur, [[Purulia District]] | |||
|[[Damodar Valley Corporation]], Shyam Steel Industries Limited, [[Shree Cement]], DPSC limited | |||
|Thermal power, steel, cement | |||
|- | |||
|Shalbani Industrial Park | |||
|4300 Acres | |||
|[[Salboni]], [[West Medinipur]] | |||
|[[JSW Group]] | |||
|Cement, paint, steel, solar power unit, | |||
|- | |||
|Sankrail Rubber Park | |||
|170 Acres | |||
|[[Sankrail]], [[Howrah District]] | |||
|100+ companies <ref>{{Cite web |title=SARPOL Plot Holders |url=https://sarpol.co.in/plot-holders/ |website=South Asia Rubber & Polymers Park Ltd.}}</ref> | |||
|Rubber seeds, footwear, rubber hoses, tubes, micro cellular sheets, chappals, automotive rubber products etc. | |||
|- | |||
|Rishi Bankim Silpaudyan | |||
|97 Acres | |||
|[[Naihati]], [[North Twenty Four Parganas]] | |||
|Wimplast, Suguna Foods Limited, DTL Ancillary Limited, New Hope Animal Celesty Food Products, Syanchro Pack etc. | |||
|Plastics, food processing, etc. | |||
|- | |||
|Kharagpur cycle park | |||
|20 Acres | |||
|[[Kharagpur]], [[West Medinipur]] | |||
|Unirox, Milan, Luna and Krypton | |||
|Cycle production | |||
|- | |||
|Kharagpur Industrial Park | |||
|257 Acres | |||
|[[Kharagpur]], [[West Medinipur]] | |||
|Tata Iron & Steel Company Ltd., Flender Ltd., Century Extrusions Ltd., Japfa Comfed India Ltd. | |||
|Iron and steel, telecom, engineering and food processing | |||
|- | |||
|Goaltor Industrial Park | |||
|950 Acres | |||
|Goaltor, [[West Medinipur]] | |||
| | |||
| | |||
|- | |||
|Nabadiganta Industrial Township | |||
|430 Acres | |||
|[[Bidhannagar]], [[North 24 Parganas]] | |||
|See [[List of tech parks in Kolkata#Salt Lake|list of companies having tech park here]] | |||
|[[Information technology|IT]], ITeS | |||
|- | |||
|Budge Budge Garment Park | |||
|10 Acres | |||
|[[Budge Budge]], [[South 24 Parganas]] | |||
| | |||
|Garments and clothing | |||
|- | |||
|Paridhan Garment Park | |||
|8.78 Acres | |||
|[[Beliaghata]], [[Kolkata]] | |||
|Rupa, Vedanta Fashions, Prapti Fashions, Enfield Apparels, Shipra Commercial, Jagadhatri Trexim, Moustache International, Senorita Creations, Citrus Fashions, Manish Creations, Modern Tradecom, The Rajlakshmi Cotton Mills | |||
|Garments and clothing | |||
|- | |||
|Shilpangan Light Engineering Park | |||
|9.2 Acres | |||
|[[Bidhannagar]], [[North 24 Parganas]] | |||
| | |||
|Light engineering | |||
|- | |||
|West Bengal Hosiery Park | |||
|125 Acres | |||
|[[Howrah district]] | |||
| | |||
|Garments and clothing | |||
|- | |||
|Regent Garments and Apparel Park | |||
|55 Acres | |||
|[[Barasat]], [[North 24 Parganas]] | |||
| | |||
|Garments and clothing | |||
|- | |||
|EIGMEF Apparel Park | |||
|13 Acres | |||
|[[Bidhannagar]], [[North 24 Parganas]] | |||
| | |||
|Garments and clothing | |||
|- | |||
|Kona Integrated Garment Prak | |||
|21 Acres | |||
|Unsani, [[Howrah district]] | |||
| | |||
|Garments and clothing | |||
|- | |||
|Sudha Das Food Park, Sankrail | |||
|50 Acres | |||
|[[Sankrail]], [[Howrah district|Howrah]] | |||
| | |||
|Food and processing | |||
|- | |||
|Kandua Food Park | |||
|54 Acres | |||
|[[Sankrail]], [[Howrah district|Howrah]] | |||
| | |||
|Food and processing | |||
|- | |||
|Sankrail Food Park | |||
|34 Acres | |||
|[[Sankrail]], [[Howrah district|Howrah]] | |||
|[[Amul]] (world's largest curd manufacturing plant) | |||
|Food and processing | |||
|- | |||
|Sankrail Poly Park | |||
|60 Acres | |||
|[[Sankrail]], [[Howrah district|Howrah]] | |||
|Megaflex Plastics, Elkos Pens, Weilburger Coatings, W.Hunger Hydraulics, Rollx Technologies, Tenty Marketing, Accurate Polymers, Techcon India | |||
|Polymer production | |||
|- | |||
|Gems & Jewelry Park | |||
|6 Acres | |||
|Ankurhati, [[Howrah district|Howrah]] | |||
|Senco Gold Limited, Calcutta Gem & Jewellers Welfare Association, Jain Jewellers | |||
|Jewellery production | |||
|- | |||
|Haringhata Industrial Park | |||
|358 Acres | |||
|[[Nadia]] | |||
|InstaKart Services Pvt. Ltd. | |||
|Warehouse, dairy and paper | |||
|- | |||
|Kharagpur General Industrial Park | |||
|205 Acres | |||
|[[Kharagpur]], [[West Medinipur]] | |||
|Tata Metaliks, Flender McNeil etc. | |||
|Metal works | |||
|- | |||
|Fulbari Industrial Park | |||
|32 Acres | |||
|Fulbarigram, [[Jalpaiguri district]] | |||
| | |||
| | |||
|- | |||
|Dabgram Industrial Park | |||
|107 Acres | |||
|[[Dabgram]], [[Jalpaiguri district]] | |||
|Haldia Precision Engineering Pvt. Ltd., M.B. Tea & Allied Products (Pvt) Ltd., Super Treads Pvt. Ltd., Samrat Feed Mills Private Ltd. | |||
|Engineering, Cattle & Poultry Feed, Plastic & PVC objects, Food and Tea Processing | |||
|- | |||
|Shilpobroto Industrial Park | |||
|25 Acres | |||
|Binnaguri, [[Jalpaiguri district]] | |||
| | |||
| | |||
|- | |||
|INDUS Balram Industrial Park | |||
| | |||
|[[Jalpaiguri district]] | |||
| | |||
| | |||
|- | |||
|Raninagar Industrial Park | |||
|152 Acres | |||
|[[Raninagar]], [[Jalpaiguri district]] | |||
|Hindustan Coca-Cola Beverages Pvt. Ltd., Indian Oil Corporation Ltd., Terai Foods Pvt. Ltd., Sona Vets Pvt. Ltd., Amrit Feeds Ltd., JD Industries, Kusum Iron and Steel Ltd., AMD Industries Ltd., Kusum Enterprises | |||
|Beverages, Petroleum products, Agro/ Food processing, Plastic products, and Poultry feed | |||
|- | |||
|Cooch Behar Industrial Park | |||
|98 Acres | |||
|[[Chakchaka]], [[Cooch Behar district]] | |||
|Modern Agrotech Industries, Kamakshi Jute Industries, Sri Balaji Udyog, Hossain Electricals | |||
|Agro-based and jute industries, PVC and electrical industries | |||
|- | |||
|South City Anmol Infra Park | |||
|48 Acres | |||
|[[Howrah district]] | |||
| | |||
| | |||
|- | |||
|Amtala Food Park | |||
|125 Acres | |||
|[[Amtala]], [[South 24 Parganas]] | |||
| | |||
|Food processing units | |||
|- | |||
|Regent SME Industrial Park | |||
|21 Acres | |||
|[[Ankurhati]], [[Howrah district|Howrah]] | |||
| | |||
| | |||
|- | |||
|Srijan Industrial Logistic Park | |||
|24 Acres | |||
|[[Ankurhati]], [[Howrah district|Howrah]] | |||
| | |||
| | |||
|- | |||
|Jalan Complex | |||
|2000 Acres | |||
|[[Ankurhati]], [[Howrah district|Howrah]] | |||
|Sharma Gandhi Hire Purchase Ltd., Honey Vanijya Pvt. Ltd., Neptune Hydrocarbons Mfg. Pvt. Ltd., Ugi Engineering Works Pvt. Ltd., R R Proteins & Agro Ltd., Maira Fabricators Pvt. Ltd., J.K. Spices & Food Products, Tridev Engineering Pvt. Ltd., Ganesh Grains Ltd. and many more | |||
|Mixed use | |||
|- | |||
|Amta Industrial Park | |||
|1200 Acres | |||
|[[Amta]], [[Howrah district|Howrah]] | |||
| | |||
| | |||
|- | |||
|Uluberia Industrial Park (WBIDC) | |||
|129 Acres | |||
|[[Uluberia]], [[Howrah district|Howrah]] | |||
|M & M Machine Craft Pvt. Ltd., ITC, Varun Tea Plantation Ltd., Flipkart | |||
|Mixed use | |||
|- | |||
|Uluberia Industrial Park (WBIIDC) | |||
|160 Acres | |||
|[[Uluberia]], [[Howrah district|Howrah]] | |||
|CERATIZIT India Pvt. Ltd., Saj Industries Pvt . Ltd., Sintex Industries Ltd., Goel Alloy & Steel Pvt. Ltd. | |||
|Iron & Steel Products, Food processing, Plastic & PVC molding units | |||
|- | |||
|Ranihati Foundry Park | |||
|924 Acres | |||
|[[Sankrail]], [[Howrah district|Howrah]] | |||
|Nif Ispat Ltd., RRL Steels Ltd., Bhajjanka Ispat Pvt. Ltd., Pacheria Castings Pvt. Ltd., Dinesh Brothers Pvt. Ltd., Yashi Castings | |||
|Iron & Steel Products | |||
|- | |||
|Dankuni Industrial Park | |||
|777 Acres | |||
|[[Dankuni]], [[Hooghly district|Hooghly]] | |||
| | |||
| | |||
|- | |||
|Bagnan Industrial Park | |||
|23 Acres | |||
|[[Bagnan]], [[Howrah district|Howrah]] | |||
| | |||
| | |||
|- | |||
|Shaktigarh Industrial Park | |||
|3.1 Acres | |||
|[[Saktigarh, Bardhaman|Saktigarh]], [[Purba Bardhaman district|Bardhaman]] | |||
| | |||
|Electronic goods | |||
|} | |||
==Infrastructure== | ==Infrastructure== | ||
[[File:Bandel Thermal Power Station at Tribeni, Hooghly 04.jpg|thumb|301x301px|Bandel Thermal Power Station]] | |||
===Power and energy=== | ===Power and energy=== | ||
As of end of | As of end of August 2024, according to data released by Central Electricity Authority, the installed power capacity of the state is 15553.03 [[Megawatt#Megawatt|MW]], compared to 450 GW of the country. Of the total installed power capacity, 13,567 MW was contributed by thermal power, 1,986.03 MW was contributed by hydro power and renewable power together.<ref>{{cite web |title=Eastern Zone installed power capacity (in MW) |url=https://npp.gov.in/public-reports/cea/monthly/installcap/2024/AUG/capacity2-Eastern-2024-08.pdf |access-date=2024-09-24 |website=National Power Portal }}</ref> | ||
West Bengal government's ministry of power, in its report, enumerates individual power generating stations in West Bengal along with their respective locations and generating capacities while mentioning the total installed capacity as | West Bengal government's ministry of power, in its report, enumerates individual power generating stations in West Bengal along with their respective locations and generating capacities while mentioning the total installed capacity as 9,805 MW {{as of|2021|January|lc=y}}.<ref>{{cite web |title=Details of various generating stations in West Bengal (as of 01.1.2021) |url=https://wbpower.gov.in/power-scenario-in-west-bengal/ |access-date=2024-05-24 |publisher=Power Ministry, Government of West Bengal}}</ref> As of 2024, 100% of households were fully electrified.<ref>{{cite web |title=Progress report on village electrification as on 10.10.2017 |url=https://www.ddugjy.gov.in/assets/uploads/1656499638k8xo7.pdf |access-date=2024-05-24 |publisher=Deen Dayal Upadhyay Gram Jyoti Yojana}}</ref> | ||
[[File:Belghoria Expressway - Kolkata 2011-09-09 4957.JPG|thumb|300x300px|Belghoria Expressway]] | |||
===Communication and transportation=== | ===Communication and transportation=== | ||
{{as of| | {{as of|2018}}, West Bengal has a total road length of {{convert|283865|km|mi|0}}, with a road density of 1.04 km per km<sup>2</sup>. Of this, national highways constitute {{convert|3674|km|mi|0}} and state highways {{convert|3612|km|mi|0}}.<ref name=ibef2011/> {{as of|2015|June}}, the central government mulled augmenting the state's national highways' length by another couple of thousand kilometres in a bid to supplement to India's plan of seamless BBIN connectivity through Nepal, Bhutan, India, and Bangladesh, subject to availability of land, by investing in the tunes of US$4–5 billion.<ref>{{cite web|url=http://www.dnaindia.com/money/report-centre-plans-to-give-rs-25000-30000-crore-for-development-of-bengal-roads-nitin-gadkari-2098459|title=Centre plans to give Rs. 25000-30000 crore for development of Bengal roads:Nitin Gadkari|date=24 June 2015|access-date=2016-06-08}}</ref> | ||
[[File:Kolkata Metro CRRC Dalian rake 5.jpg|thumb|298x298px|Kolkata Metro CRRC Dalian rake]] | |||
===Railways=== | ===Railways=== | ||
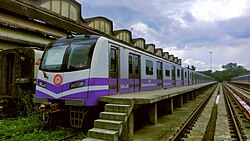
The Eastern | The [[Eastern Railway zone]], [[South Eastern Railway zone]] and [[Northeast Frontier Railway zone]] of [[Indian Railways]] run operations in West Bengal. At the end of 2023–24, the route length in West Bengal was 4,203 km of which around 4,016 km has been converted to broad gauge and around 3,906 km has been electrified, the running track length was 7,122 km and the total track length was 10,466 km, with the number of stations exceeding 800.<ref>{{cite web|url=http://www.indianrailways.gov.in/railwayboard/uploads/directorate/stat_econ/IRSP_2014-15/Year_Book_Eng/9.pdf|title=The network|publisher=Indian Railways|access-date=2016-08-30}}</ref><ref>{{cite web|url=http://www.wbidc.com/about_wb/physical_infrastructure.htm|title=Physical Infrastructure|publisher=WBIDC|access-date=2016-08-30|archive-url=https://web.archive.org/web/20120111150948/http://www.wbidc.com/about_wb/physical_infrastructure.htm|archive-date=11 January 2012|url-status=dead}}</ref> [[Kolkata Metro]] railway is the newest zone of the IR with four operational lines of total length of about 60 km. {{as of|2024}}, various other metro links of approximately 74 km route length are underway in different phases of construction in Kolkata. | ||
===Ports=== | ===Ports=== | ||
Kolkata is a major river-port in eastern India. The [[Kolkata Port Trust]] manages both the Kolkata docks and the [[Haldia]] docks.<ref name=dockport>{{cite web |url=http://www.kolkataporttrust.gov.in/ |title= Port info: cargo statistics|access-date=9 February 2012|work=Kolkata Port Trust |publisher=Kolkata Port Trust, India }}</ref> There is passenger service to [[Port Blair]] on the [[Andaman and Nicobar Islands]] and [[cargo ship]] service to [[ports in India]] and abroad, operated by the [[Shipping Corporation of India]]. Kolkata Port handled | Kolkata is a major river-port in eastern India. The [[Kolkata Port Trust]] manages both the Kolkata docks and the [[Haldia]] docks.<ref name=dockport>{{cite web |url=http://www.kolkataporttrust.gov.in/ |title= Port info: cargo statistics|access-date=9 February 2012|work=Kolkata Port Trust |publisher=Kolkata Port Trust, India }}</ref> There is passenger service to [[Port Blair]] on the [[Andaman and Nicobar Islands]] and [[cargo ship]] service to [[ports in India]] and abroad, operated by the [[Shipping Corporation of India]]. Kolkata Port handled 65.660 million tonnes (mt) of traffic in 2022–23, around 12.86% higher vis-a-vis that handled during previous fiscal. Kolkata Dock System, the first major dock formally commissioned in 1870, handled cargo traffic of 17.052 mt in 2022–23, registering a significant growth of 11.46% over the previous year. Haldia Dock Complex, the 1st green port of the country in 2015, handled 48.608 mt in 2022–23, recording growth of 11.8% over the last year. During 2022–23, 6,75,904 Container TEUs were handled at the Port vis-à-vis 7,35,195 TEUs during 2021–22. Total containerised tonnage handled at SMP, Kolkata was 10.59 million tonnes in 2022-23 vis-à-vis 11.8 million tonnes in 2021–22. Kolkata Dock System handled 5,68,722 TEUs in 2022-23 compared to 5,69,783 TEUs in 2021–22, recording a marginal decline. In 2019-20 Kolkata Dock System achieved the highest ever container throughput of 6,75,439 TEUs. Haldia Dock Complex handled 1,07,182 TEUs in 2022-23 vis-a-vis 1,65,412 TEUs in 2021–22. | ||
[[Kolkata Port]] ranked 1st in terms of coking coal & other coal handling amongst major ports of India. | |||
[[File:Aerial view of Kolkata 40.jpg|thumb|335x335px|Ferries on Hooghly River]] | |||
===Inland waterways=== | ===Inland waterways=== | ||
The 560 km long Haldia- Farakka stretch in West Bengal is part of the stretch of Ganges between Haldia and Prayagraj declared as the National Waterway | The 560 km long [[Haldia]]-[[Farakka]] stretch in West Bengal is part of the stretch of Ganges between Haldia and Prayagraj declared as the [[National Waterway 1]]. Also a 91 km long stretch of the [[National Waterway 5]] is within West Bengal. West Bengal government has sought to build infrastructure to begin sustained fuel efficient cost efficient and eco-friendly shipping operations for cargo transportation and tourism, passenger traffic as well along 12 rivers in West Bengal which can reduce congestion on roads. These rivers that has been identified for national waterways services, are the Prayagraj-Haldia stretch of the Ganga Bhagirathi Hooghly river, [[Ajay River]] (96 km), [[Mayurakshi River]] (110 km), [[Damodar River]] (135 km), DVC canal (130 km), [[Dwarakeswar River]] (113 km), [[Ichamati River]] (634 km), [[Jalangi River]] (131 km), [[Rupnarayan River]] (72 km), [[Subarnarekha River]] (314 km) and Sunderban Waterways (201 km).<ref>{{cite web|url=https://economictimes.indiatimes.com/news/economy/infrastructure/wb-government-proposes-to-introduce-inland-waterways-services/articleshow/48696665.cms|title=WB government proposes to introduce inland waterways services|work=The Times of India|access-date=2016-08-30|date=27 August 2015}}</ref><ref>{{cite web|url=http://www.thestatesman.com/mobi/news/bengal/12-rivers-in-bengal-listed-for-development/85462.html|title=12 rivers in Bengal listed for development|publisher=The Statesman|access-date=2016-08-30}}</ref> | ||
===Telecommunications=== | ===Telecommunications=== | ||
As of end of | As of end of June 2024, as per statistics published in press release of [[TRAI]], there were 81.353 million wire-less (mobile phone) subscriptions (including 23.215 million with 89.47% VLR or active connections in Kolkata service area and 58.138 million with 97.61% VLR or active connections in rest of West Bengal service area) compared to over 1170.5 million wire-less connections in the whole country with VLR or active connections of 90.75% and 1.596 million wire-line subscriptions (including 1.04 million in Kolkata and 0.556 million in rest of West Bengal) in West Bengal (with a total state-level tele-density of 82.27% {{as of|2024|June|30|lc=y}}) compared to over 35.107 million wire-line connections in the whole country (with nationwide total tele-density of 85.95%) while as of April 2016 the number of broadband subscriptions in the state were arbitrarily estimated to be around 11 million compared to that of whole of India with over 151.09 million broadband connections.<ref>{{cite web |date=20 August 2024 |title=Highlights of Telecom Subscription Data as on 30th June, 2024 |url=https://trai.gov.in/sites/default/files/PR_No.54of2024_0.pdf |access-date=2024-09-14 |publisher=Telecom Regulatory Authority of India}}</ref> | ||
VSNL has its international gateway and earth station in Kolkata. International connectivity is provided through VSNL and five STPI (Software Technology Parks of India) earth stations in Kolkata, Durgapur, Kharagpur, Haldia and siliguri. Digha has been selected as the cable landing station for the submarine cable laying project connecting India and South East Asia. | VSNL has its international gateway and earth station in Kolkata. International connectivity is provided through VSNL and five STPI (Software Technology Parks of India) earth stations in Kolkata, Durgapur, Kharagpur, Haldia and siliguri. Digha has been selected as the cable landing station for the submarine cable laying project connecting India and South East Asia. | ||
BSNL has an optical fiber network of 15000 km route in West Bengal. Reliance group's Jio Infocomm has laid 4500 km of optical fiber network in the state for its 4G network.<ref>{{cite | BSNL has an optical fiber network of 15000 km route in West Bengal. Reliance group's Jio Infocomm has laid 4500 km of optical fiber network in the state for its 4G network.<ref>{{cite news|url=https://timesofindia.indiatimes.com/tech-news/reliance-jio-to-launch-4g-in-west-bengal-by-march-2014/articleshow/20209742.cms|title=Reliance Jio to launch 4G in West Bengal by March 2014|work=The Times of India|date=22 May 2013 |access-date=2016-08-30}}</ref> Under National Optic Fibre Network (NOFN) mission, optical fibre cable will be laid in 341 blocks covering most of the gram panchayats in West Bengal. | ||
<ref>{{cite | <ref>{{cite news|url=https://timesofindia.indiatimes.com/tech-news/push-for-digital-drive-in-bengal-optic-fibre-network-in-300-blocks-soon/articleshow/49435682.cms|title=Push for digital drive in Bengal, optical fibre network in 300 blocks soon|work=The Times of India|date=18 October 2015 |access-date=2016-08-30}}</ref> | ||
[[File:Inside Netaji Subhas Chandra Bose International Airport (2).jpg|thumb|317x317px|Inside Netaji Subhas Chandra Bose International Airport]] | |||
===Aviation=== | ===Aviation=== | ||
Spread over 2640 acres at | Spread over 2640 acres at [[Dum Dum]] in Kolkata, the largest in eastern India, the newly modernised [[Netaji Subhas Chandra Bose International Airport]] is the sixth busiest international airport in India in respect of aircraft movement (after Delhi, Mumbai, Bangalore, Hyderabad and Chennai). It has two asphalt runways, the primary one extended by 700 meters (3627 × 46m) and upgraded to CATIIIB, and the secondary one (3190 × 46m) upgraded to CATII ILS standards. Its terminal is a new and sprawling L-shaped six-level integrated terminal of over 2,510,000 sq ft inaugurated in 2013, able to handle 25 million passengers per annum. It includes check-in counters that use CUTE (Common User Terminal Equipment) technology, 78 immigration counters, 12 customs counters, passenger lounges provided by Air India and Jet Airways, 18 aerobridges, 57 remote parking bays, 2 underground two-leveled carparks and car parking facilities in landscaped area capable of handling 5000 cars. The airport has a Centre for Perishable Commodities (CPC), two luxury hotels and a shopping mall.[[File:013. BAGDOGRA INTERNATIONAL AIRPORT - ENTRANCE TO AIRPORT TERMINAL DEPARTURE WINGS.jpg|thumb|315x315px|Bagdogra Airport]]In the fiscal year April 2023 to March 2024, the airport handled 1,40,879 aircraft movements including 20,078 international aircraft movements, 19.784 million passengers (including 2.4 million international passengers and 17.31 million domestic passengers), 1,51,626 metric tonnes of freight. Between the 1940s and 1960s, major airlines such as Aeroflot, Air France, Alitalia, Cathay Pacific, Japan Airlines, Philippine Airlines, KLM, Pan Am, Lufthansa, Swissair and SAS operated from the airport. | ||
With the advent of longer haul aircraft and the socio-economio-political degeneration of the state during the 1960s, several airlines gradually discontinued operations there. The withdrawal of Lufthansa's service to Frankfurt in 2012 left Kolkata with no direct flights beyond Asia. Kolkata airport is to undergo the execution of Phase 2 of the expansion plan which primarily involves the construction of an 86-meter ATC Tower. Additionally, the current Kolkata Metro expansion plans include two new lines to the airport for better connectivity.[[File:The front facade of Kazi Nazrul Islam Airport, Andal, Durgapur.jpg|thumb|313x313px|Kazi Nazrul Islam Airport, Durgapur]][[Bagdogra International Airport]], [[Siliguri]] is another significant airport in the state. It serves as the gateway to North-east India and countries like [[Bhutan]], [[Nepal]] and [[Bangladesh]]. In the fiscal year April 2023 to March 2024, the airport handled 20,838 aircraft movements including 434 international aircraft movements, 3.12 million passengers (including 21,137 international passengers and 3.09 million domestic passengers), 8,445 metric tonnes of freight. | |||
[[Kazi Nazrul Islam Airport]], [[Durgapur]] country's first private greenfield aerotropolis project spread over 650 acres, under Bengal Aerotropolis Projects Limited (BAPL) co-owned by Singapore-based Changi group, conceived in 2006–07 to be a domestic/international airport with handling capacity of 1 million per annum that can be expanded to 2.5 million per annum in future, officially commenced operations in 2015 at Andal, Durgapur 185 km away from the state capital Kolkata.<ref>{{cite web|url=http://economictimes.indiatimes.com/magazines/panache/narendra-modi-first-passenger-to-use-andal-airport/articleshow/47234884.cms|archive-url=https://web.archive.org/web/20160105062802/http://economictimes.indiatimes.com/magazines/panache/narendra-modi-first-passenger-to-use-andal-airport/articleshow/47234884.cms|url-status=dead|archive-date=5 January 2016|title=Narendra Modi first passenger to use Andal airport|date=11 May 2015|work=The Economic Times|access-date=2016-06-28}}</ref> Currently it has direct flight connections to major cities like [[Bangalore]], [[Bhubaneswar]], [[Chennai]], [[Delhi]], [[Guwahati]], [[Hyderabad]], [[Mumbai]] and [[Siliguri]]. In the fiscal year April 2023 to March 2024, the airport handled 3,234 aircraft movements, 0.51 million passengers, 491 metric tonnes of freight. | |||
[[File:Cooch Behar Airport Terminal.png|thumb|312x312px|Cooch Behar Airport Terminal]] | |||
[[Cooch Behar Airport]] is a [[domestic airport]] serving the city of [[Cooch Behar, West Bengal|Cooch Behar]] and parts of [[North Bengal]] and [[Assam]]. It is located 6.2 km (3.9 mi) from the city centre. The airport is spread over an area of 173 acres. The airport is located at an elevation of 141 feet (43 m) above mean sea level. It has one runway designated 04/22 with an asphalt surface, measuring 3,507 by 100 feet (1,069 by 30 m) without an [[instrument landing system]]. The airport can handle only flights using [[visual flight rules]] during the day. Improvements in radar as well as other runway systems have been completed, such as installation of lights on the runway, while the instrument landing system will be installed in the near future. There is presently a high security team residing in the airport which uses a [[non-directional beacon]] for navigation services. Commercial services resumed from Cooch Behar with IndiaOne Air starting flights to [[Kolkata]] on 21 February 2023. In the fiscal year April 2023 to March 2024, the airport handled 568 aircraft movements, and 4,384 passengers. | |||
[[File:Aerial View Of Salt Lake City Kolkata West Bengal IMG 9796 02.jpg|thumb|310x310px|Aerial View of Salt Lake, Kolkata]] | |||
[[File:New Town Skyline captured from Bengal Intelligent Park, Saltlake, Kolkata (2 of 2 photos).jpg|thumb|308x308px|New Town Skyline]] | |||
===Industry=== | |||
{{as of|2011}}, the state has 22 formally approved [[special economic zone]]s (SEZ).<ref>{{cite web |url= http://sezindia.nic.in/writereaddata/pdf/StatewiseDistribution-SEZ.pdf|title= SEZs: statewise distribution|publisher=Sezindia, Ministry of Commerce and Industry, Government of India|access-date=9 February 2012}}</ref> Of these, 17 are related to information technology (IT) or IT, enabled services (ITES).<ref name=ibef2011/>{{rp|28}} | |||
==Economic indices== | |||
[[File: | [[File:THE BEACH MIRRORS THE SKY.jpg|thumb|Economic production - beach net fishing at [[Digha]] Beach|305x305px]] | ||
As per the state budget presented in the state legislative assembly on 12 February 2025, West Bengal's nominal GSDP at current prices has risen to {{INRConvert|20.3|lc}} in the year 2025–26, the average INR to US$ exchange rate in that year being INR 88. West Bengal's per capita nominal GSDP at current prices for the economic year 2023-24 is {{INRConvert|171184}}. In the year 2024–25, it is expected to grow to {{INRConvert|188467}}. | |||
{{ | In terms of nominal [[Net domestic product|net state domestic product]] (NSDP) at factor cost at current prices (base year 2011–2012), West Bengal was the sixth largest economy in India, with an NSDP of {{INRConvert|18.8|lc}} in 2024-25 and in terms of nominal [[Gross domestic product|gross state domestic product]] (GSDP) at current prices, the state had GSDP of {{INRConvert|13.97|lc}} in the economic year 2022–23 as mentioned by [[Reserve Bank of India]]. In 2023–24, the [[tertiary sector of the economy]] (service industries) was the largest contributor to the gross domestic product of the state, contributing 54.13% of the state domestic product compared to 18% from [[Primary sector of the economy|primary sector]] (agriculture, forestry, mining) and 27.87% from [[Secondary sector of the economy|secondary sector]] (industrial and manufacturing).<ref name="ibef2011" />{{rp|12}} At a [[compound annual growth rate]] of 15.2%, the tertiary sector has been the fastest growing among the three sectors from 2004–05 to 2009–10.<ref name="ibef2011" />{{rp|12}} The growth has been driven by trade, hotels, real estate, finance, insurance, transport, communications and other services. | ||
== | The state's total financial debt that stood at {{INRConvert|1918|b}} {{as of|2011|lc=y}} swelled to {{INRConvert|3050|b}} at the end of 2015-16 and is estimated to further grow to {{INRConvert|6932|b}} at the end of 2024–25, although as a percentage of GSDP it is expected to decrease to about 36.88%.<ref name="etdebt">{{cite news|url=https://www.telegraphindia.com/business/bengal-s-debt-pile-balloons/cid/1683764|title=Bengal's debt pile balloons|newspaper=The Telegraph |location=New Delhi|date=22 March 2019|access-date=4 March 2019}}</ref><ref>{{cite web|url= http://m.hindustantimes.com/india/mamata-to-start-new-term-under-mountain-of-debt/story-sYFgJnDd0was96FKPcmnUJ.html|title=After huge win, Mamata to start new term under mountain of debt|work=The Hindustan Times|access-date=2016-06-22}}</ref><ref>{{Cite web |date=8 February 2024 |title=WB Finance |url=https://finance.wb.gov.in/writereaddata/Fiscal_Policy/FRBM24_Part1.pdf}}</ref> | ||
{| class="wikitable" style="text-align:center" | |||
|+GSDP growth from 1980–81 to 2024-25 <ref>{{Cite web |title=RBI Handbook of Statistics on Indian States |url=https://m.rbi.org.in/Scripts/PublicationsView.aspx?id=22091 |access-date=2024-05-24 |website=m.rbi.org.in}}</ref> | |||
!Year | |||
!GSDP (in current prices) | |||
!Growth Rate | |||
|- | |||
|1980-81 | |||
|{{INRConvert|10345|c}} | |||
| | |||
|- | |||
|1981-82 | |||
|{{INRConvert|11575|c}} | |||
|11.89% {{increase}} | |||
|- | |||
|1982-83 | |||
|{{INRConvert|13049|c}} | |||
|12.73% {{increase}} | |||
|- | |||
|1983-84 | |||
|{{INRConvert|15302|c}} | |||
|17.27% {{increase}} | |||
|- | |||
|1984-85 | |||
|{{INRConvert|17676|c}} | |||
|15.51% {{increase}} | |||
|- | |||
|1985-86 | |||
|{{INRConvert|19032|c}} | |||
|7.67% {{increase}} | |||
|- | |||
|1986-87 | |||
|{{INRConvert|20803|c}} | |||
|9.31% {{increase}} | |||
|- | |||
|1987-88 | |||
|{{INRConvert|25077|c}} | |||
|20.55% {{increase}} | |||
|- | |||
|1988-89 | |||
|{{INRConvert|27106|c}} | |||
|8.09% {{increase}} | |||
|- | |||
|1989-90 | |||
|{{INRConvert|30623|c}} | |||
|12.97% {{increase}} | |||
|- | |||
|1990-91 | |||
|{{INRConvert|34797|c}} | |||
|13.63% {{increase}} | |||
|- | |||
|1991-92 | |||
|{{INRConvert|40380|c}} | |||
|16.04% {{increase}} | |||
|- | |||
|1992-93 | |||
|{{INRConvert|43290|c}} | |||
|7.21% {{increase}} | |||
|- | |||
|1993-94 | |||
|{{INRConvert|53424|c}} | |||
|23.41% {{increase}} | |||
|- | |||
|1994-95 | |||
|{{INRConvert|62031|c}} | |||
|16.11% {{increase}} | |||
|- | |||
|1995-96 | |||
|{{INRConvert|73864|c}} | |||
|19.08% {{increase}} | |||
|- | |||
|1996-97 | |||
|{{INRConvert|82075|c}} | |||
|11.12% {{increase}} | |||
|- | |||
|1997-98 | |||
|{{INRConvert|97966|c}} | |||
|19.36% {{increase}} | |||
|- | |||
|1998-99 | |||
|{{INRConvert|115516|c}} | |||
|17.91% {{increase}} | |||
|- | |||
|1999-00 | |||
|{{INRConvert|135376|c}} | |||
|17.19% {{increase}} | |||
|- | |||
|2000-01 | |||
|{{INRConvert|143724|c}} | |||
|6.17% {{increase}} | |||
|- | |||
|2001-02 | |||
|{{INRConvert|157144|c}} | |||
|9.34% {{increase}} | |||
|- | |||
|2002-03 | |||
|{{INRConvert|168000|c}} | |||
|6.91% {{increase}} | |||
|- | |||
|2003-04 | |||
|{{INRConvert|189258|c}} | |||
|12.65% {{increase}} | |||
|- | |||
|2004-05 | |||
|{{INRConvert|208656|c}} | |||
|10.25% {{increase}} | |||
|- | |||
|2005-06 | |||
|{{INRConvert|230254|c}} | |||
|10.35% {{increase}} | |||
|- | |||
|2006-07 | |||
|{{INRConvert|261681|c}} | |||
|13.65% {{increase}} | |||
|- | |||
|2007-08 | |||
|{{INRConvert|299482|c}} | |||
|14.45% {{increase}} | |||
|- | |||
|2008-09 | |||
|{{INRConvert|341942|c}} | |||
|14.18% {{increase}} | |||
|- | |||
|2009-10 | |||
|{{INRConvert|398880|c}} | |||
|16.65% {{increase}} | |||
|- | |||
|2010-11 | |||
|{{INRConvert|460959|c}} | |||
|15.56% {{increase}} | |||
|- | |||
|2011-12 | |||
|{{INRConvert|520485|c}} | |||
|11.43% {{increase}} | |||
|- | |||
|2012-13 | |||
|{{INRConvert|591464|c}} | |||
|13.63% {{increase}} | |||
|- | |||
|2013-14 | |||
|{{INRConvert|676848|c}} | |||
|14.43% {{increase}} | |||
|- | |||
|2014-15 | |||
|{{INRConvert|718081|c}} | |||
|6.09% {{increase}} | |||
|- | |||
|2015-16 | |||
|{{INRConvert|797299|c}} | |||
|11.03% {{increase}} | |||
|- | |||
|2016-17 | |||
|{{INRConvert|872527|c}} | |||
|9.43% {{increase}} | |||
|- | |||
|2017-18 | |||
|{{INRConvert|974700|c}} | |||
|11.71% {{increase}} | |||
|- | |||
|2018-19 | |||
|{{INRConvert|1102053|c}} | |||
|13.06% {{increase}} | |||
|- | |||
|2019-20 | |||
|{{INRConvert|1179097|c}} | |||
|7% {{increase}} | |||
|- | |||
|2020-21 | |||
|{{INRConvert|1155820|c}} | |||
| -1.97% {{decrease}} | |||
|- | |||
|2021-22 | |||
|{{INRConvert|1363925|c}} | |||
|17% {{increase}} | |||
|- | |||
|2022-23 | |||
|{{INRConvert|1515564|c}} | |||
|13% {{increase}} | |||
|- | |||
|2023-24 | |||
|{{INRConvert|1651374|c}} | |||
|11% {{increase}} | |||
|- | |||
|2024-25 | |||
|{{INRConvert|1812372|c}} | |||
|10% {{increase}} | |||
|- | |||
|2025-26 (RE) | |||
|{{INRConvert|1990896|c}} | |||
|10% {{increase}} | |||
|- | |||
|2026-27(BE) | |||
| {{INRConvert|2178244|c}} | |||
|9% {{increase}} | |||
|} | |||
== Per capita income == | |||
In the year 2022–23, the per capita income of West Bengal was calculated to be {{INRConvert|141373}} at current prices. It is expected to grow to about {{INRConvert|203095}} in the year 2025–26 by extrapolating the values according to GSDP growth rate. The latest district-wise values of per capita income available was of 2013–14.<ref>{{Cite web |title=WBPSPM |url=http://wbpspm.gov.in/SiteFiles/Publications/2_09052017100008.pdf}}</ref> They are shown as below and their values extrapolated to 2022-23 and 2024-25 values respectively. | |||
{| class="wikitable sortable" style="text-align:center" | |||
|+ | |||
!District | |||
!Per capita income (2013–14) | |||
!Per capita income (2022–23) | |||
!Per capita income (2024–25) | |||
|- | |||
|[[Bankura district|Bankura]] | |||
|₹ 57,879 | |||
|₹ 1,16,796 | |||
|₹ 1,55,703 | |||
|- | |||
|[[Birbhum]] | |||
|₹ 53,122 | |||
|₹ 1,07,197 | |||
|₹ 1,42,906 | |||
|- | |||
|[[Cooch Behar district|Coochbehar]] | |||
|₹ 54,069 | |||
|₹ 1,09,108 | |||
|₹ 1,45,454 | |||
|- | |||
|[[Dakshin Dinajpur]] | |||
|₹ 50,991 | |||
|₹ 1,02,897 | |||
|₹ 1,37,174 | |||
|- | |||
|[[Darjeeling district|Darjeeling]] | |||
|₹ 87,695 | |||
|₹ 1,76,961 | |||
|₹ 2,35,910 | |||
|- | |||
|[[Howrah district|Howrah]] | |||
|₹ 70,350 | |||
|₹ 1,41,961 | |||
|₹ 1,89,251 | |||
|- | |||
|[[Hooghly district|Hooghly]] | |||
|₹ 70,102 | |||
|₹ 1,41,461 | |||
|₹ 1,88,585 | |||
|- | |||
|[[Jalpaiguri district|Jalpaiguri]] | |||
|₹ 59,652 | |||
|₹ 1,20,373 | |||
|₹ 1,60,471 | |||
|- | |||
|[[Kolkata district|Kolkata]] | |||
|₹ 1,12,737 | |||
|₹ 2,27,494 | |||
|₹ 3,55,470 | |||
|- | |||
|[[Malda district|Malda]] | |||
|₹ 50,942 | |||
|₹ 1,02,797 | |||
|₹ 1,37,041 | |||
|- | |||
|[[Murshidabad district|Murshidabad]] | |||
|₹ 50,186 | |||
|₹ 1,01,271 | |||
|₹ 1,35,006 | |||
|- | |||
|[[Nadia]] | |||
|₹ 58,870 | |||
|₹ 1,18,795 | |||
|₹ 1,58,367 | |||
|- | |||
|[[North 24 Parganas]] | |||
|₹ 66,384 | |||
|₹ 1,33,958 | |||
|₹ 1,78,583 | |||
|- | |||
|[[Paschim Bardhaman]] | |||
| rowspan="2" |₹ 81,607 | |||
| rowspan="2" |₹ 1,64,676 | |||
| rowspan="2" |₹ 2,19,533 | |||
|- | |||
|[[Purba Bardhaman]] | |||
|- | |||
|[[Paschim Medinipur]] | |||
|₹ 57,952 | |||
|₹ 1,16,942 | |||
|₹ 1,55,898 | |||
|- | |||
|[[Purba Medinipur]] | |||
|₹ 87,082 | |||
|₹ 1,75,725 | |||
|₹ 2,34,262 | |||
|- | |||
|[[Purulia district|Purulia]] | |||
|₹ 50,074 | |||
|₹ 1,01,046 | |||
|₹ 1,34,707 | |||
|- | |||
|[[South 24 Parganas]] | |||
|₹ 56,983 | |||
|₹ 1,14,988 | |||
|₹ 1,53,292 | |||
|- | |||
|[[Uttar Dinajpur]] | |||
|₹ 39,720 | |||
|₹ 80,152 | |||
|₹ 1,06,852 | |||
|- | |||
![[West Bengal]] | |||
!₹ 70,059 | |||
!₹ 1,41,373 | |||
!₹ 1,88,467 | |||
|} | |||
== | == Multidimensional poverty == | ||
According to a report released by [[NITI Aayog]] in 2023 on [[Multidimensional Poverty Index]], West Bengal had a poverty rate of 11.89% as compared to 14.96% at national level in the years 2019–21.<ref>{{Cite web |date=17 July 2023 |title=National Multidimensional Poverty Index |url=https://www.niti.gov.in/sites/default/files/2023-08/India-National-Multidimentional-Poverty-Index-2023.pdf }}</ref> It further decreased to 8.60% in 2022-23 (projected) as compared to 11.28% at national level. Several socialist schemes have helped to reduce poverty and maintain equality of income in the state. The district-wise values of multidimensional poverty is as follows- | |||
{| class="wikitable sortable | {| class="wikitable sortable" style="text-align:center" | ||
|+Multidimensional Poverty Headcount (district-wise) | |||
!District | !District | ||
! | !Poverty Headcount (2015–16) | ||
! | !Poverty Headcount (2019–21) | ||
!Poverty Headcount (2022–23) | |||
(Projected) | |||
|- | |- | ||
|[[ | |[[Bankura district|Bankura]] | ||
| | |26.99% | ||
| | |{{decreasepositive}} 18.49% | ||
|{{decreasepositive}} 13.37% | |||
|- | |- | ||
|[[ | |[[Birbhum]] | ||
| | |27.35% | ||
| | |{{decreasepositive}} 18.27% | ||
|{{decreasepositive}} 13.21% | |||
|- | |- | ||
|[[ | |[[Cooch Behar district|Coochbehar]] | ||
| | |21.90% | ||
| | |{{decreasepositive}} 10.31% | ||
|{{decreasepositive}} 7.46% | |||
|- | |- | ||
|[[ | |[[Dakshin Dinajpur]] | ||
| | |22.48% | ||
| | |{{decreasepositive}} 13.37% | ||
|{{decreasepositive}} 9.67% | |||
|- | |- | ||
|[[ | |[[Darjeeling district|Darjeeling]] | ||
| | |11.32% | ||
| | |{{decreasepositive}} 5.45% | ||
|{{decreasepositive}} 3.94% | |||
|- | |- | ||
|[[Howrah district|Howrah]] | |[[Howrah district|Howrah]] | ||
| | |12.84% | ||
| | |{{decreasepositive}} 6.06% | ||
|{{decreasepositive}} 4.38% | |||
|- | |- | ||
|[[Hooghly district|Hooghly]] | |[[Hooghly district|Hooghly]] | ||
| | |14.93% | ||
| | |{{decreasepositive}} 7.36% | ||
|{{decreasepositive}} 5.32% | |||
|- | |- | ||
|[[ | |[[Jalpaiguri district|Jalpaiguri]] | ||
| | |21.83% | ||
|{{decreasepositive}} 8.85% | |||
|{{decreasepositive}} 6.40% | |||
| | |||
| | |||
|- | |- | ||
|[[Kolkata district|Kolkata]] | |[[Kolkata district|Kolkata]] | ||
| | |2.72% | ||
| | |{{decreasepositive}} 2.56% | ||
|{{decreasepositive}} 1.85% | |||
|- | |- | ||
|[[ | |[[Malda district|Malda]] | ||
| | |34.48% | ||
| | |{{decreasepositive}} 15.57% | ||
|{{decreasepositive}} 11.26% | |||
|- | |- | ||
|[[Murshidabad district|Murshidabad]] | |[[Murshidabad district|Murshidabad]] | ||
| | |27.23% | ||
| | |{{decreasepositive}} 16.55% | ||
|{{decreasepositive}} 11.97% | |||
|- | |- | ||
|[[ | |[[Nadia]] | ||
| | |11.07% | ||
| | |{{decreasepositive}} 8.20% | ||
|{{decreasepositive}} 5.93% | |||
|- | |- | ||
|[[ | |[[North 24 Parganas]] | ||
| | |9.80% | ||
| | |{{decreasepositive}} 4.37% | ||
|{{decreasepositive}} 3.16% | |||
|- | |- | ||
|[[ | |[[Paschim Bardhaman]] | ||
| | | rowspan="2" |20.33% | ||
| | |{{decreasepositive}} 11.20% | ||
|{{decreasepositive}} 8.10% | |||
|- | |- | ||
|[[ | |[[Purba Bardhaman]] | ||
| | |{{decreasepositive}} 14.32% | ||
| | |{{decreasepositive}} 10.36% | ||
|- | |- | ||
|[[ | |[[Paschim Medinipur]] | ||
| | |23.82% | ||
| | |{{decreasepositive}} 18.14% | ||
|{{decreasepositive}} 13.12% | |||
|- | |- | ||
|[[ | |[[Purba Medinipur]] | ||
| | |14.19% | ||
| | |{{decreasepositive}} 12.48% | ||
|{{decreasepositive}} 9.03% | |||
|- | |- | ||
|[[Purulia district|Purulia]] | |[[Purulia district|Purulia]] | ||
| | |49.69% | ||
| | |{{decreasepositive}} 26.84% | ||
|{{decreasepositive}} 19.41% | |||
|- | |||
|[[South 24 Parganas]] | |||
|28.10% | |||
|{{decreasepositive}} 10.96% | |||
|{{decreasepositive}} 7.93% | |||
|- | |||
|[[Uttar Dinajpur]] | |||
|42.84% | |||
|{{decreasepositive}} 21.65% | |||
|{{decreasepositive}} 15.66% | |||
|- | |- | ||
![[West Bengal]] | |||
!21.29% | |||
!{{decreasepositive}} 11.89% | |||
!{{decreasepositive}} 8.60% | |||
|} | |} | ||
==Foreign direct investment== | ==Foreign direct investment== | ||
Under the overall guidance and policies of the government of India, the West Bengal government welcomes foreign technology and investments as may be appropriate for the needs of the state and is mutually advantageous.<ref name=wbidcpolicies>{{cite web| url=http://www.wbidc.com/about_wb/policies_approvals.htm|title=Policies and approval: foreign direct investment (FDI) policy|publisher=West Bengal Industrial Development Corporation| access-date=5 March 2012}}</ref> Foreign direct investment has mostly come in the manufacturing and telecommunication sectors.<ref name=et1012012>{{cite news|url= http://articles.economictimes.indiatimes.com/2012-01-10/news/30611933_1_pwc-india-ambarish-dasgupta-global-best-practices | title= PwC sees need for FDI in West Bengal| last= Mazumdar| first= Rakhi| newspaper=The Economic Times|location= New Delhi|date=10 January 2012|access-date=5 March 2012}}</ref> According to the Department of | Under the overall guidance and policies of the government of India, the West Bengal government welcomes foreign technology and investments as may be appropriate for the needs of the state and is mutually advantageous.<ref name=wbidcpolicies>{{cite web| url=http://www.wbidc.com/about_wb/policies_approvals.htm| title=Policies and approval: foreign direct investment (FDI) policy| publisher=West Bengal Industrial Development Corporation| access-date=5 March 2012| archive-date=5 April 2012| archive-url=https://web.archive.org/web/20120405152917/http://www.wbidc.com/about_wb/policies_approvals.htm| url-status=dead}}</ref> Foreign direct investment has mostly come in the manufacturing and telecommunication sectors.<ref name=et1012012>{{cite news|url= http://articles.economictimes.indiatimes.com/2012-01-10/news/30611933_1_pwc-india-ambarish-dasgupta-global-best-practices |archive-url= https://web.archive.org/web/20130505082441/http://articles.economictimes.indiatimes.com/2012-01-10/news/30611933_1_pwc-india-ambarish-dasgupta-global-best-practices |url-status= dead |archive-date= 5 May 2013 | title= PwC sees need for FDI in West Bengal| last= Mazumdar| first= Rakhi| newspaper=The Economic Times|location= New Delhi|date=10 January 2012|access-date=5 March 2012}}</ref> According to the Department for Promotion of Industry and Internal Trade, Government of India, West Bengal attracted a cumulative FDI investment of ₹13,346.32 crores (US$1,723 million) from October 2019 to September 2024.<ref>{{Cite web |date=20 September 2024 |title=FDI Factsheet |url=https://dpiit.gov.in/sites/default/files/FDI%20Factsheet%20September%202024.pdf |website=Department for Promotion of Industry and Internal Trade}}</ref> | ||
==Exports== | ==Exports== | ||
West Bengal is one of the country's leading exporters of finished leather goods. In | West Bengal is one of the country's leading exporters of finished leather goods. In 2023–24, the state accounted for around 6% of the country's exports of leather and leather products. The state accounted for around 70% of India's dried flower exports in 2008–09. The state is also a leading exporter of shrimps and tea. | ||
However, the rapid industrialisation process has given rise to debate over land acquisition for industry in this agrarian state.<ref name=landproblem>{{cite web | However, the rapid industrialisation process has given rise to debate over land acquisition for industry in this agrarian state.<ref name=landproblem>{{cite web | ||
| Line 311: | Line 1,001: | ||
| access-date = 29 October 2006| last = Ray Choudhury| first = R| date = 27 October 2006 | | access-date = 29 October 2006| last = Ray Choudhury| first = R| date = 27 October 2006 | ||
| publisher = The Hindu Business Line}}</ref> [[NASSCOM]]–[[Gartner]] ranks West Bengal power infrastructure the best in the country.<ref name=hannoverindia>{{cite web| url = http://www.indiaathannover.org/pdf/exhibitorslist.pdf| title = West Bengal Industrial Development Corporation Ltd.| access-date = 7 September 2006| work = India @ Hannover Messe 2006| publisher = Engineering Export Promotion Council (EEPC), India| pages = 303| archive-url = https://web.archive.org/web/20060921080017/http://www.indiaathannover.org/pdf/exhibitorslist.pdf| archive-date = 21 September 2006| url-status = dead}}</ref> | | publisher = The Hindu Business Line}}</ref> [[NASSCOM]]–[[Gartner]] ranks West Bengal power infrastructure the best in the country.<ref name=hannoverindia>{{cite web| url = http://www.indiaathannover.org/pdf/exhibitorslist.pdf| title = West Bengal Industrial Development Corporation Ltd.| access-date = 7 September 2006| work = India @ Hannover Messe 2006| publisher = Engineering Export Promotion Council (EEPC), India| pages = 303| archive-url = https://web.archive.org/web/20060921080017/http://www.indiaathannover.org/pdf/exhibitorslist.pdf| archive-date = 21 September 2006| url-status = dead}}</ref> | ||
{| class="wikitable sortable" | |||
|+Export Goods from West Bengal (2023–24)<ref>{{Cite web |title=NIRYAT Portal |url=https://niryat.gov.in/india#?start_date=202304&end_date=202403&default_table=default&sort_table=export_achieved-sort-desc&state_code=10}}</ref> | |||
!Commodity group | |||
!Total Exports | |||
Apr'23 - Mar'24 | |||
($ million) | |||
!% share of total exports | |||
!Total Exports | |||
Apr'24 - Dec'24 | |||
($ million) | |||
!% share of total exports | |||
|- | |||
|Engineering Goods | |||
|3,134.81 | |||
|26.83% | |||
|2,292.48 | |||
|28.29% | |||
|- | |||
|Gems and Jewellery | |||
|1,485.27 | |||
|12.71% | |||
|1,277.46 | |||
|13.94% | |||
|- | |||
|Leather and Leather Manufactures | |||
|696.33 | |||
|5.96% | |||
|530.03 | |||
|5.78% | |||
|- | |||
|Organic and Inorganic Chemicals | |||
|577.6 | |||
|4.94% | |||
|512.04 | |||
|5.59% | |||
|- | |||
|Petroleum Products | |||
|560.61 | |||
|4.80% | |||
|469.57 | |||
|5.12% | |||
|- | |||
|Marine Products | |||
|513.12 | |||
|4.39% | |||
|434.35 | |||
|4.74% | |||
|- | |||
|Electronic Goods | |||
|470.84 | |||
|4.03% | |||
|263.58 | |||
|2.88% | |||
|- | |||
|Rice | |||
|432.59 | |||
|3.70% | |||
|433.56 | |||
|4.73% | |||
|- | |||
|Plastic and Linoleum | |||
|357.05 | |||
|3.06% | |||
|248.25 | |||
|2.71% | |||
|- | |||
|Ready-made garments of all textiles | |||
|321.05 | |||
|2.75% | |||
|227.58 | |||
|2.48% | |||
|- | |||
|Cereal preparations and misc. processed items | |||
|262.78 | |||
|2.25% | |||
|134.28 | |||
|1.47% | |||
|- | |||
|Jute Manufacturing including floor covering | |||
|229.45 | |||
|1.96% | |||
|194.90 | |||
|2.13% | |||
|- | |||
|Tea | |||
|198.99 | |||
|1.70% | |||
|177.67 | |||
|1.94% | |||
|- | |||
|Cotton Yarn/Fabrics/Madeups, Handloom products, etc. | |||
|174.02 | |||
|1.49% | |||
|144.21 | |||
|1.57% | |||
|- | |||
|Iron Ore | |||
|166.83 | |||
|1.43% | |||
|2.51 | |||
|0.03% | |||
|- | |||
|Mica, coal and other ores, minerals including process | |||
|154.56 | |||
|1.32% | |||
|110.45 | |||
|1.21% | |||
|- | |||
|Man-Made yarn/fabrics/madeups etc. | |||
|121.69 | |||
|1.04% | |||
|65.36 | |||
|0.71% | |||
|- | |||
!Total | |||
!11,684.64 | |||
!2.67% | |||
!9,164.00 | |||
!3.20% | |||
|} | |||
The district-wise export data is also available from the [[Ministry of Commerce and Industry (India)|Ministry of Commerce and Industry]] dashboard.<ref>{{Cite web |title=Export Dashboard |url=https://dashboard.commerce.gov.in/commercedashboard.aspx |website=[[Ministry of Commerce and Industry (India)|Ministry of Commerce and Industry]]}}</ref> | |||
{| class="wikitable sortable" | |||
|+District-wise Exports from West Bengal | |||
!District | |||
!Total Exports (Apr'23 - Mar'24) | |||
|- | |||
|[[Alipurduar district|Alipurduar]] | |||
|{{INRConvert|1420.36|c}} | |||
|- | |||
|[[Bankura district|Bankura]] | |||
|{{INRConvert|754.24|c}} | |||
|- | |||
|[[Birbhum]] | |||
|{{INRConvert|959.89|c}} | |||
|- | |||
|[[Cooch Behar district|Coochbehar]] | |||
|{{INRConvert|154.08|c}} | |||
|- | |||
|[[Dakshin Dinajpur]] | |||
|{{INRConvert|259.02|c}} | |||
|- | |||
|[[Darjeeling district|Darjeeling]] | |||
|{{INRConvert|1238.11|c}} | |||
|- | |||
|[[Howrah district|Howrah]] | |||
|{{INRConvert|11108.81|c}} | |||
|- | |||
|[[Hooghly district|Hooghly]] | |||
|{{INRConvert|4089.29|c}} | |||
|- | |||
|[[Jalpaiguri district|Jalpaiguri]] | |||
|{{INRConvert|2888.71|c}} | |||
|- | |||
|[[Jhargram district|Jhargram]] | |||
|{{INRConvert|123.36|c}} | |||
|- | |||
|[[Kalimpong district|Kalimpong]] | |||
|{{INRConvert|7.70|c}} | |||
|- | |||
|[[Kolkata district|Kolkata]] | |||
|{{INRConvert|38917.16|c}} | |||
|- | |||
|[[Malda district|Malda]] | |||
|{{INRConvert|730.93|c}} | |||
|- | |||
|[[Murshidabad district|Murshidabad]] | |||
|{{INRConvert|1023.83|c}} | |||
|- | |||
|[[Nadia]] | |||
|{{INRConvert|267.94|c}} | |||
|- | |||
|[[North 24 Parganas]] | |||
|{{INRConvert|4178.81|c}} | |||
|- | |||
|[[Paschim Bardhaman]] | |||
|{{INRConvert|7104.05|c}} | |||
|- | |||
|[[Purba Bardhaman]] | |||
|{{INRConvert|3229.17|c}} | |||
|- | |||
|[[Paschim Medinipur]] | |||
|{{INRConvert|2708.51|c}} | |||
|- | |||
|[[Purba Medinipur]] | |||
|{{INRConvert|10313.39|c}} | |||
|- | |||
|[[Purulia district|Purulia]] | |||
|{{INRConvert|965.41|c}} | |||
|- | |||
|[[South 24 Parganas]] | |||
|{{INRConvert|3068.24|c}} | |||
|- | |||
|[[Uttar Dinajpur]] | |||
|{{INRConvert|1227.92|c}} | |||
|- | |||
![[West Bengal]] | |||
!{{INRConvert|102556|c}} | |||
|} | |||
== Sustainable Development Goals == | |||
[[NITI Aayog]] releases [[Sustainable Development Goals]] reports at regular intervals. The first report was released in 2018 where West Bengal had a composite score of 56 as compared to 57 of India.<ref>{{Cite web |date=2018 |title=NITI Aayog SDG Report 2018 |url=https://www.niti.gov.in/sites/default/files/2020-07/SDX_Index_India_Baseline_Report_21-12-2018.pdf |access-date=10 August 2024}}</ref> The next report was released in 2019-20 where West Bengal had a composite score of 60 which was the same at the national level.<ref>{{Cite web |date=2019 |title=NITI Aayog SDG Report 2019-20 |url=https://www.niti.gov.in/sites/default/files/2020-07/SDG-India-Index-2.0.pdf}}</ref> In the third edition of the report released in 2020–21, West Bengal scored 62 while the national average rose to 66.<ref>{{Cite web |title=NITI Aayog SDG Report 2020-21 |url=https://www.niti.gov.in/writereaddata/files/SDG_3.0_Final_04.03.2021_Web_Spreads.pdf |url-status=dead |archive-url=https://web.archive.org/web/20220802005005/https://www.niti.gov.in/writereaddata/files/SDG_3.0_Final_04.03.2021_Web_Spreads.pdf |archive-date=2 August 2022}}</ref> In the latest edition of the report during 2023-24 released on 12 July 2024, West Bengal saw a massive improvement of composite score to 70 putting it in the front-runner category while the national average rose to 71.<ref>{{Cite web |date=12 July 2024 |title=NITI Aayog SDG Report 2023-24 |url=https://www.niti.gov.in/sites/default/files/2024-07/SDA_INDIA.pdf}}</ref> The goal-wise scores of West Bengal over the years is given below: | |||
{| class="wikitable" style="text-align:center" | |||
|+Year-wise Sustainable Development Goal Scores | |||
!No. | |||
!SDG Goals | |||
!2018 | |||
!2019-20 | |||
!2020-21 | |||
!2023-24 | |||
|- | |||
|1 | |||
|No Poverty | |||
|57 | |||
|{{Decrease}} 52 | |||
|{{Increase}} 59 | |||
|{{Increase}} 63 | |||
|- | |||
|2 | |||
|Zero Hunger | |||
|50 | |||
|{{Decrease}} 40 | |||
|{{Increase}} 46 | |||
|{{Increase}} 56 | |||
|- | |||
|3 | |||
|Good Health and Well-being | |||
|66 | |||
|{{Increase}} 70 | |||
|{{Increase}} 76 | |||
|{{Increase}} 79 | |||
|- | |||
|4 | |||
|Quality Education | |||
|51 | |||
|{{Decrease}} 50 | |||
|{{Increase}} 54 | |||
|{{Increase}} 60 | |||
|- | |||
|5 | |||
|Gender Equality | |||
|40 | |||
|{{Decrease}} 38 | |||
|{{Increase}} 41 | |||
|{{Increase}} 45 | |||
|- | |||
|6 | |||
|Clean Water and Sanitation | |||
|54 | |||
|{{Increase}} 83 | |||
|{{Decrease}} 81 | |||
|{{Increase}} 86 | |||
|- | |||
|7 | |||
|Affordable and Clean Energy | |||
|40 | |||
|{{Increase}} 58 | |||
|{{Increase}} 98 | |||
|{{Increase}} 100 | |||
|- | |||
|8 | |||
|Decent Work and Economic Growth | |||
|63 | |||
|{{Increase}} 72 | |||
|{{Decrease}} 57 | |||
|{{Increase}} 63 | |||
|- | |||
|9 | |||
|Industry, Innovation and Infrastructure | |||
|45 | |||
|{{Increase}} 68 | |||
|{{Decrease}} 53 | |||
|{{Increase}} 66 | |||
|- | |||
|10 | |||
|Reduced Inequality | |||
|76 | |||
|{{Decrease}} 73 | |||
|{{Decrease}} 71 | |||
|{{Decrease}} 70 | |||
|- | |||
|11 | |||
|Sustainable Cities and Communities | |||
|25 | |||
|{{Increase}} 34 | |||
|{{Increase}} 45 | |||
|{{Increase}} 54 | |||
|- | |||
|12 | |||
|Responsible Consumption and Production | |||
| - | |||
|57 | |||
|{{Increase}} 79 | |||
|{{Increase}} 94 | |||
|- | |||
|13 | |||
|Climate Action | |||
| - | |||
|37 | |||
|{{Increase}} 39 | |||
|{{Increase}} 44 | |||
|- | |||
|14 | |||
|Life Below Water | |||
| - | |||
|43 | |||
|{{Increase}} 50 | |||
|{{Increase}} 100 | |||
|- | |||
|15 | |||
|Life on Land | |||
|88 | |||
|{{Steady}} 88 | |||
|{{Decrease}} 53 | |||
|{{Increase}} 91 | |||
|- | |||
|16 | |||
|Peace, Justice and Strong Institutions | |||
|72 | |||
|{{Increase}} 73 | |||
|{{Increase}} 81 | |||
|{{Increase}} 82 | |||
|- | |||
! | |||
!Composite | |||
!56 | |||
!{{Increase}} 60 | |||
!{{Increase}} 62 | |||
!{{Increase}} 70 | |||
|} | |||
== Further reading == | == Further reading == | ||
Revision as of 10:07, 22 March 2026
 Kolkata, the financial centre and capital of West Bengal | |
| Currency | Indian Rupee (INR, ₹) |
|---|---|
| 1 April – 31 March | |
Trade organizations | As part of the Union of India, as in G4, G-20, BRICS, WTO, WCO, SAFTA, BIMSTEC, WFTU, BIS, AIIB, ADB and others |
Country group |
|
| Statistics | |
| Population |  91,347,736 (2011 census) 91,347,736 (2011 census)
 106,031,000 (2026 est.) [3] 106,031,000 (2026 est.) [3] |
| GDP | ₹22.78 lakh crore (US$320 billion) (2026-27 FY est.)₹102.3 lakh crore (US$1.4 trillion) (GDP PPP) (2026-27 FY est.)[4][5] |
| GDP rank | 6th |
GDP growth | 11.85% (Nominal) (2025-26 FY) 8.62% (Real) (2025-2026 FY)[6] |
GDP per capita | ₹214,877 (US$3,000) (2026-2027 FY)[7] |
GDP per capita rank | |
GDP by sector |  Agriculture: 17.13% Industry: 29.77% Services: 53.10% Agriculture: 17.13% Industry: 29.77% Services: 53.10% (2026–27)[8] |
| Template:Decreasepositive 3.63% (June, 2025 FY)[9] | |
Population below poverty line | Template:Decreasepositive 8.60% 15th in poverty (2022-23)[10] |
 0.25 (2023-24) low [11] 0.25 (2023-24) low [11] | |
| 0.674 (2023) medium [12] | |
| Unemployment | 3.4% (2021-22)[13] |
Main industries | Mining • Steel • IT • Financial services • Manufacturing • Tourism • Chemicals • Leather • Tea • Food processing • Textiles • Cement • Jute • Jewellery • Marine |
| External | |
| Exports | ₹147,259 crore (US$21 billion) (2025-26 FY) • Software exports : ₹40,000 crore (US$5.6 billion) (2025-26) [14]• Merchandise exports : ₹107,259 crore (US$15 billion) (2025-26) [15] |
Export goods | IT[16] • metro rolling stock[17] • warships[18] • gold products • tea • iron and steel • precious metals • marine products • rice • textile products • agricultural products • coal • petrochemicals • leather products • jute • heavy machinery |
Main export partners | |
FDI stock | ₹13,945.50 crore (US$2.0 billion) (Oct 2019 - Dec 2024) [24] |
| Public finances | |
| Template:Decreasepositive 37.98% of GSDP (2026–27 est.)[8] | |
| Template:Decreasepositive ₹−74,532 crore (US$−10 billion) (3.4% of GSDP) (2026–27 est.)[8] | |
| Revenues | ₹2.88 lakh crore (US$40 billion) (2026–27 est.)[8] |
| Expenses | Template:Decreasepositive ₹3.07 lakh crore (US$43 billion) (2026–27 est.)[8] |
All values, unless otherwise stated, are in US dollars. | |


The economy of West Bengal is a mixed middle-income developing social market economy and the largest Eastern Indian economy with a substantial public sector. It is India's sixth-largest economy by nominal GDP and contributes to about 6.15% of India's total GDP.
West Bengal is the primary business and financial hub of Eastern India. The state is primarily dependent on agriculture and medium-sized industry. West Bengal has jute and tea industry. West Bengal is rich in minerals like coal, limestone, iron ore, copper, lead and zinc.
Since the independence of India, The Green Revolution bypassed the state. However, there has been a significant spurt in food production since the 1980s.[25]
Agriculture and livestock
- Agriculture (17.1%)
- Industry (29.8%)
- Services (53.1%)
Agriculture accounts for the largest share of the labour force. It contributed around 17.13% to the gross state domestic product (GSDP) in 2024–25. A plurality of the state's population are peasant farmers.
Major produce
Rice and potato are considered to be the principal food crops. The state is the largest source of the important food crop of rice, a staple diet across India, with an annual output of around 16.76 million tonnes (about 13% of total production in India) in FY 2021–22, and the second-largest producer of potatoes in India with an average annual output of 12 million tonnes (about 20% of total production in India) in FY 21–22.[26] West Bengal is also the second-largest fish producing state in India after Andhra Pradesh with an annual production of 20.45 lakh tonnes.[27]:16
Apart from these, jute, sugarcane and wheat are the top crops of the state.[28]:14 Other major food crops include maize, pulses, oil seeds, wheat, barley, and vegetables. Tea is another important cash crop. Darjeeling is globally recognised for tea plantation of the acclaimed Darjeeling tea variety.
Below is a table of 2019 national output share of select agricultural crops and allied segments in West Bengal based on 2011 prices.[29]
| Segment | National share % |
|---|---|
| Jute | 88 |
| Betel | 75.2 |
| Mesta | 40.9 |
| Cauliflower | 40.5 |
| Brinjal | 33.6 |
| Sweet potato | 32.6 |
| Tea | 28.9 |
| Cabbage | 27 |
| Jackfruit | 26.8 |
| Pineapple | 25.2 |
| Potato | 24.7 |
| Narcotics | 24.2 |
| Okra | 23.3 |
| Radish | 23.2 |
| Inland fish | 22.6 |
| Grass pea | 21 |
| Litchi | 18.7 |
| Sesamum | 15.3 |
| Guava | 13.7 |
| Masoor | 13.1 |
| Sapota | 13.1 |
| Paddy | 12.4 |
| Papaya | 11.9 |
| Egg | 11.3 |
| Cashew nut | 9.6 |
| Mango | 9.2 |
| Tomato | 9.1 |
| Meat | 9.1 |
| Marine fish | 8.9 |
| Water melon | 7.9 |
| Green pea | 7.2 |
| Chilli | 7.2 |
| Cereal | 7 |
| Dung | 7 |
| Rapeseed and mustard | 6.8 |
| Banana | 5.9 |
| Straw and stalk | 5.4 |
| Ginger | 5.3 |
| Kitchen garden | 5.3 |
| San hemp | 4.5 |
| Garlic | 3.4 |
| Moong | 2.8 |
It is also the second largest tea-producing state in India, producing 414.08 million kg of tea in 2022–23, accounting for 30.3% of the country's total tea production. In 2022–23, West Bengal produced approximately 1.48 million tonnes of sugarcane and 3.86 million tonnes of fruits. The state is the largest vegetables producing state in India with 26354.61 thousand MT of production in 2020.
West Bengal accounts for nearly 10% of the country's edible oil production. The state produced a total of 2.045 million tonnes of fish in 2022–23 as compared to 1.84 million tonnes during 2021-22 retaining second spot after Andhra Pradesh in fish production. West Bengal produced around 7649.74 thousand tonnes of milk in FY 23–24.
The state is the largest meat producing state in the country (including poultry), producing 1.293 million tonnes of meat in 2023-24.[30]
Industry
State industries are mostly localised in the cities of Durgapur, Asansol, Howrah, Kharagpur and Haldia region.[31] There are up to 10,000 registered factories in the state and the West Bengal state government has opened Shilpa Sathi (শিল্পসাথী), a single window agency in order to provide investors with all kinds of assistance in establishing and running industrial units.[32]
Kolkata is noted as one of the major centres for industries including the IT industry. The planned cities of Bidhannagar and New Town, Kolkata are major IT hubs of East India. As of April 2019, Sector V of Bidhannagar had approx 1,500 companies. New Town has emerged as the second IT hub of Kolkata after Salt Lake. The growing number of tech parks makes New Town a preferred destination for IT and ITes in East India. Several Information Technology majors are operational like Ericsson, Accenture, Capgemini, Tech Mahindra, ITC Infotech, Mindtree, Adani Labs, British Telecom, TCS, Wipro, Infosys, Cognizant etc. New Town also houses Bengal Silicon Valley Tech Hub.

Bengal Silicon Valley Tech Hub is an under construction technology hub in the Indian state of West Bengal, consisting of various tech parks, buildings, projects and premises which work on the sectors like IT/ITeS, Data Centre, E-commerce, IoT, KPO, AI, R&D and Telecom. The hub is projected to be completed in 2025, generating 1,00,000 direct jobs. As of 2022, the total investment in the hub is ₹1 trillion (US$14 billion). It is being built on an area of 250 acres.
FinTech Hub (formerly known as International Financial Hub) is a financial, commercial centre and business district located in New Town. The hub has the presence of a large number of banking, financial companies and legal institutions. Many major companies have their headquarters, offices and training centres operational or under construction. In 2010, inspired by the Bandra Kurla Complex in Mumbai and to turn Kolkata into an international financial centre, the then chief minister of West Bengal Buddhadeb Bhattacharjee and finance minister Asim Dasgupta proposed an International Financial Hub on 100 Acres of land in New Town. The union finance minister of that time, Pranab Mukherjee laid the foundation stone of the project on 13 October 2010. The project had a deadline to be completed in five years. In 2017, the project was relaunched as a FinTech hub. The purpose was to develop financial technology industry in West Bengal. In 2020, 23 financial institutions had their offices setup in the hub. The first 10 acres were identified which was afterwards expanded. On 10 September 2021, HIDCO released an online portal for owing plots easily. Up to September 2021, 48 acres were allotted in 70 acres. As of 2022, 28 financial and legal institutions have their offices in FinTech hub.
MSME contributes to a major portion of the GDP of West Bengal. West Bengal has the second highest MSME units in the country after Uttar Pradesh. According to National Sample Survey Office (NSSO) 73rd round of survey, West Bengal had 88.67 lakh MSME units (14% of total in India).

There are numerous steel and other heavy engineering plants and production facilities in Durgapur. The centre has established a number of industries in the areas of tea, sugar, chemicals and fertilisers. Natural resources like tea and jute in and nearby parts have made West Bengal a major centre for the jute and tea industries. West Bengal is at the forefront of leather processing and leather goods manufacturing and has around 666 units producing leather and leather related goods. Currently, 22-25% of India's tanning activity is undertaken in Kolkata and its suburbs. Kolkata Leather Complex is a planned leather industrial park at Karaidanga, Bantala near East Kolkata. It is Asia's largest leather complex. Bantala has approximately 500 tanneries. It already has fully operational 500 tanneries and leather goods manufacturing units on 1150 acres of land employing 5 lakh people. The investment has already been to the tune of ₹25,000 crore (US$3.5 billion). In July 2024, it was announced that it will have another 187 tanneries along with 139 footwear units entailing an investment of ₹10,000 crore (US$1.4 billion) and generating employment for 2.5 lakh people.[33]
Kharagpur has also numerous industries of various types such as iron works, cement, chemicals, etc. The state's share of total industrial output in India was 9.8% in 1980–81, declining to 5% by 1997–98. However, the service sector has grown at a rate higher than the national rate.[25]


Jangal Sundari Karmanagari is an under construction industrial city complex and township in Jangalmahal, Purulia. Jangal Sundari Karmanagari has projected a potential investment of ₹72,000 crore (US$10 billion). ₹1,144 crore (US$160 million) has been used for creating basic infrastructures. The industrial city will generate employment for 1.5 lakh people. Major industries include cement, steel, auto component, engineering, MSME clusters, ceramics and electricals.
In Phase I of the project, 1749 acres were allocated and in Phase II, 734 acres were allocated.
Jangal Sundari Karmanagari has received investments from Rashmi Steel (800 acres), Shyam Steel (600 acres), Captain Steel (300 acres), Super Smelter, Maithan Alloys, Vikash Metal and Power Limited. As of March 2023, about 7 thousand people were employed in around 513 acres steel factory, which got an investment of ₹3,220 crore (US$450 million). Shyam Steel is constructing has acquired 600 acres and has started construction (as of March 2023) of a steel plant in 600 acres with an investment of ₹4,591 crore (US$640 million) and expected employment of 10,000 people. A cement factory is under construction in 70 acres with an investment of ₹400 crore (US$56 million).
Chittaranjan Locomotive Works, Titagarh Rail Systems, Texmaco Rail & Engineering and Jupiter Wagons are rolling stock manufacturers located in West Bengal. Titagarh Rail Systems is the second largest freight wagon manufacturer in India. Chittaranjan Locomotive Works is the largest locomotive manufacturer unit in the world, producing 431 locomotives in 2019–20.
The first production unit of Hindustan Cables was set up in 1952 in Rupnarayanpur, in technical collaboration with Standard Telephones and Cables Ltd. for production of paper insulated dry core cables. In 2007 updated and expanded Rupnarayanpur unit, with an installed capacity of 63 LCKM, manufactures polythene insulated jelly filled cables and aerial cables. Facilities for manufacturing 1 million pairs of telephone coiled cords and 1.5 million pieces of computer cords have been set up in the unit. The telephone cords (2 way ovular straight and 4 way ovular extensible etc.) conform to latest specification and cater to Indian market and the computer cords for Computer Industries.

The Steel Authority of India IISCO (Indian Iron and Steel Company Ltd) steel-making plant at Kulti was the first such facility in India. It became well known during the 1960s and 1970s, with its company shares being traded on the London Stock Exchange. However, a decade later the company became loss-making until it was revived in 2006 when it merged with the Steel Authority of India. Modernisation at IISCO Steel Plant has helped the city develop at a very rapid pace. The plant's capacity will be raised from 0.4 MT to 2.5 MT of saleable steel, using what will be the biggest blast furnace in the country. As of 2015, the investment for modernisation was the single largest investment in West Bengal till then.
The northern districts of Darjeeling, Kalimpong, Jalpaiguri, Alipurduar are famous for growing tea and they are exported world-wide for their supreme taste and quality. Many tea processing units are present here which contribute to the economy of the districts.
Semiconductor Fabrication Plant in Kolkata
Under a transformative collaboration with the United States, India will get its first-ever national security semiconductor fabrication plant that will produce chips for use in military hardware in both countries as well as in critical telecommunication networks and electronics. The ambitious India-U.S. joint project was announced following talks between PM Narendra Modi and U.S. President Joe Biden in Wilmington on September 21, 2024. The first-ever India-US semiconductor fabrication partnership was described as a "watershed arrangement", according to a joint fact sheet on Modi-Biden talks.[34]
The fab, which will be established with the objective of manufacturing infrared, gallium nitride and silicon carbide semiconductors, will be enabled by support from the India Semiconductor Mission as well as a strategic technology partnership between Bharat Semi, 3rdiTech, and the U.S. Space Force. It will not only become India's first, but one of the world's first multi-material fab for national security. This facility will produce advanced semiconductors for advanced sensing, communication and power electronics, marking the first tech partnership between Indian businesses and the U.S. Space Force, as well as the first of its kind within the Quad group.[35]
GlobalFoundries will set up GF Kolkata Power Center in Kolkata that will enhance mutually beneficial linkages in research and development in chip manufacturing and enable game-changing advances for zero and low emission as well as connected vehicles, internet of things devices, AI, and data centers. The semiconductor fabrication plant will be named "Durga Shakti".[36]
Industrial parks/areas/towns in West Bengal
| Name | Area | Location | Industrial Company/ companies | Industry |
|---|---|---|---|---|
| Panagarh Industrial Park | 1458 Acres | Panagarh, Burdwan District | Emami, Valve, Acer, Matix Fertilizers & Chemicals Ltd., H&R Johnson (India), HPCL, Globus Spirit Ltd., IOCL etc. | Cement, chemical fertilizers, Ammonia Plant, Urea Plant, bottling plant, Ceramic Tiles Manufacturing, distillery etc. |
| Vidyasagar Industrial Park | 1167 Acres | Kharagpur, West Medinipur | Tata-Hitachi, Indian Oil Corporation Limited, Orissa Aloy Steel private limited, Godrej Agrovet, Nutricraft India, Mahindra & Mahindra Limited, Megatherm Induction | Machinery, steel, oil |
| Barzora Industrial Park | 432 Acres | Barzora, Bankura District | Anandabazar Patrika, Pratyaha Newspaper, X Pro India, Timespac, Nilkamal Plastics, Surya Alloy Industries, Tulip Fabrics, Steelex Electrocast, HP Ispat, Jain Spun Industries, Maan Concast, Lalwani Industrie, Embee Ferro Alloy, Jai Ambey Metals, Royal Touch Fablon etc. | Steel, plastic, newspaper, fabric, metals etc. |
| Haldia Industrial Park (WBIDC) | 334 Acres | Haldia, East Medinipur | Mitsubishi Chemicals Ltd., South Asian Petrochemicals Ltd, Indian Oil Corporation Limited (IOCL), Exide, Shaw Wallace, Tata Chemicals, Haldia Petrochemicals, Hindustan Lever Limited etc. | Petrochemicals and fertilizers |
| Haldia Industrial Park (WBIIDC) | 120 Acres | Haldia, East Medinipur | Exide, Patanjali Ayurved, PetroCarbon & Chemical Pvt. Ltd., Ralson Petrochemicals Ltd. | Batteries and petrochemicals |
| Raghunathpur Steel & Allied Industrial Park | 1924 Acres | Raghunathpur, Purulia District | Damodar Valley Corporation, Shyam Steel Industries Limited, Shree Cement, DPSC limited | Thermal power, steel, cement |
| Shalbani Industrial Park | 4300 Acres | Salboni, West Medinipur | JSW Group | Cement, paint, steel, solar power unit, |
| Sankrail Rubber Park | 170 Acres | Sankrail, Howrah District | 100+ companies [37] | Rubber seeds, footwear, rubber hoses, tubes, micro cellular sheets, chappals, automotive rubber products etc. |
| Rishi Bankim Silpaudyan | 97 Acres | Naihati, North Twenty Four Parganas | Wimplast, Suguna Foods Limited, DTL Ancillary Limited, New Hope Animal Celesty Food Products, Syanchro Pack etc. | Plastics, food processing, etc. |
| Kharagpur cycle park | 20 Acres | Kharagpur, West Medinipur | Unirox, Milan, Luna and Krypton | Cycle production |
| Kharagpur Industrial Park | 257 Acres | Kharagpur, West Medinipur | Tata Iron & Steel Company Ltd., Flender Ltd., Century Extrusions Ltd., Japfa Comfed India Ltd. | Iron and steel, telecom, engineering and food processing |
| Goaltor Industrial Park | 950 Acres | Goaltor, West Medinipur | ||
| Nabadiganta Industrial Township | 430 Acres | Bidhannagar, North 24 Parganas | See list of companies having tech park here | IT, ITeS |
| Budge Budge Garment Park | 10 Acres | Budge Budge, South 24 Parganas | Garments and clothing | |
| Paridhan Garment Park | 8.78 Acres | Beliaghata, Kolkata | Rupa, Vedanta Fashions, Prapti Fashions, Enfield Apparels, Shipra Commercial, Jagadhatri Trexim, Moustache International, Senorita Creations, Citrus Fashions, Manish Creations, Modern Tradecom, The Rajlakshmi Cotton Mills | Garments and clothing |
| Shilpangan Light Engineering Park | 9.2 Acres | Bidhannagar, North 24 Parganas | Light engineering | |
| West Bengal Hosiery Park | 125 Acres | Howrah district | Garments and clothing | |
| Regent Garments and Apparel Park | 55 Acres | Barasat, North 24 Parganas | Garments and clothing | |
| EIGMEF Apparel Park | 13 Acres | Bidhannagar, North 24 Parganas | Garments and clothing | |
| Kona Integrated Garment Prak | 21 Acres | Unsani, Howrah district | Garments and clothing | |
| Sudha Das Food Park, Sankrail | 50 Acres | Sankrail, Howrah | Food and processing | |
| Kandua Food Park | 54 Acres | Sankrail, Howrah | Food and processing | |
| Sankrail Food Park | 34 Acres | Sankrail, Howrah | Amul (world's largest curd manufacturing plant) | Food and processing |
| Sankrail Poly Park | 60 Acres | Sankrail, Howrah | Megaflex Plastics, Elkos Pens, Weilburger Coatings, W.Hunger Hydraulics, Rollx Technologies, Tenty Marketing, Accurate Polymers, Techcon India | Polymer production |
| Gems & Jewelry Park | 6 Acres | Ankurhati, Howrah | Senco Gold Limited, Calcutta Gem & Jewellers Welfare Association, Jain Jewellers | Jewellery production |
| Haringhata Industrial Park | 358 Acres | Nadia | InstaKart Services Pvt. Ltd. | Warehouse, dairy and paper |
| Kharagpur General Industrial Park | 205 Acres | Kharagpur, West Medinipur | Tata Metaliks, Flender McNeil etc. | Metal works |
| Fulbari Industrial Park | 32 Acres | Fulbarigram, Jalpaiguri district | ||
| Dabgram Industrial Park | 107 Acres | Dabgram, Jalpaiguri district | Haldia Precision Engineering Pvt. Ltd., M.B. Tea & Allied Products (Pvt) Ltd., Super Treads Pvt. Ltd., Samrat Feed Mills Private Ltd. | Engineering, Cattle & Poultry Feed, Plastic & PVC objects, Food and Tea Processing |
| Shilpobroto Industrial Park | 25 Acres | Binnaguri, Jalpaiguri district | ||
| INDUS Balram Industrial Park | Jalpaiguri district | |||
| Raninagar Industrial Park | 152 Acres | Raninagar, Jalpaiguri district | Hindustan Coca-Cola Beverages Pvt. Ltd., Indian Oil Corporation Ltd., Terai Foods Pvt. Ltd., Sona Vets Pvt. Ltd., Amrit Feeds Ltd., JD Industries, Kusum Iron and Steel Ltd., AMD Industries Ltd., Kusum Enterprises | Beverages, Petroleum products, Agro/ Food processing, Plastic products, and Poultry feed |
| Cooch Behar Industrial Park | 98 Acres | Chakchaka, Cooch Behar district | Modern Agrotech Industries, Kamakshi Jute Industries, Sri Balaji Udyog, Hossain Electricals | Agro-based and jute industries, PVC and electrical industries |
| South City Anmol Infra Park | 48 Acres | Howrah district | ||
| Amtala Food Park | 125 Acres | Amtala, South 24 Parganas | Food processing units | |
| Regent SME Industrial Park | 21 Acres | Ankurhati, Howrah | ||
| Srijan Industrial Logistic Park | 24 Acres | Ankurhati, Howrah | ||
| Jalan Complex | 2000 Acres | Ankurhati, Howrah | Sharma Gandhi Hire Purchase Ltd., Honey Vanijya Pvt. Ltd., Neptune Hydrocarbons Mfg. Pvt. Ltd., Ugi Engineering Works Pvt. Ltd., R R Proteins & Agro Ltd., Maira Fabricators Pvt. Ltd., J.K. Spices & Food Products, Tridev Engineering Pvt. Ltd., Ganesh Grains Ltd. and many more | Mixed use |
| Amta Industrial Park | 1200 Acres | Amta, Howrah | ||
| Uluberia Industrial Park (WBIDC) | 129 Acres | Uluberia, Howrah | M & M Machine Craft Pvt. Ltd., ITC, Varun Tea Plantation Ltd., Flipkart | Mixed use |
| Uluberia Industrial Park (WBIIDC) | 160 Acres | Uluberia, Howrah | CERATIZIT India Pvt. Ltd., Saj Industries Pvt . Ltd., Sintex Industries Ltd., Goel Alloy & Steel Pvt. Ltd. | Iron & Steel Products, Food processing, Plastic & PVC molding units |
| Ranihati Foundry Park | 924 Acres | Sankrail, Howrah | Nif Ispat Ltd., RRL Steels Ltd., Bhajjanka Ispat Pvt. Ltd., Pacheria Castings Pvt. Ltd., Dinesh Brothers Pvt. Ltd., Yashi Castings | Iron & Steel Products |
| Dankuni Industrial Park | 777 Acres | Dankuni, Hooghly | ||
| Bagnan Industrial Park | 23 Acres | Bagnan, Howrah | ||
| Shaktigarh Industrial Park | 3.1 Acres | Saktigarh, Bardhaman | Electronic goods |
Infrastructure

Power and energy
As of end of August 2024, according to data released by Central Electricity Authority, the installed power capacity of the state is 15553.03 MW, compared to 450 GW of the country. Of the total installed power capacity, 13,567 MW was contributed by thermal power, 1,986.03 MW was contributed by hydro power and renewable power together.[38] West Bengal government's ministry of power, in its report, enumerates individual power generating stations in West Bengal along with their respective locations and generating capacities while mentioning the total installed capacity as 9,805 MW as of January 2021[update].[39] As of 2024, 100% of households were fully electrified.[40]

Communication and transportation
As of 2018[update], West Bengal has a total road length of 283,865 kilometres (176,386 mi), with a road density of 1.04 km per km2. Of this, national highways constitute 3,674 kilometres (2,283 mi) and state highways 3,612 kilometres (2,244 mi).[28] As of June 2015[update], the central government mulled augmenting the state's national highways' length by another couple of thousand kilometres in a bid to supplement to India's plan of seamless BBIN connectivity through Nepal, Bhutan, India, and Bangladesh, subject to availability of land, by investing in the tunes of US$4–5 billion.[41]

Railways
The Eastern Railway zone, South Eastern Railway zone and Northeast Frontier Railway zone of Indian Railways run operations in West Bengal. At the end of 2023–24, the route length in West Bengal was 4,203 km of which around 4,016 km has been converted to broad gauge and around 3,906 km has been electrified, the running track length was 7,122 km and the total track length was 10,466 km, with the number of stations exceeding 800.[42][43] Kolkata Metro railway is the newest zone of the IR with four operational lines of total length of about 60 km. As of 2024[update], various other metro links of approximately 74 km route length are underway in different phases of construction in Kolkata.
Ports
Kolkata is a major river-port in eastern India. The Kolkata Port Trust manages both the Kolkata docks and the Haldia docks.[44] There is passenger service to Port Blair on the Andaman and Nicobar Islands and cargo ship service to ports in India and abroad, operated by the Shipping Corporation of India. Kolkata Port handled 65.660 million tonnes (mt) of traffic in 2022–23, around 12.86% higher vis-a-vis that handled during previous fiscal. Kolkata Dock System, the first major dock formally commissioned in 1870, handled cargo traffic of 17.052 mt in 2022–23, registering a significant growth of 11.46% over the previous year. Haldia Dock Complex, the 1st green port of the country in 2015, handled 48.608 mt in 2022–23, recording growth of 11.8% over the last year. During 2022–23, 6,75,904 Container TEUs were handled at the Port vis-à-vis 7,35,195 TEUs during 2021–22. Total containerised tonnage handled at SMP, Kolkata was 10.59 million tonnes in 2022-23 vis-à-vis 11.8 million tonnes in 2021–22. Kolkata Dock System handled 5,68,722 TEUs in 2022-23 compared to 5,69,783 TEUs in 2021–22, recording a marginal decline. In 2019-20 Kolkata Dock System achieved the highest ever container throughput of 6,75,439 TEUs. Haldia Dock Complex handled 1,07,182 TEUs in 2022-23 vis-a-vis 1,65,412 TEUs in 2021–22.
Kolkata Port ranked 1st in terms of coking coal & other coal handling amongst major ports of India.

Inland waterways
The 560 km long Haldia-Farakka stretch in West Bengal is part of the stretch of Ganges between Haldia and Prayagraj declared as the National Waterway 1. Also a 91 km long stretch of the National Waterway 5 is within West Bengal. West Bengal government has sought to build infrastructure to begin sustained fuel efficient cost efficient and eco-friendly shipping operations for cargo transportation and tourism, passenger traffic as well along 12 rivers in West Bengal which can reduce congestion on roads. These rivers that has been identified for national waterways services, are the Prayagraj-Haldia stretch of the Ganga Bhagirathi Hooghly river, Ajay River (96 km), Mayurakshi River (110 km), Damodar River (135 km), DVC canal (130 km), Dwarakeswar River (113 km), Ichamati River (634 km), Jalangi River (131 km), Rupnarayan River (72 km), Subarnarekha River (314 km) and Sunderban Waterways (201 km).[45][46]
Telecommunications
As of end of June 2024, as per statistics published in press release of TRAI, there were 81.353 million wire-less (mobile phone) subscriptions (including 23.215 million with 89.47% VLR or active connections in Kolkata service area and 58.138 million with 97.61% VLR or active connections in rest of West Bengal service area) compared to over 1170.5 million wire-less connections in the whole country with VLR or active connections of 90.75% and 1.596 million wire-line subscriptions (including 1.04 million in Kolkata and 0.556 million in rest of West Bengal) in West Bengal (with a total state-level tele-density of 82.27% as of 30 June 2024[update]) compared to over 35.107 million wire-line connections in the whole country (with nationwide total tele-density of 85.95%) while as of April 2016 the number of broadband subscriptions in the state were arbitrarily estimated to be around 11 million compared to that of whole of India with over 151.09 million broadband connections.[47] VSNL has its international gateway and earth station in Kolkata. International connectivity is provided through VSNL and five STPI (Software Technology Parks of India) earth stations in Kolkata, Durgapur, Kharagpur, Haldia and siliguri. Digha has been selected as the cable landing station for the submarine cable laying project connecting India and South East Asia. BSNL has an optical fiber network of 15000 km route in West Bengal. Reliance group's Jio Infocomm has laid 4500 km of optical fiber network in the state for its 4G network.[48] Under National Optic Fibre Network (NOFN) mission, optical fibre cable will be laid in 341 blocks covering most of the gram panchayats in West Bengal. [49]
.jpg)
Aviation
Spread over 2640 acres at Dum Dum in Kolkata, the largest in eastern India, the newly modernised Netaji Subhas Chandra Bose International Airport is the sixth busiest international airport in India in respect of aircraft movement (after Delhi, Mumbai, Bangalore, Hyderabad and Chennai). It has two asphalt runways, the primary one extended by 700 meters (3627 × 46m) and upgraded to CATIIIB, and the secondary one (3190 × 46m) upgraded to CATII ILS standards. Its terminal is a new and sprawling L-shaped six-level integrated terminal of over 2,510,000 sq ft inaugurated in 2013, able to handle 25 million passengers per annum. It includes check-in counters that use CUTE (Common User Terminal Equipment) technology, 78 immigration counters, 12 customs counters, passenger lounges provided by Air India and Jet Airways, 18 aerobridges, 57 remote parking bays, 2 underground two-leveled carparks and car parking facilities in landscaped area capable of handling 5000 cars. The airport has a Centre for Perishable Commodities (CPC), two luxury hotels and a shopping mall.

In the fiscal year April 2023 to March 2024, the airport handled 1,40,879 aircraft movements including 20,078 international aircraft movements, 19.784 million passengers (including 2.4 million international passengers and 17.31 million domestic passengers), 1,51,626 metric tonnes of freight. Between the 1940s and 1960s, major airlines such as Aeroflot, Air France, Alitalia, Cathay Pacific, Japan Airlines, Philippine Airlines, KLM, Pan Am, Lufthansa, Swissair and SAS operated from the airport. With the advent of longer haul aircraft and the socio-economio-political degeneration of the state during the 1960s, several airlines gradually discontinued operations there. The withdrawal of Lufthansa's service to Frankfurt in 2012 left Kolkata with no direct flights beyond Asia. Kolkata airport is to undergo the execution of Phase 2 of the expansion plan which primarily involves the construction of an 86-meter ATC Tower. Additionally, the current Kolkata Metro expansion plans include two new lines to the airport for better connectivity.

Bagdogra International Airport, Siliguri is another significant airport in the state. It serves as the gateway to North-east India and countries like Bhutan, Nepal and Bangladesh. In the fiscal year April 2023 to March 2024, the airport handled 20,838 aircraft movements including 434 international aircraft movements, 3.12 million passengers (including 21,137 international passengers and 3.09 million domestic passengers), 8,445 metric tonnes of freight.
Kazi Nazrul Islam Airport, Durgapur country's first private greenfield aerotropolis project spread over 650 acres, under Bengal Aerotropolis Projects Limited (BAPL) co-owned by Singapore-based Changi group, conceived in 2006–07 to be a domestic/international airport with handling capacity of 1 million per annum that can be expanded to 2.5 million per annum in future, officially commenced operations in 2015 at Andal, Durgapur 185 km away from the state capital Kolkata.[50] Currently it has direct flight connections to major cities like Bangalore, Bhubaneswar, Chennai, Delhi, Guwahati, Hyderabad, Mumbai and Siliguri. In the fiscal year April 2023 to March 2024, the airport handled 3,234 aircraft movements, 0.51 million passengers, 491 metric tonnes of freight.

Cooch Behar Airport is a domestic airport serving the city of Cooch Behar and parts of North Bengal and Assam. It is located 6.2 km (3.9 mi) from the city centre. The airport is spread over an area of 173 acres. The airport is located at an elevation of 141 feet (43 m) above mean sea level. It has one runway designated 04/22 with an asphalt surface, measuring 3,507 by 100 feet (1,069 by 30 m) without an instrument landing system. The airport can handle only flights using visual flight rules during the day. Improvements in radar as well as other runway systems have been completed, such as installation of lights on the runway, while the instrument landing system will be installed in the near future. There is presently a high security team residing in the airport which uses a non-directional beacon for navigation services. Commercial services resumed from Cooch Behar with IndiaOne Air starting flights to Kolkata on 21 February 2023. In the fiscal year April 2023 to March 2024, the airport handled 568 aircraft movements, and 4,384 passengers.

.jpg)
Industry
As of 2011[update], the state has 22 formally approved special economic zones (SEZ).[51] Of these, 17 are related to information technology (IT) or IT, enabled services (ITES).[28]:28
Economic indices

As per the state budget presented in the state legislative assembly on 12 February 2025, West Bengal's nominal GSDP at current prices has risen to ₹20.3 lakh crore (US$280 billion) in the year 2025–26, the average INR to US$ exchange rate in that year being INR 88. West Bengal's per capita nominal GSDP at current prices for the economic year 2023-24 is ₹171,184 (US$2,400). In the year 2024–25, it is expected to grow to ₹188,467 (US$2,600).
In terms of nominal net state domestic product (NSDP) at factor cost at current prices (base year 2011–2012), West Bengal was the sixth largest economy in India, with an NSDP of ₹18.8 lakh crore (US$260 billion) in 2024-25 and in terms of nominal gross state domestic product (GSDP) at current prices, the state had GSDP of ₹13.97 lakh crore (US$200 billion) in the economic year 2022–23 as mentioned by Reserve Bank of India. In 2023–24, the tertiary sector of the economy (service industries) was the largest contributor to the gross domestic product of the state, contributing 54.13% of the state domestic product compared to 18% from primary sector (agriculture, forestry, mining) and 27.87% from secondary sector (industrial and manufacturing).[28]:12 At a compound annual growth rate of 15.2%, the tertiary sector has been the fastest growing among the three sectors from 2004–05 to 2009–10.[28]:12 The growth has been driven by trade, hotels, real estate, finance, insurance, transport, communications and other services.
The state's total financial debt that stood at ₹1,918 billion (US$27 billion) as of 2011[update] swelled to ₹3,050 billion (US$43 billion) at the end of 2015-16 and is estimated to further grow to ₹6,932 billion (US$97 billion) at the end of 2024–25, although as a percentage of GSDP it is expected to decrease to about 36.88%.[52][53][54]
| Year | GSDP (in current prices) | Growth Rate |
|---|---|---|
| 1980-81 | ₹10,345 crore (US$1.5 billion) | |
| 1981-82 | ₹11,575 crore (US$1.6 billion) | 11.89%
|
| 1982-83 | ₹13,049 crore (US$1.8 billion) | 12.73%
|
| 1983-84 | ₹15,302 crore (US$2.1 billion) | 17.27%
|
| 1984-85 | ₹17,676 crore (US$2.5 billion) | 15.51%
|
| 1985-86 | ₹19,032 crore (US$2.7 billion) | 7.67%
|
| 1986-87 | ₹20,803 crore (US$2.9 billion) | 9.31%
|
| 1987-88 | ₹25,077 crore (US$3.5 billion) | 20.55%
|
| 1988-89 | ₹27,106 crore (US$3.8 billion) | 8.09%
|
| 1989-90 | ₹30,623 crore (US$4.3 billion) | 12.97%
|
| 1990-91 | ₹34,797 crore (US$4.9 billion) | 13.63%
|
| 1991-92 | ₹40,380 crore (US$5.7 billion) | 16.04%
|
| 1992-93 | ₹43,290 crore (US$6.1 billion) | 7.21%
|
| 1993-94 | ₹53,424 crore (US$7.5 billion) | 23.41%
|
| 1994-95 | ₹62,031 crore (US$8.7 billion) | 16.11%
|
| 1995-96 | ₹73,864 crore (US$10 billion) | 19.08%
|
| 1996-97 | ₹82,075 crore (US$12 billion) | 11.12%
|
| 1997-98 | ₹97,966 crore (US$14 billion) | 19.36%
|
| 1998-99 | ₹115,516 crore (US$16 billion) | 17.91%
|
| 1999-00 | ₹135,376 crore (US$19 billion) | 17.19%
|
| 2000-01 | ₹143,724 crore (US$20 billion) | 6.17%
|
| 2001-02 | ₹157,144 crore (US$22 billion) | 9.34%
|
| 2002-03 | ₹168,000 crore (US$24 billion) | 6.91%
|
| 2003-04 | ₹189,258 crore (US$27 billion) | 12.65%
|
| 2004-05 | ₹208,656 crore (US$29 billion) | 10.25%
|
| 2005-06 | ₹230,254 crore (US$32 billion) | 10.35%
|
| 2006-07 | ₹261,681 crore (US$37 billion) | 13.65%
|
| 2007-08 | ₹299,482 crore (US$42 billion) | 14.45%
|
| 2008-09 | ₹341,942 crore (US$48 billion) | 14.18%
|
| 2009-10 | ₹398,880 crore (US$56 billion) | 16.65%
|
| 2010-11 | ₹460,959 crore (US$65 billion) | 15.56%
|
| 2011-12 | ₹520,485 crore (US$73 billion) | 11.43%
|
| 2012-13 | ₹591,464 crore (US$83 billion) | 13.63%
|
| 2013-14 | ₹676,848 crore (US$95 billion) | 14.43%
|
| 2014-15 | ₹718,081 crore (US$100 billion) | 6.09%
|
| 2015-16 | ₹797,299 crore (US$110 billion) | 11.03%
|
| 2016-17 | ₹872,527 crore (US$120 billion) | 9.43%
|
| 2017-18 | ₹974,700 crore (US$140 billion) | 11.71%
|
| 2018-19 | ₹1,102,053 crore (US$150 billion) | 13.06%
|
| 2019-20 | ₹1,179,097 crore (US$170 billion) | 7%
|
| 2020-21 | ₹1,155,820 crore (US$160 billion) | -1.97%
|
| 2021-22 | ₹1,363,925 crore (US$190 billion) | 17%
|
| 2022-23 | ₹1,515,564 crore (US$210 billion) | 13%
|
| 2023-24 | ₹1,651,374 crore (US$230 billion) | 11%
|
| 2024-25 | ₹1,812,372 crore (US$250 billion) | 10%
|
| 2025-26 (RE) | ₹1,990,896 crore (US$280 billion) | 10%
|
| 2026-27(BE) | ₹2,178,244 crore (US$310 billion) | 9%
|
Per capita income
In the year 2022–23, the per capita income of West Bengal was calculated to be ₹141,373 (US$2,000) at current prices. It is expected to grow to about ₹203,095 (US$2,800) in the year 2025–26 by extrapolating the values according to GSDP growth rate. The latest district-wise values of per capita income available was of 2013–14.[56] They are shown as below and their values extrapolated to 2022-23 and 2024-25 values respectively.
| District | Per capita income (2013–14) | Per capita income (2022–23) | Per capita income (2024–25) |
|---|---|---|---|
| Bankura | ₹ 57,879 | ₹ 1,16,796 | ₹ 1,55,703 |
| Birbhum | ₹ 53,122 | ₹ 1,07,197 | ₹ 1,42,906 |
| Coochbehar | ₹ 54,069 | ₹ 1,09,108 | ₹ 1,45,454 |
| Dakshin Dinajpur | ₹ 50,991 | ₹ 1,02,897 | ₹ 1,37,174 |
| Darjeeling | ₹ 87,695 | ₹ 1,76,961 | ₹ 2,35,910 |
| Howrah | ₹ 70,350 | ₹ 1,41,961 | ₹ 1,89,251 |
| Hooghly | ₹ 70,102 | ₹ 1,41,461 | ₹ 1,88,585 |
| Jalpaiguri | ₹ 59,652 | ₹ 1,20,373 | ₹ 1,60,471 |
| Kolkata | ₹ 1,12,737 | ₹ 2,27,494 | ₹ 3,55,470 |
| Malda | ₹ 50,942 | ₹ 1,02,797 | ₹ 1,37,041 |
| Murshidabad | ₹ 50,186 | ₹ 1,01,271 | ₹ 1,35,006 |
| Nadia | ₹ 58,870 | ₹ 1,18,795 | ₹ 1,58,367 |
| North 24 Parganas | ₹ 66,384 | ₹ 1,33,958 | ₹ 1,78,583 |
| Paschim Bardhaman | ₹ 81,607 | ₹ 1,64,676 | ₹ 2,19,533 |
| Purba Bardhaman | |||
| Paschim Medinipur | ₹ 57,952 | ₹ 1,16,942 | ₹ 1,55,898 |
| Purba Medinipur | ₹ 87,082 | ₹ 1,75,725 | ₹ 2,34,262 |
| Purulia | ₹ 50,074 | ₹ 1,01,046 | ₹ 1,34,707 |
| South 24 Parganas | ₹ 56,983 | ₹ 1,14,988 | ₹ 1,53,292 |
| Uttar Dinajpur | ₹ 39,720 | ₹ 80,152 | ₹ 1,06,852 |
| West Bengal | ₹ 70,059 | ₹ 1,41,373 | ₹ 1,88,467 |
Multidimensional poverty
According to a report released by NITI Aayog in 2023 on Multidimensional Poverty Index, West Bengal had a poverty rate of 11.89% as compared to 14.96% at national level in the years 2019–21.[57] It further decreased to 8.60% in 2022-23 (projected) as compared to 11.28% at national level. Several socialist schemes have helped to reduce poverty and maintain equality of income in the state. The district-wise values of multidimensional poverty is as follows-
Foreign direct investment
Under the overall guidance and policies of the government of India, the West Bengal government welcomes foreign technology and investments as may be appropriate for the needs of the state and is mutually advantageous.[58] Foreign direct investment has mostly come in the manufacturing and telecommunication sectors.[59] According to the Department for Promotion of Industry and Internal Trade, Government of India, West Bengal attracted a cumulative FDI investment of ₹13,346.32 crores (US$1,723 million) from October 2019 to September 2024.[60]
Exports
West Bengal is one of the country's leading exporters of finished leather goods. In 2023–24, the state accounted for around 6% of the country's exports of leather and leather products. The state accounted for around 70% of India's dried flower exports in 2008–09. The state is also a leading exporter of shrimps and tea.
However, the rapid industrialisation process has given rise to debate over land acquisition for industry in this agrarian state.[61] NASSCOM–Gartner ranks West Bengal power infrastructure the best in the country.[62]
| Commodity group | Total Exports
Apr'23 - Mar'24 ($ million) |
% share of total exports | Total Exports
Apr'24 - Dec'24 ($ million) |
% share of total exports |
|---|---|---|---|---|
| Engineering Goods | 3,134.81 | 26.83% | 2,292.48 | 28.29% |
| Gems and Jewellery | 1,485.27 | 12.71% | 1,277.46 | 13.94% |
| Leather and Leather Manufactures | 696.33 | 5.96% | 530.03 | 5.78% |
| Organic and Inorganic Chemicals | 577.6 | 4.94% | 512.04 | 5.59% |
| Petroleum Products | 560.61 | 4.80% | 469.57 | 5.12% |
| Marine Products | 513.12 | 4.39% | 434.35 | 4.74% |
| Electronic Goods | 470.84 | 4.03% | 263.58 | 2.88% |
| Rice | 432.59 | 3.70% | 433.56 | 4.73% |
| Plastic and Linoleum | 357.05 | 3.06% | 248.25 | 2.71% |
| Ready-made garments of all textiles | 321.05 | 2.75% | 227.58 | 2.48% |
| Cereal preparations and misc. processed items | 262.78 | 2.25% | 134.28 | 1.47% |
| Jute Manufacturing including floor covering | 229.45 | 1.96% | 194.90 | 2.13% |
| Tea | 198.99 | 1.70% | 177.67 | 1.94% |
| Cotton Yarn/Fabrics/Madeups, Handloom products, etc. | 174.02 | 1.49% | 144.21 | 1.57% |
| Iron Ore | 166.83 | 1.43% | 2.51 | 0.03% |
| Mica, coal and other ores, minerals including process | 154.56 | 1.32% | 110.45 | 1.21% |
| Man-Made yarn/fabrics/madeups etc. | 121.69 | 1.04% | 65.36 | 0.71% |
| Total | 11,684.64 | 2.67% | 9,164.00 | 3.20% |
The district-wise export data is also available from the Ministry of Commerce and Industry dashboard.[64]
| District | Total Exports (Apr'23 - Mar'24) |
|---|---|
| Alipurduar | ₹1,420.36 crore (US$200 million) |
| Bankura | ₹754.24 crore (US$110 million) |
| Birbhum | ₹959.89 crore (US$130 million) |
| Coochbehar | ₹154.08 crore (US$22 million) |
| Dakshin Dinajpur | ₹259.02 crore (US$36 million) |
| Darjeeling | ₹1,238.11 crore (US$170 million) |
| Howrah | ₹11,108.81 crore (US$1.6 billion) |
| Hooghly | ₹4,089.29 crore (US$570 million) |
| Jalpaiguri | ₹2,888.71 crore (US$400 million) |
| Jhargram | ₹123.36 crore (US$17 million) |
| Kalimpong | ₹7.70 crore (US$1.1 million) |
| Kolkata | ₹38,917.16 crore (US$5.5 billion) |
| Malda | ₹730.93 crore (US$100 million) |
| Murshidabad | ₹1,023.83 crore (US$140 million) |
| Nadia | ₹267.94 crore (US$38 million) |
| North 24 Parganas | ₹4,178.81 crore (US$590 million) |
| Paschim Bardhaman | ₹7,104.05 crore (US$1.0 billion) |
| Purba Bardhaman | ₹3,229.17 crore (US$450 million) |
| Paschim Medinipur | ₹2,708.51 crore (US$380 million) |
| Purba Medinipur | ₹10,313.39 crore (US$1.4 billion) |
| Purulia | ₹965.41 crore (US$140 million) |
| South 24 Parganas | ₹3,068.24 crore (US$430 million) |
| Uttar Dinajpur | ₹1,227.92 crore (US$170 million) |
| West Bengal | ₹102,556 crore (US$14 billion) |
Sustainable Development Goals
NITI Aayog releases Sustainable Development Goals reports at regular intervals. The first report was released in 2018 where West Bengal had a composite score of 56 as compared to 57 of India.[65] The next report was released in 2019-20 where West Bengal had a composite score of 60 which was the same at the national level.[66] In the third edition of the report released in 2020–21, West Bengal scored 62 while the national average rose to 66.[67] In the latest edition of the report during 2023-24 released on 12 July 2024, West Bengal saw a massive improvement of composite score to 70 putting it in the front-runner category while the national average rose to 71.[68] The goal-wise scores of West Bengal over the years is given below:
| No. | SDG Goals | 2018 | 2019-20 | 2020-21 | 2023-24 |
|---|---|---|---|---|---|
| 1 | No Poverty | 57 | 52
|
59
|
63
|
| 2 | Zero Hunger | 50 | 40
|
46
|
56
|
| 3 | Good Health and Well-being | 66 | 70
|
76
|
79
|
| 4 | Quality Education | 51 | 50
|
54
|
60
|
| 5 | Gender Equality | 40 | 38
|
41
|
45
|
| 6 | Clean Water and Sanitation | 54 | 83
|
81
|
86
|
| 7 | Affordable and Clean Energy | 40 | 58
|
98
|
100
|
| 8 | Decent Work and Economic Growth | 63 | 72
|
57
|
63
|
| 9 | Industry, Innovation and Infrastructure | 45 | 68
|
53
|
66
|
| 10 | Reduced Inequality | 76 | 73
|
71
|
70
|
| 11 | Sustainable Cities and Communities | 25 | 34
|
45
|
54
|
| 12 | Responsible Consumption and Production | - | 57 | 79
|
94
|
| 13 | Climate Action | - | 37 | 39
|
44
|
| 14 | Life Below Water | - | 43 | 50
|
100
|
| 15 | Life on Land | 88 | 88
|
53
|
91
|
| 16 | Peace, Justice and Strong Institutions | 72 | 73
|
81
|
82
|
| Composite | 56 | 60
|
62
|
70
|
Further reading
- Bahl, R., Sethi, G., & Wallace, S. (2009). West Bengal: Fiscal Decentralization to Rural Governments: Analysis and Reform Options (No. paper0907). International Center for Public Policy, Andrew Young School of Policy Studies, Georgia State University.
References
- ↑ "World Economic and Financial Surveys World Economic Outlook Database—WEO Groups and Aggregates Information April 2020". IMF.org. International Monetary Fund. Retrieved 2 September 2020.
- ↑ "World Bank Country and Lending Groups". World Bank. Retrieved 29 September 2019.
- ↑ "MoHFW Projections" (PDF). Retrieved 16 June 2024.
- ↑ "West Bengal Budget Analysis 2025-26". Retrieved 15 March 2025.
- ↑ https://finance.wb.gov.in/writereaddata/Fiscal_Policy/FRBM26_Part1.pdf.
{{cite web}}: Missing or empty|title=(help) - ↑ "West Bengal Budget Analysis 2025-26". PRS Legislative Research. 15 March 2025. Retrieved 15 March 2025.
- ↑ "GSVA/NSVA by Economic Activities". MoSPI. Delhi. 16 August 2024. Retrieved 16 August 2024.
- ↑ 8.0 8.1 8.2 8.3 8.4 Department of Finance (2026). Budget Speech 2026-2027 (English) (PDF) (Report). Government of West Bengal. Retrieved 19 February 2026.
- ↑ "Statewise Inflation Rates (%) for August 2024 (based on CPI)". MoSPI. August 2024.
- ↑ "Multidimensional Poverty in India Since 2005-06" (PDF). Niti Aayog. 1 January 2024.
- ↑ "NITI Aayog SDG Report" (PDF). NITI Aayog.
- ↑ "Human Development". Retrieved 9 November 2025.
- ↑ "Employment Indicators in India 2021-22" (PDF). Directorate of Employment. Retrieved 11 June 2024.
- ↑ Gangopadhyay, Sarthak (17 January 2026). "Bengal IT sector poised for major expansion with Rs 30,000cr investment lined up". The Times of India. Retrieved 15 February 2026.
- ↑ "Import-Export Dashboard". Ministry of Commerce.
- ↑ "West Bengal's IT exports surge to ₹35,000 crores". Ainvest. 18 July 2025.
- ↑ "Titagarh Rail Systems expects rapid growth in passenger rail business". The Times of India. 19 June 2025.
- ↑ "Garden Reach Shipbuilders & Engineers—Recent Export Orders". Garden Reach Shipbuilders & Engineers. Retrieved 6 September 2025.
- ↑ "West Bengal exports significantly to Asian markets, with ASEAN countries accounting for about 39% of the state's total exports". India Brand Equity Foundation (IBEF). Retrieved 8 March 2026.
- ↑ "Bangladesh remains West Bengal's second largest export partner". India Seatrade News. 24 November 2023. Retrieved 22 March 2026.
- ↑ "West Bengal's exports to the European Union have crossed ₹20,000 crore, driven largely by growth in software, agricultural and leather exports". West Bengal Industrial Development Corporation (Government of West Bengal). Retrieved 8 March 2026.
- ↑ "Trump's 50% tariff hits Bengal: Rs 18,000 crore exports at stake; engineering, shrimps and leather to be worst-hit". The Times of India. Retrieved 8 March 2026.
- ↑ "West Bengal exports to the United Arab Emirates stood at around US$1.49 billion in 2022–23". The Telegraph. Retrieved 8 March 2026.
- ↑ "FDI Factsheet" (PDF). DPIIT.
- ↑ 25.0 25.1 West Bengal Human Development Report 2004. Development and Planning Department, Government of West Bengal. May 2004. ISBN 81-7955-030-3. Retrieved 11 July 2021.
- ↑ "Department of Agriculture and Farmer's Welfare" (PDF).
- ↑ "Department of Fisheries" (PDF). Retrieved 26 May 2024.
- ↑ 28.0 28.1 28.2 28.3 28.4 "Ministry of Roads" (PDF). Retrieved 24 May 2024.
- ↑ 2019 agricultural output of West Bengal based on the 2011 prices
- ↑ "Basic Animal Husbandry Statistics 2024" (PDF). 27 November 2024. p. 116.
- ↑ "Industrial infrastructure". West Bengal Industrial Development Corporation. Archived from the original on 5 April 2012. Retrieved 5 March 2012.
- ↑ Economy of West Bengal @ webindia123.com Suni System (P) Ltd.
- ↑ "Leather complex at Bantala: State expects Rs 10K cr investment, 2.5L jobs". Millenium Post. 19 July 2024.
- ↑ "Joint Fact Sheet: The United States and India Continue to Expand Comprehensive and Global Strategic Partnership". U.S. Embassy & Consulates in India. 23 September 2024. Retrieved 24 September 2024.
- ↑ MyGovIndia, X (24 September 2024). "India & US Team up for Semiconductor Breakthrough". MyGovIndia. Retrieved 24 September 2024.
- ↑ "India to get first national security semiconductor fabrication plant as part of collaboration with U.S." The Hindu. 23 September 2024. Retrieved 23 September 2024.
- ↑ "SARPOL Plot Holders". South Asia Rubber & Polymers Park Ltd.
- ↑ "Eastern Zone installed power capacity (in MW)" (PDF). National Power Portal. Retrieved 24 September 2024.
- ↑ "Details of various generating stations in West Bengal (as of 01.1.2021)". Power Ministry, Government of West Bengal. Retrieved 24 May 2024.
- ↑ "Progress report on village electrification as on 10.10.2017" (PDF). Deen Dayal Upadhyay Gram Jyoti Yojana. Retrieved 24 May 2024.
- ↑ "Centre plans to give Rs. 25000-30000 crore for development of Bengal roads:Nitin Gadkari". 24 June 2015. Retrieved 8 June 2016.
- ↑ "The network" (PDF). Indian Railways. Retrieved 30 August 2016.
- ↑ "Physical Infrastructure". WBIDC. Archived from the original on 11 January 2012. Retrieved 30 August 2016.
- ↑ "Port info: cargo statistics". Kolkata Port Trust. Kolkata Port Trust, India. Retrieved 9 February 2012.
- ↑ "WB government proposes to introduce inland waterways services". The Times of India. 27 August 2015. Retrieved 30 August 2016.
- ↑ "12 rivers in Bengal listed for development". The Statesman. Retrieved 30 August 2016.
- ↑ "Highlights of Telecom Subscription Data as on 30th June, 2024" (PDF). Telecom Regulatory Authority of India. 20 August 2024. Retrieved 14 September 2024.
- ↑ "Reliance Jio to launch 4G in West Bengal by March 2014". The Times of India. 22 May 2013. Retrieved 30 August 2016.
- ↑ "Push for digital drive in Bengal, optical fibre network in 300 blocks soon". The Times of India. 18 October 2015. Retrieved 30 August 2016.
- ↑ "Narendra Modi first passenger to use Andal airport". The Economic Times. 11 May 2015. Archived from the original on 5 January 2016. Retrieved 28 June 2016.
- ↑ "SEZs: statewise distribution" (PDF). Sezindia, Ministry of Commerce and Industry, Government of India. Retrieved 9 February 2012.
- ↑ "Bengal's debt pile balloons". The Telegraph. New Delhi. 22 March 2019. Retrieved 4 March 2019.
- ↑ "After huge win, Mamata to start new term under mountain of debt". The Hindustan Times. Retrieved 22 June 2016.
- ↑ "WB Finance" (PDF). 8 February 2024.
- ↑ "RBI Handbook of Statistics on Indian States". m.rbi.org.in. Retrieved 24 May 2024.
- ↑ "WBPSPM" (PDF).
- ↑ "National Multidimensional Poverty Index" (PDF). 17 July 2023.
- ↑ "Policies and approval: foreign direct investment (FDI) policy". West Bengal Industrial Development Corporation. Archived from the original on 5 April 2012. Retrieved 5 March 2012.
- ↑ Mazumdar, Rakhi (10 January 2012). "PwC sees need for FDI in West Bengal". The Economic Times. New Delhi. Archived from the original on 5 May 2013. Retrieved 5 March 2012.
- ↑ "FDI Factsheet" (PDF). Department for Promotion of Industry and Internal Trade. 20 September 2024.
- ↑ Ray Choudhury, R (27 October 2006). "A new dawn beckons West Bengal". The Hindu Business Line. Retrieved 29 October 2006.
- ↑ "West Bengal Industrial Development Corporation Ltd" (PDF). India @ Hannover Messe 2006. Engineering Export Promotion Council (EEPC), India. p. 303. Archived from the original (PDF) on 21 September 2006. Retrieved 7 September 2006.
- ↑ "NIRYAT Portal".
- ↑ "Export Dashboard". Ministry of Commerce and Industry.
- ↑ "NITI Aayog SDG Report 2018" (PDF). 2018. Retrieved 10 August 2024.
- ↑ "NITI Aayog SDG Report 2019-20" (PDF). 2019.
- ↑ "NITI Aayog SDG Report 2020-21" (PDF). Archived from the original (PDF) on 2 August 2022.
- ↑ "NITI Aayog SDG Report 2023-24" (PDF). 12 July 2024.


.png)