

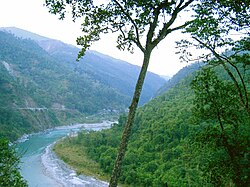


West Bengal has a varied climate, with tropical savannahs in the southern portions of the state, to humid subtropical areas in the north. Temperatures vary widely, and there are five distinct seasons. The area is vulnerable to heavy rainfall, monsoons, and cyclones. There are some mountains in the area which are generally cold all year round.

Seasons[edit | edit source]
There are six main seasons in West Bengal: summer (Grishma), monsoons or rainy season (Barsha), autumn (Sharat), late autumn/pre winter (Hemanta), winter (Sheet), spring (Bawshonto) .
Spring[edit | edit source]
Spring is considered the most pleasant season over the plains of West Bengal and lies from mid-February to mid-March and is also the time where Holi is celebrated. Temperatures range between 20 °C – 30 °C and no rainfall. Though occasional rain or light showers are witnessed due to Western disturbances in North India.
Summer[edit | edit source]
The summer season is observed from March to May in most of Bengal.
Temperature[edit | edit source]
In Bengal, summers can be extremely hot and have high humidity. The plains of South Bengal have a daily maximum temperature around 35–38 °C.[1][2] It can also exceed 40 °C.[3][4][5][6][7] The western highlands experience a dry summer like northern India. During the day, the temperature ranges from 38 to 42 °C, though it can reach or exceed 45 °C.[8][9][10][11][12] In summer, the plains of North Bengal are generally cooler than the west and south.[13][14][15] In this area, the daily maximum temperature varies from 26 °C to 32 °C.[16] It occasionally crosses 35 °C. The minimum temperature in summer is approximately 18–22 °C. The Darjeeling hill region is the coolest area in summer. Here, the daily highest temperature is 15–25 °C.
Rainfall[edit | edit source]
| City | Average temperature (°C) | Average Rainfall (mm) |
|---|---|---|
| Darjeeling | 13.1 | 446 |
| Siliguri | 24.2 | 447 |
| Jalpaiguri | 24.0 | 453 |
| Malda | 28.3 | 188 |
| Shantiniketan | 29.4 | 264 |
| Behrampore | 29.3 | 136 |
| Krishnagar | 29.5 | 96 |
| Asansol | 30.0 | 114 |
| Bankura | 29.9 | 146 |
| Kolkata | 29.8 | 227 |
| Digha | 28.4 | 214 |
| West Bengal | 26.9 | 248.3 |
Monsoons[edit | edit source]
Period[edit | edit source]
In mid-June or early July, the monsoon season starts.
Temperature[edit | edit source]
In most places, the temperature drops as cloud cover increases. This is less true for the mountains and the Terai Dooars plains, where temperature gradually increases until August.
The maximum temperature of South Bengal's plains and western highlands is 32 °C,[18] 31 °C in North Bengal plains and around 19–20 °C in mountains. Sometimes when the sky gets clear, the temperature rises suddenly. This is known as a monsoon break. This occurs mostly in North Bengal plains and in mountains in July and August when the temperature soars over 36 °C and 24 °C respectively.[19][20][21][22][23]
Rainfall[edit | edit source]
Most of the annual rainfall occurs during the monsoon period. Heavy rainfall above 250 cm is observed in the Darjeeling, Jalpaiguri, Alipurduar and Cooch Behar district.[24][25][26][27][28] Later, blowing westwards, the winds cause average rainfall of 125 cm in the northern plains and western plateau region.
| City | Average temperature (°C) | Average Rainfall (mm) |
|---|---|---|
| Darjeeling | 16.4 | 2796 |
| Siliguri | 28.1 | 2651 |
| Jalpaiguri | 28.0 | 2674 |
| Malda | 29.6 | 1207 |
| Shantiniketan | 29.4 | 1510 |
| Behrampore | 30.2 | 1036 |
| Krishnagar | 29.4 | 1348 |
| Asansol | 29.5 | 1140 |
| Bankura | 30.3 | 1227 |
| Kolkata | 29.6 | 1358 |
| Digha | 29.1 | 1192 |
| West Bengal | 28.1 | 1649.0 |
Autumn[edit | edit source]
Period[edit | edit source]
Autumn lasts for two months, October and November.
Temperature[edit | edit source]
In autumn, the southwest monsoon wind returns and clears the sky. So, the state gets enough sunshine to be warm in the day and releases a lot of heat to be cool at night.
At this time, a maximum temperature of 30–33 °C is felt over the plains and 17–19 °C in mountains. The minimum temperature is normally around 19–22 °C in plains and 6–11 °C in mountains.[29] Sometimes, cold waves blow over the state in autumn.[30][31][32]
Rainfall[edit | edit source]
In autumn, the southwest monsoon wind returns, and the northeast monsoon wind enters West Bengal. Due to their collision in Bay of Bengal, some cyclones are created.[33][34] The cyclones cause some rainfall in the state.
| City | Average temperature (°C) | Average Rainfall (mm) |
|---|---|---|
| Darjeeling | 13.4 | 74 |
| Siliguri | 23.2 | 181 |
| Jalpaiguri | 23.6 | 169 |
| Malda | 26.2 | 132 |
| Shantiniketan | 25.3 | 212 |
| Behrampore | 26.2 | 146 |
| Krishnagar | 26.5 | 175 |
| Asansol | 24.8 | 125 |
| Bankura | 25.9 | 94 |
| Kolkata | 26.6 | 216 |
| Digha | 25.9 | 240 |
| West Bengal | 24.3 | 160.4 |
Winter[edit | edit source]
Period[edit | edit source]
The winter season usually starts in December and ends in February.[35]
Temperature[edit | edit source]
In winter, a mild temperature is observed over the plains. The maximum temperature goes to 23–26 °C and the minimum temperature is 9–15 °C in plains of the state. The maximum and minimum temperature in the mountains range from 0–12 °C. Higher regions of the Darjeeling Himalayas get heavy snowfall during winter.[36][37][38]
The temperatures of the western highlands at night can drop 7–9 °C,[39][40][41] 4–7 °C in Siliguri, Jalpaiguri, Coochbehar plains[42][43][44][45] and 10–11 °C in Kolkata[46][47][48][49] when cold waves blow. Darjeeling's temperature can drop below freezing point.
Rainfall[edit | edit source]
Winter is generally dry. Most days are sunny. Occasionally, slight rainfall occurs because of conditions in northwest India. These are known as western disturbances.
| City | Average temperature (°C) | Average Rainfall (mm) |
|---|---|---|
| Darjeeling | 7.6 | 30 |
| Siliguri | 17.3 | 60 |
| Jalpaiguri | 18.9 | 36 |
| Malda | 20.6 | 27 |
| Shantiniketan | 19.7 | 44 |
| Behrampore | 20.6 | 32 |
| Krishnagar | 20.5 | 29 |
| Asansol | 19.7 | 46 |
| Bankura | 20.1 | 42 |
| Kolkata | 21.6 | 35 |
| Digha | 21.1 | 43 |
| West Bengal | 17.0 | 38.5 |
Extreme temperatures[edit | edit source]
Sources: India Meteorological Department[50][51]
Record high temperatures[edit | edit source]
The chart below shows the highest recorded temperatures in individual stations, for all months in West Bengal, with place and date.
| Month | Highest Recorded Temperature (°C) | Place | Date |
|---|---|---|---|
| January | style="Template:Weather box/colt"| 36.8 | Krishnanagar | 1 January 1977 |
| February | style="Template:Weather box/colt"| 39.3 | Bankura | 26 February 2006 |
| March | style="Template:Weather box/colt"| 44.5 | Behrampore | 27 March 1980 |
| April | style="Template:Weather box/colt"| 47.2 | Kalaikunda | 30 April 2024 |
| May | style="Template:Weather box/colt"| 48.3 | Behrampore | 23 May 1981 |
| June | style="Template:Weather box/colt" | 47.8 | Suri | 10 June 1966 |
| July | style="Template:Weather box/colt"| 43.0 | Krishnanagar | 22 July 1994 |
| August | style="Template:Weather box/colt"| 43.0 | Krishnanagar | 3 August 1994 |
| September | style="Template:Weather box/colt"| 41.0 | Coochbehar | 11 September 1977 |
| October | style="Template:Weather box/colt"| 40.5 | Malda | 1 October 1978 |
| November | style="Template:Weather box/colt"| 38.5 | Bagati | 6 November 1976 |
| December | style="Template:Weather box/colt"| 36.5 | Bagati | 30 December 1984 |
| West Bengal | style="Template:Weather box/colt" | 48.3 | Behrampore | 23 May 1981 |
Record low temperatures[edit | edit source]
The chart below shows the lowest recorded temperatures in individual stations, for all months in West Bengal, with place and date.
| Month | Lowest Recorded Temperature (°C) | Place | Date |
|---|---|---|---|
| January | style="Template:Weather box/colt"| -7.2 | Darjeeling | 30 January 1971 |
| February | style="Template:Weather box/colt"| -6.4 | Darjeeling | 2 February 1971 |
| March | style="Template:Weather box/colt"| -4.8 | Darjeeling | 1 March 1971 |
| April | style="Template:Weather box/colt"| 0.0 | Darjeeling | 16 April 1971 |
| May | style="Template:Weather box/colt"| 1.4 | Darjeeling | 1 May 1981 |
| June | style="Template:Weather box/colt"| 4.6 | Kalimpong | 14 June 1991 |
| July | style="Template:Weather box/colt"| 3.9 | Darjeeling | 26 July 1944 |
| August | style="Template:Weather box/colt"| 7.4 | Kalimpong | 24 August 1971 |
| September | style="Template:Weather box/colt"| 5.9 | Kalimpong | 10 September 1991 |
| October | style="Template:Weather box/colt"| 3.2 | Darjeeling | 31 October 1972 |
| November | style="Template:Weather box/colt"| -4.4 | Darjeeling | 26 November 1970 |
| December | style="Template:Weather box/colt"| -4.6 | Darjeeling | 29 December 1970 |
| West Bengal | style="Template:Weather box/colt"| -7.2 | Darjeeling | 30 January 1971 |
Record low temperature in the plains[edit | edit source]
The chart below shows the lowest recorded temperatures in individual stations in the plains, for all months in West Bengal, with place and date.
| Month | Lowest Recorded Temperature (°C) | Place | Date |
|---|---|---|---|
| January | style="Template:Weather box/colt"| 0.9 | Krishnanagar | 2 January 1986 |
| February | style="Template:Weather box/colt"| 2.2 | Jalpaiguri | 5 February 1914 |
| March | style="Template:Weather box/colt"| 6.2 | Siliguri | 4 March 1965 |
| April | style="Template:Weather box/colt"| 8.1 | Coochbehar | 9 April 2014 |
| May | style="Template:Weather box/colt"| 11.5 | Jalpaiguri | 10 May 1987 |
| June | style="Template:Weather box/colt"| 13.8 | Contai | 12 June 1961 |
| July | style="Template:Weather box/colt"| 12.0 | Krishnanagar | 16 July 1995 |
| August | style="Template:Weather box/colt"| 12.4 | Sandheads | 7 August 1972 |
| September | style="Template:Weather box/colt"| 10.4 | Sandheads | 2 September 1976 |
| October | style="Template:Weather box/colt"| 10.0 | Sandheads | 1995 |
| November | style="Template:Weather box/colt"| 6.4 | Siliguri | 30 November 1971 |
| December | style="Template:Weather box/colt"| 2.4 | Siliguri | 26 December 1961 |
| West Bengal | style="Template:Weather box/colt"| 0.9 | Krishnanagar | 2 January 1986 |
Extreme Rainfall[edit | edit source]
The chart below shows the maximum recorded rainfall in individual stations (observatories) in the state, for all months, with place and date.
| Month | Highest Recorded 24 hrs Rainfall (mm) | Place | Date |
|---|---|---|---|
| January | style="Template:Weather box/colp"| 134.6 | Darjeeling | 10 January 1967 |
| February | style="Template:Weather box/colp"| 161.0 | Balurghat | 19 February 1989 |
| March | style="Template:Weather box/colp"| 243.2 | Sandheads | 4 March 1990 |
| April | style="Template:Weather box/colp"| 210.0 | Bardhaman | 3 April 1994 |
| May | style="Template:Weather box/colp"| 615.0 | Sandheads | 17 May 1995 |
| June | style="Template:Weather box/colp"| 507.5 | Sandheads | 21 June 1981 |
| July | style="Template:Weather box/colp"| 884.5 | Sagar Islands | 22 July 1991 |
| August | style="Template:Weather box/colp"| 490.0 | Sandheads | 22 August 1991 |
| September | style="Template:Weather box/colp"| 593.6 | Sandheads | 25 September 1986 |
| October | style="Template:Weather box/colp"| 419.2 | Kalimpong | 5 October 1968 |
| November | style="Template:Weather box/colp"| 322.0 | Sandheads | 10 November 1990 |
| December | style="Template:Weather box/colp"| 251.3 | Diamond Harbour | 11 December 1981 |
| West Bengal | style="Template:Weather box/colp"| 884.5 | Sagar Islands | 22 July 1991 |
Rainfall[edit | edit source]
 |
Annual rainfall varies in different parts of the state. North Bengal receives the highest rainfall, 200 to 400 cm. In the coastal areas rainfall is about 200 cm, in the Ganga plain and in the central part of the state rainfall is about 150–200 cm, and in the western plateau region the amount of rainfall received is about 100 to 125 cm. Drought is a common phenomenon in the Bankura and Purulia districts. Rainfall that occurs in the summer months often brings about heavy storms called Kalbaishakhi.
Cyclones in West Bengal[edit | edit source]
| Name | Lowest Pressure (mbar) | Year | Winds (in km/h) | Image |
|---|---|---|---|---|
| 1970 Bhola Cyclone | 966 | 1970 |  | |
| BOB 03 | 964 | 1981 |  | |
| BOB 07 | 994 | 1997 |  | |
| BOB 06 | 984 | 1998 |  | |
| BOB 04 | 998 | 2000 |  | |
| BOB 03 | 970 | 2002 | 100 |  |
| Sidr | 944 | 2007 | 215 |  |
| Rashmi | 996 | 2008 | 85 |  |
| Aila | 970 | 2009 | 120 |  |
| Komen | 986 | 2015 | 75 |  |
| Roanu | 983 | 2016 | 85 |  |
| Mora | 978 | 2017 | 110 |  |
| Amphan | 925 | 2020 | 240 |
Mountainous region[edit | edit source]
|
Because of the high altitude, mountainous parts of Darjeeling and Jalpaiguri experience a cool temperate and climate. The average temperature in summer is about 15 °C (59 °F), and winter temperature is about 2 °C (36 °F). Snowfall occurs in some parts of this region. Being obstructed by the Himalayas, the region receives heavy rainfall. Due to the scenic beauty and temperate climate of the region, a huge number of tourists visit the areas. Here Kalimpong is another hill station that is visited by many tourists in all seasons for its scenic beauty and the average cool temperature throughout the year.
Climate data[edit | edit source]
| Climate data for Kolkata (Alipore) 1991–2020 normals, extremes 1901–present | |||||||||||||
|---|---|---|---|---|---|---|---|---|---|---|---|---|---|
| Month | Jan | Feb | Mar | Apr | May | Jun | Jul | Aug | Sep | Oct | Nov | Dec | Year |
| Record high °C (°F) | 32.8 (91.0) |
38.4 (101.1) |
41.1 (106.0) |
43.3 (109.9) |
43.7 (110.7) |
43.9 (111.0) |
39.9 (103.8) |
38.4 (101.1) |
38.9 (102.0) |
39.0 (102.2) |
34.9 (94.8) |
32.5 (90.5) |
43.9 (111.0) |
| Mean maximum °C (°F) | 29.8 (85.6) |
33.9 (93.0) |
37.5 (99.5) |
38.8 (101.8) |
39.0 (102.2) |
37.8 (100.0) |
36.0 (96.8) |
35.3 (95.5) |
35.5 (95.9) |
35.3 (95.5) |
33.1 (91.6) |
30.0 (86.0) |
39.8 (103.6) |
| Average high °C (°F) | 25.5 (77.9) |
29.4 (84.9) |
33.7 (92.7) |
35.4 (95.7) |
35.5 (95.9) |
34.1 (93.4) |
32.5 (90.5) |
32.3 (90.1) |
32.6 (90.7) |
32.3 (90.1) |
30.2 (86.4) |
26.7 (80.1) |
31.7 (89.1) |
| Daily mean °C (°F) | 19.9 (67.8) |
23.8 (74.8) |
28.2 (82.8) |
30.6 (87.1) |
31.2 (88.2) |
30.6 (87.1) |
29.5 (85.1) |
29.4 (84.9) |
29.4 (84.9) |
28.3 (82.9) |
25.1 (77.2) |
21.1 (70.0) |
27.3 (81.1) |
| Average low °C (°F) | 14.3 (57.7) |
18.1 (64.6) |
22.9 (73.2) |
25.7 (78.3) |
26.8 (80.2) |
27.1 (80.8) |
26.7 (80.1) |
26.6 (79.9) |
26.3 (79.3) |
24.4 (75.9) |
20.1 (68.2) |
15.5 (59.9) |
22.9 (73.2) |
| Mean minimum °C (°F) | 10.9 (51.6) |
12.4 (54.3) |
18.2 (64.8) |
21.1 (70.0) |
21.8 (71.2) |
23.9 (75.0) |
24.3 (75.7) |
24.6 (76.3) |
23.9 (75.0) |
20.9 (69.6) |
16.9 (62.4) |
11.9 (53.4) |
10.0 (50.0) |
| Record low °C (°F) | 6.7 (44.1) |
7.2 (45.0) |
10.0 (50.0) |
16.1 (61.0) |
17.9 (64.2) |
20.4 (68.7) |
20.6 (69.1) |
22.6 (72.7) |
20.6 (69.1) |
17.2 (63.0) |
10.6 (51.1) |
7.2 (45.0) |
6.7 (44.1) |
| Average rainfall mm (inches) | 15.4 (0.61) |
24.6 (0.97) |
36.8 (1.45) |
55.0 (2.17) |
118.5 (4.67) |
276.7 (10.89) |
371.6 (14.63) |
372.1 (14.65) |
325.0 (12.80) |
179.6 (7.07) |
32.6 (1.28) |
5.6 (0.22) |
1,813.3 (71.39) |
| Average rainy days | 1.1 | 1.5 | 2.1 | 3.2 | 6.2 | 12.6 | 17.5 | 16.8 | 13.6 | 7.4 | 1.4 | 0.7 | 84.2 |
| Average relative humidity (%) (at 17:30 IST) | 62 | 55 | 51 | 61 | 68 | 77 | 82 | 83 | 82 | 76 | 68 | 65 | 69 |
| Mean monthly sunshine hours | 213.9 | 211.9 | 229.4 | 240.0 | 232.5 | 135.0 | 105.4 | 117.8 | 126.0 | 201.5 | 216.0 | 204.6 | 2,234 |
| Mean daily sunshine hours | 6.9 | 7.5 | 7.4 | 8.0 | 7.5 | 4.5 | 3.4 | 3.8 | 4.2 | 6.5 | 7.2 | 6.6 | 6.1 |
| Average ultraviolet index | 7 | 9 | 11 | 12 | 12 | 12 | 12 | 12 | 11 | 9 | 7 | 6 | 10 |
| Source 1: India Meteorological Department (sun 1971–2000)[52][53][54][55] Weather Atlas[56] | |||||||||||||
| Source 2: Tokyo Climate Center (mean temperatures 1991–2020)[57] [58] | |||||||||||||
| Climate data for Kolkata (Dumdum Airport) 1991–2020 normals, extremes 1939–2020 | |||||||||||||
|---|---|---|---|---|---|---|---|---|---|---|---|---|---|
| Month | Jan | Feb | Mar | Apr | May | Jun | Jul | Aug | Sep | Oct | Nov | Dec | Year |
| Record high °C (°F) | 32.5 (90.5) |
37.3 (99.1) |
40.6 (105.1) |
42.8 (109.0) |
43.1 (109.6) |
43.7 (110.7) |
39.2 (102.6) |
37.7 (99.9) |
37.5 (99.5) |
36.8 (98.2) |
36.0 (96.8) |
33.0 (91.4) |
43.7 (110.7) |
| Average high °C (°F) | 25.3 (77.5) |
29.2 (84.6) |
33.6 (92.5) |
35.9 (96.6) |
36.1 (97.0) |
34.8 (94.6) |
33.2 (91.8) |
33.0 (91.4) |
33.3 (91.9) |
32.5 (90.5) |
30.1 (86.2) |
26.6 (79.9) |
32.0 (89.6) |
| Daily mean °C (°F) | 18.8 (65.8) |
22.9 (73.2) |
27.4 (81.3) |
30.1 (86.2) |
30.6 (87.1) |
30.3 (86.5) |
29.5 (85.1) |
29.3 (84.7) |
29.3 (84.7) |
27.9 (82.2) |
24.3 (75.7) |
20.1 (68.2) |
26.7 (80.1) |
| Average low °C (°F) | 12.9 (55.2) |
16.9 (62.4) |
21.9 (71.4) |
25.2 (77.4) |
26.2 (79.2) |
26.8 (80.2) |
26.6 (79.9) |
26.5 (79.7) |
26.2 (79.2) |
24.1 (75.4) |
19.3 (66.7) |
14.3 (57.7) |
22.2 (72.0) |
| Record low °C (°F) | 5.0 (41.0) |
6.1 (43.0) |
12.1 (53.8) |
16.6 (61.9) |
17.6 (63.7) |
19.2 (66.6) |
20.1 (68.2) |
21.1 (70.0) |
21.7 (71.1) |
15.7 (60.3) |
11.7 (53.1) |
6.1 (43.0) |
5.0 (41.0) |
| Average rainfall mm (inches) | 15.8 (0.62) |
20.2 (0.80) |
31.9 (1.26) |
53.4 (2.10) |
140.5 (5.53) |
247.5 (9.74) |
366.5 (14.43) |
355.4 (13.99) |
282.1 (11.11) |
170.2 (6.70) |
21.3 (0.84) |
6.8 (0.27) |
1,711.5 (67.38) |
| Average rainy days | 1.1 | 1.4 | 2.3 | 3.5 | 6.6 | 12.4 | 17.6 | 17.1 | 13.0 | 7.1 | 1.1 | 0.7 | 83.8 |
| Average relative humidity (%) (at 08:30 IST) | 61 | 53 | 49 | 58 | 66 | 76 | 81 | 82 | 81 | 75 | 67 | 66 | 68 |
| Source 1: India Meteorological Department[58] | |||||||||||||
| Source 2: Tokyo Climate Center (mean temperatures 1991–2020)[59] | |||||||||||||
| Month | Jan | Feb | Mar | Apr | May | Jun | Jul | Aug | Sep | Oct | Nov | Dec | Year |
|---|---|---|---|---|---|---|---|---|---|---|---|---|---|
| Record high °C (°F) | 32.5 (90.5) |
33.2 (91.8) |
38.1 (100.6) |
41.7 (107.1) |
40.8 (105.4) |
41.9 (107.4) |
40.4 (104.7) |
40.0 (104.0) |
39.2 (102.6) |
36.6 (97.9) |
33.8 (92.8) |
32.6 (90.7) |
41.9 (107.4) |
| Mean maximum °C (°F) | 25.6 (78.1) |
27.9 (82.2) |
32.8 (91.0) |
34.9 (94.8) |
35.3 (95.5) |
36.3 (97.3) |
36.0 (96.8) |
36.7 (98.1) |
35.8 (96.4) |
33.5 (92.3) |
30.4 (86.7) |
27.2 (81.0) |
37.0 (98.6) |
| Average high °C (°F) | 22 (72) |
24.5 (76.1) |
29.3 (84.7) |
30.8 (87.4) |
29.9 (85.8) |
29.5 (85.1) |
29.1 (84.4) |
29.6 (85.3) |
29.2 (84.6) |
28.5 (83.3) |
26.3 (79.3) |
23.4 (74.1) |
27.7 (81.8) |
| Average low °C (°F) | 10.7 (51.3) |
12.8 (55.0) |
16.1 (61.0) |
19.5 (67.1) |
22.1 (71.8) |
24 (75) |
24.6 (76.3) |
24.6 (76.3) |
23.5 (74.3) |
19.7 (67.5) |
15.2 (59.4) |
11.8 (53.2) |
18.7 (65.7) |
| Mean minimum °C (°F) | 6.9 (44.4) |
7.2 (45.0) |
12.5 (54.5) |
16.5 (61.7) |
18.6 (65.5) |
22.0 (71.6) |
23.4 (74.1) |
23.6 (74.5) |
21.9 (71.4) |
16.8 (62.2) |
11.9 (53.4) |
7.7 (45.9) |
6.5 (43.7) |
| Record low °C (°F) | 1.9 (35.4) |
3.5 (38.3) |
6.2 (43.2) |
9.6 (49.3) |
15.0 (59.0) |
20.0 (68.0) |
21.0 (69.8) |
18.4 (65.1) |
19.8 (67.6) |
12.3 (54.1) |
6.4 (43.5) |
2.4 (36.3) |
1.9 (35.4) |
| Average precipitation mm (inches) | 23 (0.9) |
24 (0.9) |
34 (1.3) |
76 (3.0) |
249 (9.8) |
628 (24.7) |
843 (33.2) |
589 (23.2) |
403 (15.9) |
121 (4.8) |
10 (0.4) |
11 (0.4) |
3,011 (118.5) |
| Average rainy days | 4 | 4 | 5 | 11 | 17 | 20 | 21 | 20 | 18 | 8 | 2 | 2 | 132 |
| Average relative humidity (%) | 69 | 65 | 54 | 63 | 79 | 88 | 90 | 88 | 87 | 80 | 70 | 68 | 75 |
| Average ultraviolet index | 5 | 7 | 9 | 11 | 12 | 13 | 14 | 13 | 11 | 8 | 5 | 4 | 9 |
| Source 1: normal temperatures[60][61]Ultraviolet Index[62] | |||||||||||||
| Source 2: Extremes(India Meteorological Department[63]), Mean maximum and Mean minimum temperatures[64] | |||||||||||||
| Climate data for Darjeeling (1981–2010, extremes 1901–2012) | |||||||||||||
|---|---|---|---|---|---|---|---|---|---|---|---|---|---|
| Month | Jan | Feb | Mar | Apr | May | Jun | Jul | Aug | Sep | Oct | Nov | Dec | Year |
| Record high °C (°F) | 19.0 (66.2) |
19.2 (66.6) |
24.0 (75.2) |
27.0 (80.6) |
25.7 (78.3) |
27.7 (81.9) |
28.0 (82.4) |
28.5 (83.3) |
27.5 (81.5) |
26.0 (78.8) |
24.5 (76.1) |
20.0 (68.0) |
28.5 (83.3) |
| Average high °C (°F) | 10.7 (51.3) |
12.4 (54.3) |
15.6 (60.1) |
18.5 (65.3) |
19.3 (66.7) |
19.8 (67.6) |
19.6 (67.3) |
20.0 (68.0) |
19.8 (67.6) |
19.5 (67.1) |
17.1 (62.8) |
14.0 (57.2) |
17.2 (63.0) |
| Daily mean °C (°F) | 6.1 (43.0) |
7.7 (45.9) |
10.6 (51.1) |
13.7 (56.7) |
14.9 (58.8) |
16.3 (61.3) |
16.5 (61.7) |
16.7 (62.1) |
16.1 (61.0) |
15.0 (59.0) |
11.7 (53.1) |
8.9 (48.0) |
12.9 (55.1) |
| Average low °C (°F) | 1.5 (34.7) |
2.9 (37.2) |
5.7 (42.3) |
8.8 (47.8) |
10.6 (51.1) |
12.8 (55.0) |
13.4 (56.1) |
13.4 (56.1) |
12.4 (54.3) |
10.5 (50.9) |
6.3 (43.3) |
3.8 (38.8) |
8.5 (47.3) |
| Record low °C (°F) | −7.2 (19.0) |
−6.4 (20.5) |
−4.8 (23.4) |
0.0 (32.0) |
1.4 (34.5) |
6.6 (43.9) |
3.9 (39.0) |
8.0 (46.4) |
6.2 (43.2) |
3.2 (37.8) |
−4.4 (24.1) |
−4.6 (23.7) |
−7.2 (19.0) |
| Average rainfall mm (inches) | 13.5 (0.53) |
14.0 (0.55) |
30.8 (1.21) |
76.9 (3.03) |
137.9 (5.43) |
466.0 (18.35) |
656.7 (25.85) |
528.2 (20.80) |
379.7 (14.95) |
59.1 (2.33) |
14.4 (0.57) |
2.9 (0.11) |
2,380 (93.70) |
| Average rainy days | 1.1 | 1.5 | 2.8 | 6.8 | 10.5 | 18.8 | 22.9 | 21.7 | 14.9 | 2.9 | 0.6 | 0.7 | 105.3 |
| Average relative humidity (%) (at 17:30 IST) | 81 | 78 | 75 | 78 | 88 | 93 | 94 | 92 | 90 | 84 | 75 | 74 | 84 |
| Mean daily sunshine hours | 5.4 | 5.0 | 4.7 | 4.9 | 4.9 | 2.4 | 2.5 | 3.3 | 3.2 | 5.4 | 6.3 | 6.1 | 4.5 |
| Average ultraviolet index | 5 | 6 | 9 | 11 | 13 | 15 | 15 | 14 | 12 | 9 | 6 | 4 | 10 |
| Source 1: India Meteorological Department[65][66] UV Index[67] | |||||||||||||
| Source 2: Deutscher Wetterdienst (sun 1891–1990)[68] | |||||||||||||
| Climate data for Jalpaiguri (1991–2020, extremes 1901–present) | |||||||||||||
|---|---|---|---|---|---|---|---|---|---|---|---|---|---|
| Month | Jan | Feb | Mar | Apr | May | Jun | Jul | Aug | Sep | Oct | Nov | Dec | Year |
| Record high °C (°F) | 35.4 (95.7) |
35.4 (95.7) |
37.3 (99.1) |
40.0 (104.0) |
40.4 (104.7) |
39.4 (102.9) |
40.9 (105.6) |
38.4 (101.1) |
38.8 (101.8) |
38.4 (101.1) |
38.4 (101.1) |
35.4 (95.7) |
40.9 (105.6) |
| Mean maximum °C (°F) | 27.2 (81.0) |
29.7 (85.5) |
34.1 (93.4) |
35.8 (96.4) |
36.4 (97.5) |
36.7 (98.1) |
36.4 (97.5) |
36.3 (97.3) |
35.6 (96.1) |
34.3 (93.7) |
32.5 (90.5) |
29.4 (84.9) |
37.4 (99.3) |
| Average high °C (°F) | 23.5 (74.3) |
26.5 (79.7) |
30.1 (86.2) |
31.8 (89.2) |
32.2 (90.0) |
32.3 (90.1) |
32.1 (89.8) |
32.8 (91.0) |
32.0 (89.6) |
31.5 (88.7) |
29.4 (84.9) |
26.0 (78.8) |
30.1 (86.2) |
| Average low °C (°F) | 10.7 (51.3) |
13.4 (56.1) |
17.3 (63.1) |
21.1 (70.0) |
23.3 (73.9) |
25.0 (77.0) |
25.5 (77.9) |
25.6 (78.1) |
24.7 (76.5) |
21.8 (71.2) |
17.0 (62.6) |
12.8 (55.0) |
20.0 (68.0) |
| Mean minimum °C (°F) | 7.7 (45.9) |
9.2 (48.6) |
12.8 (55.0) |
16.4 (61.5) |
19.7 (67.5) |
21.3 (70.3) |
22.7 (72.9) |
23.3 (73.9) |
21.5 (70.7) |
18.3 (64.9) |
13.8 (56.8) |
8.7 (47.7) |
8.4 (47.1) |
| Record low °C (°F) | 3.8 (38.8) |
2.2 (36.0) |
7.8 (46.0) |
10.3 (50.5) |
11.5 (52.7) |
15.5 (59.9) |
18.1 (64.6) |
18.1 (64.6) |
17.7 (63.9) |
15.4 (59.7) |
9.4 (48.9) |
5.6 (42.1) |
2.2 (36.0) |
| Average rainfall mm (inches) | 9.0 (0.35) |
16.1 (0.63) |
35.2 (1.39) |
118.7 (4.67) |
332.2 (13.08) |
628.4 (24.74) |
917.3 (36.11) |
624.1 (24.57) |
511.1 (20.12) |
154.1 (6.07) |
7.1 (0.28) |
3.3 (0.13) |
3,356.9 (132.16) |
| Average rainy days | 0.8 | 1.1 | 2.3 | 6.9 | 12.5 | 17.4 | 21.2 | 17.5 | 14.3 | 5.4 | 0.7 | 0.3 | 100.3 |
| Average relative humidity (%) (at 08:30 IST) | 87 | 81 | 73 | 76 | 81 | 86 | 89 | 87 | 87 | 83 | 79 | 83 | 83 |
| Source: India Meteorological Department[69][70] | |||||||||||||
Template:Shantiniketan weatherbox
| Month | Jan | Feb | Mar | Apr | May | Jun | Jul | Aug | Sep | Oct | Nov | Dec | Year |
|---|---|---|---|---|---|---|---|---|---|---|---|---|---|
| Record high °C (°F) | 34.9 (94.8) |
37.2 (99.0) |
44.5 (112.1) |
46.4 (115.5) |
48.3 (118.9) |
46.9 (116.4) |
40.4 (104.7) |
42.4 (108.3) |
40.3 (104.5) |
39.5 (103.1) |
37.8 (100.0) |
34.0 (93.2) |
48.3 (118.9) |
| Mean maximum °C (°F) | 28.7 (83.7) |
32.8 (91.0) |
38.3 (100.9) |
40.7 (105.3) |
41.2 (106.2) |
39.4 (102.9) |
36.0 (96.8) |
35.9 (96.6) |
36.0 (96.8) |
35.8 (96.4) |
33.6 (92.5) |
30.2 (86.4) |
42.4 (108.3) |
| Average high °C (°F) | 25.5 (77.9) |
29.0 (84.2) |
34.0 (93.2) |
37.0 (98.6) |
36.5 (97.7) |
34.9 (94.8) |
33.0 (91.4) |
33.2 (91.8) |
33.1 (91.6) |
33.0 (91.4) |
31.0 (87.8) |
27.3 (81.1) |
32.3 (90.1) |
| Average low °C (°F) | 12.2 (54.0) |
15.5 (59.9) |
19.8 (67.6) |
23.7 (74.7) |
25.0 (77.0) |
26.1 (79.0) |
26.1 (79.0) |
26.3 (79.3) |
25.8 (78.4) |
23.9 (75.0) |
19.1 (66.4) |
14.3 (57.7) |
21.5 (70.7) |
| Mean minimum °C (°F) | 8.9 (48.0) |
11.5 (52.7) |
15.4 (59.7) |
19.3 (66.7) |
20.9 (69.6) |
23.2 (73.8) |
24.0 (75.2) |
24.0 (75.2) |
23.4 (74.1) |
20.3 (68.5) |
14.9 (58.8) |
10.9 (51.6) |
8.8 (47.8) |
| Record low °C (°F) | 3.9 (39.0) |
5.0 (41.0) |
8.9 (48.0) |
15.0 (59.0) |
15.3 (59.5) |
16.6 (61.9) |
21.0 (69.8) |
19.6 (67.3) |
21.1 (70.0) |
15.6 (60.1) |
8.3 (46.9) |
5.7 (42.3) |
3.9 (39.0) |
| Average rainfall mm (inches) | 8.2 (0.32) |
17.7 (0.70) |
22.3 (0.88) |
52.4 (2.06) |
129.4 (5.09) |
229.2 (9.02) |
293.7 (11.56) |
269.7 (10.62) |
298.5 (11.75) |
126.7 (4.99) |
9.9 (0.39) |
7.6 (0.30) |
1,465.5 (57.70) |
| Average rainy days | 0.8 | 1.4 | 1.9 | 3.0 | 6.6 | 12 | 13.5 | 13.7 | 12.6 | 5.1 | 0.8 | 0.5 | 71.8 |
| Average relative humidity (%) (at 17:30 IST) | 63 | 60 | 53 | 58 | 68 | 79 | 85 | 84 | 84 | 78 | 67 | 65 | 70 |
| Source: India Meteorological Department[71][72] | |||||||||||||
References[edit | edit source]
- ↑ "চার জেলায় বৃষ্টির সম্ভাবনা, বাকি রাজ্য থাকবে 'শুখা'". Retrieved 5 November 2020.
- ↑ "আগামী কয়েকদিন তাপমাত্রা বাড়লেও ঝড়বৃষ্টি পেতে পারে দক্ষিণবঙ্গ". 3 March 2018. Retrieved 5 November 2020.
- ↑ "Kolkata records year's highest temperature at 39.6". Retrieved 25 October 2020.
- ↑ "Kolkata records hottest day of the season as heat wave heats hard". Retrieved 25 October 2020.
- ↑ "Temperature touches 41 degrees on hottest day". The Times of India. Retrieved 25 October 2020.
- ↑ "৪৪ ডিগ্রি সেলসিয়াসে শ্রীনিকেতন, ঘামে নাকাল কলকাতা". Retrieved 25 October 2020.
- ↑ "৪০ ডিগ্রিতে পুড়ছে পশ্চিমবঙ্গ". 10 May 2019. Retrieved 25 October 2020.
- ↑ "বর্ষা খুঁড়িয়ে হাঁটায় দহনও বে-লাগাম". Retrieved 5 November 2020.
- ↑ "Kolkata reels under heatwave, Bankura sizzles at 45.1 degrees Celsius". Retrieved 25 October 2020.
- ↑ "Purulia scorches at 49 degrees". Retrieved 25 October 2020.
- ↑ "summer agony in monsoon season heat wave persists in several states". Retrieved 25 October 2020.
- ↑ "৪৩ ডিগ্রি গরমে পুড়ছে বাঁকুড়া". Retrieved 27 October 2020.
- ↑ "জ্বলছে বাংলা, একেবারেই অন্য চিত্র উত্তরবঙ্গের এলাকাগুলোতে". 30 April 2019. Retrieved 26 October 2020.
- ↑ "Kalbaishakhi may come in south Bengal, says Weather Office". 14 May 2019. Retrieved 30 October 2020.
- ↑ "Pre monsoon rain will continue in North Bengal, South Bengal will face discomfort weather". 29 May 2019. Retrieved 30 October 2020.
- ↑ "ঘূর্ণিঝড় 'ফনি'-র প্রভাব বাংলায়! কবে কোথায়, জেনে নিন আবহাওয়া দফতরের সতর্কবার্তা". 29 April 2019. Retrieved 5 November 2020.
- ↑ "Regional Meteorological Department, Kolkata". Retrieved 25 October 2020.
- ↑ "১০ বছরে উষ্ণতম জুলাই, শহরে ৩৭ ডিগ্রি!". Retrieved 5 November 2020.
- ↑ "গরমে নাকাল শিলিগুড়ি". Retrieved 30 October 2020.
- ↑ "ঘড়িতে সাড়ে বারোটা, পারদে ৪০ ডিগ্রি". Retrieved 30 October 2020.
- ↑ "দার্জিলিঙে ঘুরছে পাখা, সমতলে ৩৯ ডিগ্রি!". Archived from the original on 2 November 2020. Retrieved 30 October 2020.
- ↑ "রেকর্ড ভেঙে ৪১ ডিগ্রিতে জলপাইগুড়ির পারদ". Retrieved 30 October 2020.
- ↑ "Many parts of Sikkim is feeling above 30 degrees temperatures". Retrieved 1 November 2020.
- ↑ "ভারী বর্ষণের সম্ভাবনা বাড়ছে উত্তরবঙ্গে". Retrieved 28 October 2020.
- ↑ "ভাসছে উত্তর, বৃষ্টির প্রতীক্ষায় দক্ষিণবঙ্গ". Retrieved 28 October 2020.
- ↑ "Good Monsoon rains in Siliguri and Jalpaiguri". 26 June 2019. Retrieved 28 October 2020.
- ↑ "Siliguri is logging in 337 mm rain". Retrieved 28 October 2020.
- ↑ "250 mm of rainfall destroyed lifestyle of North". 23 September 2020. Retrieved 28 October 2020.
- ↑ "Regional Meteorological Department, Kolkata". Retrieved 9 November 2020.
- ↑ "শহর-শহরতলির তাপমাত্রা নামল স্বাভাবিকের ৩ ডিগ্রি নীচে, দেশজুড়ে শৈত্যপ্রবাহের সতর্কতা". Retrieved 8 November 2020.
- ↑ "রাজ্যের ৫ জেলায় বৃষ্টির পূর্বাভাস, শৈত্যপ্রবাহ নিয়ে বিশেষ সতর্কবার্তা দিল হাওয়া অফিস". 6 November 2020. Retrieved 8 November 2020.
- ↑ "উত্তরে যেমন নামছে পারদ, সঙ্গে মিলছে বৃষ্টির পূর্বাভাস". Retrieved 8 November 2020.
- ↑ "Cyclone Bulbul in West Bengal: Latest News & Videos, Photos about Cyclone Bulbul in West Bengal | the Economic Times - Page 1".
- ↑ "Bay of Bengal Cyclone: Latest News, Videos and Bay of Bengal Cyclone Photos | Times of India". The Times of India.
- ↑ "Winter Season from December to February likely to be Warmer in Various Parts of Country". Retrieved 7 December 2020.
- ↑ "সান্দাকফুতে তুষারপাত, বরফে ঢাকল ছাঙ্গুও". Retrieved 25 November 2020.
- ↑ "বরফমোড়া সান্দাকফু, সম্ভাবনা দার্জিলিঙেও". Retrieved 25 November 2020.
- ↑ "এপ্রিলে তুষারপাত বাংলায়". Retrieved 25 November 2020.
- ↑ "মাঘে এল বাঘা শীত". Retrieved 25 November 2020.[dead link]
- ↑ "রাজ্য জুড়ে শৈত্যপ্রবাহ". Retrieved 25 November 2020.
- ↑ "পারদ পড়ে রোজই রেকর্ড গড়ছে ঠান্ডা". Retrieved 24 November 2020.
- ↑ "শীতে কাঁপছে উত্তরবঙ্গ, শিলিগুড়িতে পারদ নামল ৩ ডিগ্রিতে". Retrieved 24 November 2020.
- ↑ "৪.৪ ডিগ্রি! শিলিগুড়ির চাই রুম হিটার". Archived from the original on 20 August 2022. Retrieved 24 November 2020.
- ↑ "কমছে পারদ, আগামী ২৪ ঘন্টায় জাঁকিয়ে পড়বে শীত". Retrieved 25 November 2020.
- ↑ "তীব্র শীতে কাঁপছে কলকাতা সহ রাজ্য". 9 January 2013. Retrieved 24 November 2020.
- ↑ "কলকাতায় ১০.৬ ডিগ্রি, দমদমে ৯.৫, শ্রীনিকেতনে ৫.৮". Retrieved 24 November 2020.
- ↑ "শীতের দাপটে কাঁপছে রাজ্য, পারদ নামল তিন ডিগ্রি". Retrieved 24 November 2020.
- ↑ "আরও নামল তাপমাত্রা! ১০ বছরে দ্বিতীয় সর্বনিম্ন কলকাতা, শিলিগুড়ি ৫.৫ ডিগ্রি". 29 December 2018. Retrieved 24 November 2020.
- ↑ "১১.৯ ডিগ্রি, শীতলতম দিন কলকাতায়". Retrieved 25 November 2020.[dead link]
- ↑ "Climatological Normals for Indian Stations" (PDF). Climatological Normals 1981–2010. India Meteorological Department. January 2015. Archived from the original (PDF) on 5 February 2020. Retrieved 29 November 2020.
- ↑ "Extremes of Temperature & Rainfall for Indian Stations (Up to 2012)" (PDF). India Meteorological Department. December 2016. Archived from the original (PDF) on 5 February 2020. Retrieved 29 November 2020.
- ↑ "Station: Calcutta (Alipur) Climatological Table 1981–2010" (PDF). Climatological Normals 1981–2010. India Meteorological Department. January 2015. pp. 161–162. Archived from the original (PDF) on 5 February 2020. Retrieved 2 March 2020.
- ↑ "Extremes of Temperature & Rainfall for Indian Stations (Up to 2012)" (PDF). India Meteorological Department. December 2016. p. M237. Archived from the original (PDF) on 5 February 2020. Retrieved 2 March 2020.
- ↑ "Table 3 Monthly mean duration of Sun Shine (hours) at different locations in India" (PDF). Daily Normals of Global & Diffuse Radiation (1971–2000). India Meteorological Department. December 2016. p. M-3. Archived from the original (PDF) on 5 February 2020. Retrieved 2 March 2020.
- ↑ "Kolkata (Alipore) (42807)". India Meteorological Department. Retrieved 10 September 2022.
- ↑ "Climate and monthly weather forecast Kolkata, India". Weather Atlas. Retrieved 17 June 2022.
- ↑ "Normals Data: Kolkata/Alipore - India Latitude: 22.53°N Longitude: 88.33°E Height: 6 (m)". Japan Meteorological Agency. Retrieved 2 March 2020.
- ↑ 58.0 58.1 "Climatological Tables 1991-2020" (PDF). India Meteorological Department. p. 21. Archived from the original (PDF) on 1 January 2023. Retrieved 1 January 2023.
- ↑ "Normals Data: Kolkata/Dum Dum - India Latitude: 22.65°N Longitude: 88.45°E Height: 6 (m)". Japan Meteorological Agency. Retrieved 2 March 2020.
- ↑ "Climate data for Siliguri". en.climate-data.org. Retrieved 8 June 2023.
- ↑ "Regional Meteorological Department, Kolkata". Retrieved 7 December 2020.
- ↑ "Average UV Index for Siliguri". Retrieved 7 December 2020.
- ↑
"Extremes of Temperature & Rainfall for Indian Stations (Up to 2012)" (PDF). India Meteorological Department. December 2016. p. M229. Archived from the original (PDF) on 21 October 2020. Retrieved 21 October 2020.
{{cite web}}:|archive-date=/|archive-url=timestamp mismatch; 5 February 2020 suggested (help) - ↑ "Climate for Siliguri city". Retrieved 3 December 2020.
- ↑ "Station: Darjeeling Climatological Table 1981–2010" (PDF). Climatological Normals 1981–2010. India Meteorological Department. January 2015. pp. 227–228. Archived from the original (PDF) on 5 February 2020. Retrieved 18 February 2020.
- ↑ "Extremes of Temperature & Rainfall for Indian Stations (Up to 2012)" (PDF). India Meteorological Department. December 2016. p. M233. Archived from the original (PDF) on 5 February 2020. Retrieved 17 February 2020.
- ↑ "UV Index, Darjeeling". Weather Online India. Archived from the original on 15 August 2022. Retrieved 9 December 2020.
- ↑ "Klimatafel von Darjeeling, West Bengal / Indische Union" [Climate table of Darjeeling, West Bengal / Indian Union] (PDF). Baseline climate means (1961–1990) from stations all over the world (in Deutsch). Deutscher Wetterdienst (German Meteorological Service). Archived (PDF) from the original on 30 May 2022. Retrieved 19 March 2020.
- ↑ "Station: Jalpaiguri, Climatological Table 1981–2010" (PDF). Climatological Normals 1981–2010. India Meteorological Department. January 2015. pp. 351–352. Archived from the original (PDF) on 5 February 2020. Retrieved 10 January 2021.
- ↑ "Extremes of Temperature & Rainfall for Indian Stations (Up to 2012)" (PDF). India Meteorological Department. December 2016. p. M236. Archived from the original (PDF) on 5 February 2020. Retrieved 19 December 2020.
- ↑ "Behrampore Climatological Table 1981–2010" (PDF). Climatological Normals 1981–2010. India Meteorological Department. January 2015. pp. 200–201. Archived from the original (PDF) on 5 February 2020. Retrieved 10 January 2021.
- ↑ "Extremes of Temperature & Rainfall for Indian Stations (Up to 2012)" (PDF). India Meteorological Department. December 2016. p. 231. Archived from the original (PDF) on 5 February 2020. Retrieved 6 January 2021.
.png)