



Mediagroup (talk | contribs) m Page crafted. |
added structure for consistency based on references |
||
| Line 1: | Line 1: | ||
{{Short description|none}} | {{Short description|none}} | ||
{{Distinguish|Irrigation in India|Environment of India}} | {{Distinguish|Irrigation in India|Environment of India}} | ||
{{Use dmy dates}}{{ | {{Use dmy dates|date=February 2024}} | ||
{{Use Indian English|date=February 2024}} | |||
{ | {{Infobox water supply and sanitation | ||
|country=India | |||
|water_coverage = | |||
|access_improved_water = | |||
| | |access_basic_water = 98.7% (2018)<ref name="NITI Aayog 2017">{{Cite book |date=2017 |title=Progress on drinking water, sanitation and hygiene: 2017 update and SDG baselines |url=https://niti.gov.in/sites/default/files/2023-07/National-Multidimentional-Poverty-Index-2023-Final-17th-July.pdf |publisher=NITI Aayog |publication-place=New Delhi|isbn=978-92-4-151289-3}}</ref><ref name="JMP UNICEF">{{cite web | ||
| | |||
| | |||
| | |||
|last = World Health Organization | |last = World Health Organization | ||
|author-link = | |author-link = World Health Organization | ||
|author2 = UNICEF | |author2 = UNICEF | ||
|title = Joint Monitoring Program | |title = Joint Monitoring Program | ||
|url = https://washdata.org/data/household#!/dashboard/new}}</ref> | |url = https://washdata.org/data/household#!/dashboard/new}}</ref> | ||
| | |sanitation_coverage = | ||
|access_improved_sanitation= | |||
| | |access_basic_sanitation = 98.7% (2018)<ref name="NITI Aayog 2017"/><ref name="JMP UNICEF" /> | ||
* Safely | * Safely managed sanitation: 97% | ||
* Basic | * Basic sanitation: 99% | ||
* Limited | * Limited sanitation: 7% | ||
* No access to sanitation ( | * No access to sanitation (open defecation): 1% | ||
| | |share_wastewater_treated = 27% (2003)<ref name="Panse 2006">{{Cite web |last=Panse |first=Dayanand B. |date=2006 |title=Ecological sanitation – a need of today! Progress of EcoSan in India |url=http://www.gtz.de/en/dokumente/en-innovative-ecosan-network-india-progress-text-2006.pdf |url-status=dead |archive-url=https://web.archive.org/web/20110807122810/http://www.gtz.de/en/dokumente/en-innovative-ecosan-network-india-progress-text-2006.pdf |archive-date=7 August 2011 |publisher=DWA, Hennef and GTZ, Eschborn |page=3}} This figure refers to 921 Class I Cities and Class II Towns in 2003–04.</ref> | ||
|continuity_of_supply = | |||
|urban_water_use = 126 (2006)<ref name="WSP Kuwasip"/> | |||
| | |water_use = | ||
|tariff = | |||
| | |metering = 55% in urban areas (1999)<ref name="National Institute of Urban Affairs 2005">{{Cite web |date=2005 |title=Status of Water Supply, Sanitation and Solid Waste Management in Urban Areas |url=https://www.scribd.com/document/23362613/Status-of-Water-Supply-Sanitation-and-Solid-Waste-Management-in-Urban-Areas-Part-1# |url-access=limited |publisher=National Institute of Urban Affairs |pages=xix–xxvi, 28 |via=[[Scribd]]}} The evaluation is based on a survey of all 23 metropolitan cities in India (cities with more than 1 million inhabitants) and a representative sample of 277 smaller cities with an aggregate population of 140 million. The survey was carried out in 1999.</ref> | ||
| | |investment = {{USD}}5 / capita (2012)<ref name="Planning Commission">{{Cite web |title=Draft Report of the Steering Committee on Urban Development for Eleventh Five Year Plan (2007–2012) |url=http://planningcommission.nic.in/aboutus/committee/strgrp11/str11_hud1.pdf |url-status=dead |archive-url=https://web.archive.org/web/20160304063649/http://planningcommission.nic.in/aboutus/committee/strgrp11/str11_hud1.pdf |archive-date=4 March 2016 |publisher=[[Planning Commission (India)]]}}</ref> | ||
|share_by_utilities = | |||
| | |financing = | ||
| | |tax_financing = | ||
|external_financing = | |||
|non_revenue_water = | |||
|decentralization = Partial | |||
|company = No | |||
|regulator = No | |||
| | |policy_setting = State governments; Ministry of Housing and Urban Poverty Alleviation, Ministry of Urban Development and Ministry of Drinking Water and Sanitation at the central level | ||
|sector_law = No | |||
| | |urban_providers = 3,255 (1991) | ||
|rural_providers = about 100,000 | |||
| | |providers = | ||
| | }} | ||
In 2018, 98.7% of Indians had access to the basic [[water]] and [[sanitation]] facilities.<ref name="NITI Aayog 2017"/> India faces challenges ranging from [[Water source|sourcing water]] for its megacities to its [[Water distribution system|distribution network]] which is [[Intermittent water supply|intermittent]] in rural areas with continuous distribution networks just beginning to emerge. [[Non-revenue water]] is a challenge. | |||
| | |||
| | |||
| | |||
| | |||
| | |||
| | |||
| | |||
| | |||
|} | |||
India faces challenges ranging from [[Water source|sourcing water]] for its megacities to its [[Water distribution system|distribution network]] which is | |||
The share of Indians with access to [[Improved water source|improved sources of water]] increased significantly from 72% in 1990 to 88% in 2008.<ref name="JMP" /> In 1980, rural sanitation coverage was estimated at 1%. By 2018, it reached | The share of Indians with access to [[Improved water source|improved sources of water]] increased significantly from 72% in 1990 to 88% in 2008 and stood at 98.7% in 2018.<ref name="JMP" /> In 1980, rural sanitation coverage was estimated at 1%. By 2018, it reached over 98%.<ref name="JMP">UNICEF/WHO [[Joint Monitoring Programme for Water Supply and Sanitation]] estimate for 2008 based on the 2006 [[Demographic and Health Survey]], the 2001 census, other data and the extrapolation of previous trends to 2010.</ref><ref name="NITI Aayog 2017"/>{{rp|p=78}} However, many people still lack access to water and sewage infrastructure. | ||
== Water supply == | == Water supply == | ||
=== Cities === | === Cities === | ||
In 2005 none | In 2005, none among 35 Indian cities with populations above one million distributed water more than a few hours per day, despite generally sufficient infrastructure. Due inadequate water pressure, people struggled collecting water even when available.<ref name="World Bank">{{Cite web |title=Project Information Document (PID) Concept Stage. Delhi Water Supply & Sewerage |url=https://documents1.worldbank.org/curated/en/458421468035082934/text/36065.txt | ||
|url-status=live |archive-url=https://web.archive.org/web/20230101082144/https://documents1.worldbank.org/curated/en/458421468035082934/text/36065.txt | |||
|archive-date=1 January 2023 |access-date=1 January 2023 |website=World Bank}}</ref> | |||
Service benchmarking carried out 2006 across 28 cities found average supply duration around 3.3 hours daily, ranging from one hour every three days up 18 hours daily.<ref name="WSP Kuwasip" /> | |||
A 2007 study showed that 20 cities recorded average supply duration only 4.3 hours daily. Longest duration reached 12 hours daily at [[Chandigarh]], while lowest remained 0.3 hours at [[Rajkot]].<ref name="Asian Development Bank">{{Cite book |url=https://www.adb.org/publications/2007-benchmarking-and-data-book-water-utilities-india | |||
|title=2007 Benchmarking and Data Book of Water Utilities India |publisher=Asian Development Bank, Government of India |year=2007 |isbn=978-971-561-648-5 |page=3}}</ref> | |||
By 2015, 88% total population had access [[Improved water source|at least basic]] water,{{Efn|Term "at least basic water" introduced {{as of|2016|alt=new}}, related previous term "[[improved water source]]". Under Indian norms, access improved [[water supply]] exists when at least {{convert|40|l}} per person daily safe drinking water available within {{convert|1.6|km}} distance or {{convert|100|m}} elevation difference, relaxed as per field conditions. One pump required per 250 persons.{{According to whom|date=February 2021}}}} reaching 96% urban and 85% rural areas. Thus, nearly 150 million people still lacked access even basic water.{{Citation needed|date=January 2023}} | |||
In Delhi land usage for residential area varies widely from planned colonies to unplanned slums. Despite the large piped network, with some areas receiving intermittent water supply, there are large areas that lack coverage.<ref>{{Cite web |last=Aijaz |first=Rumi |title=Water supply in Delhi: Five key issues |url=https://www.orfonline.org/research/water-supply-in-delhi-five-key-issues-67477/ |access-date=2023 | In Delhi land usage for residential area varies widely from planned colonies to unplanned slums. Despite the large piped network, with some areas receiving intermittent water supply, there are large areas that lack coverage.<ref>{{Cite web |last=Aijaz |first=Rumi |date=8 June 2020 |title=Water supply in Delhi: Five key issues |url=https://www.orfonline.org/research/water-supply-in-delhi-five-key-issues-67477/ |access-date=2 January 2023 |website=ORF |language=en-US}}</ref> Reliance on dubious private water vendors is costly. For example, in Delhi water trucks get water from illegal wells on the banks of the Yamuna River for {{convert|0.75|$/gal|$/m3|$=₹|disp=or|order=flip}} ({{convert|{{#expr: {{To USD|0.75|IND}}}}|$/gal|$/m3|abbr=on|disp=out|order=flip}} or {{convert|{{#expr: {{To USD|0.75|IND}} * 100}}|¢/gal|¢/gal|0|abbr=on|disp=out|order=flip}}).<ref>{{cite web |last1=Sethi |first1=Aman |date=2015 |title=At the Mercy of the Water Mafia, Foreign Policy, July/August 2015 |url=https://foreignpolicy.com/2015/07/17/at-the-mercy-of-the-water-mafia-india-delhi-tanker-gang-scarcity/ |access-date=11 October 2015 |website=[[Foreign Policy]]}}</ref> | ||
[[File:Home water filters, water purifiers, and bottled water in India.jpg|thumb|In India, Delhi has the highest usage of household water purifiers/filters.<ref>{{Cite web |last=Sharma |first=Harikishan |title=12% of urban India relies on bottled water, 1 in 4 homes has a purifier |url=https://indianexpress.com/article/india/12-of-urban-india-relies-on-bottled-water-1-in-4-homes-has-a-purifier-6142062/ |url-access=subscription |access-date=2023 | [[File:Home water filters, water purifiers, and bottled water in India.jpg|thumb|In India, Delhi has the highest usage of household water purifiers/filters.<ref>{{Cite web |last=Sharma |first=Harikishan |date=29 November 2019 |title=12% of urban India relies on bottled water, 1 in 4 homes has a purifier |url=https://indianexpress.com/article/india/12-of-urban-india-relies-on-bottled-water-1-in-4-homes-has-a-purifier-6142062/ |url-access=subscription |access-date=12 January 2023 |website=The Indian Express |language=en}}</ref> Basic gravity water filter, electric reverse osmosis and ultraviolet filters visible.<ref>{{Citation |title=Household Water Filter Evaluation Ahmedabad, India |date=2015 |work=Comprehensive Initiative on Technology Evaluation at the Massachusetts Institute of Technology}}</ref> Standard 20 L bottled water visible.]] | ||
The supply of cities that depend on surface water is threatened by pollution, increasing [[water scarcity]] and conflicts among users. For example, [[Bangalore]] depends to a large extent on water pumped since 1974 from the [[Kaveri]] river, whose waters are disputed between the states of Karnataka and Tamil Nadu. As in other Indian cities, the response to water scarcity is to transfer more water over large distances at high costs. In the case of Bangalore 500,000 | The supply of cities that depend on surface water is threatened by pollution, increasing [[water scarcity]] and conflicts among users. For example, [[Bangalore]] depends to a large extent on water pumped since 1974 from the [[Kaveri]] river, whose waters are disputed between the states of Karnataka and Tamil Nadu. As in other Indian cities, the response to water scarcity is to transfer more water over large distances at high costs. In the case of Bangalore, {{convert|500,000|m3}} of water is pumped per day over a distance of {{cvt|100|km}}, thus increasing the city's supply by two-thirds.<ref>{{Cite web |last=Rao |first=Lalitha |date=17 August 2009 |title=Stage-IV of Cauvery water supply scheme underway |url=http://www.projectsmonitor.com/NEWPROJECTS/stageiv-of-cauvery-water-supply-scheme-underway |url-status=dead |archive-url=https://web.archive.org/web/20110715123433/http://www.projectsmonitor.com/NEWPROJECTS/stageiv-of-cauvery-water-supply-scheme-underway |archive-date=15 July 2011 |website=Project Monitor}}</ref> | ||
[[Jamshedpur]] provided 25% of its residents with continuous water supply in 2009.<ref name=" | [[Jamshedpur]] provided 25% of its residents with continuous water supply in 2009.<ref name="Asian Development Bank 2010">{{Cite book |date=2010 |title=Every Drop Counts: Learning from Good Practices in Eight Asian Cities |url=https://www.adb.org/publications/every-drop-counts-learning-good-practices-eight-asian-cities |page=22 |publisher=Asian Development Bank |isbn=978-92-9092-030-4}}</ref> In 2021, some parts of Mumbai got 24 hour supply, others got 19 hours supply or less.<ref>{{Cite web |last=Singh |first=Laxman |date=5 March 2021 |title=Mumbai: BMC set to wind up project supplying 24-hr water to city |url=https://indianexpress.com/article/cities/mumbai/mumbai-bmc-set-to-wind-up-project-supplying-24-hr-water-to-city-7214717/ |url-access=subscription |access-date=5 January 2023 |website=The Indian Express |language=en}}</ref> [[Puri]] became the first city in India to get a piped 24 hour continuous drinking water quality water supply.<ref>{{Cite news |last=Wallen |first=Joe |date=17 August 2021 |title=How Puri became the first Indian city to provide clean drinking water for all |language=en-GB |work=The Telegraph |url=https://www.telegraph.co.uk/global-health/science-and-disease/puri-became-first-indian-city-provide-clean-drinking-water/ |access-date=5 January 2023 |issn=0307-1235}}</ref> [[Trivandrum]] is the largest Indian city and the only million agglomeration that enjoys uninterrupted hygienic water supply.<ref name="National Institute of Urban Affairs 2005" />{{Better source needed|reason=Above it says Puri was the first to get a drinkable 24*7 supply|date=January 2023}} Chennai has two [[desalination]] plants: the [[Nemmeli Seawater Desalination Plant|Nemmeli]] and [[Minjur Seawater Desalination Plant|Minjur]].<ref>{{Cite web |date=7 January 2010 |title=Chennai to get more desal after Nemmeli award |url=https://www.globalwaterintel.com/news/2010/1/chennai-to-get-more-desal-after-nemmeli-award |access-date=1 January 2023 |website=Global Water Intelligence}}</ref> | ||
=== Towns === | === Towns === | ||
[[Malkapur, Karad|Malkapur]] is the first Indian town to provide 24 | [[Malkapur, Karad|Malkapur]] is the first Indian town to provide 24/7 water supply with 100 per cent coverage. The programme started in 2008 as a pilot project and soon covered the entire city. The connection is 100 per cent metered with telescopic tariff.<ref>{{Cite web |title=Malkapur 24X7 Water Supply Scheme |url=https://darpg.gov.in/sites/default/files/40.%20Success%20Story%20of%20Malkapur%2024X7%20Water%20Supply%20System.pdf |publisher=Malkapur Nagarpanchayat, Maharashtra Jeevan Pradhikaran}}</ref> | ||
=== Rural === | === Rural === | ||
Kaapil has been successful in providing continuous piped water supply to all households.{{Citation needed}} | Kaapil has been successful in providing continuous piped water supply to all households.{{Citation needed|date=January 2023}} | ||
=== Other water sources === | === Other water sources === | ||
==== Rainwater harvesting ==== | ==== Rainwater harvesting ==== | ||
In the early 21st century, India began heavily investing in [[Rainwater harvesting#India|rainwater harvesting]] infrastructure and policy as an urgent response to water scarcity. <ref>{{Cite journal |editor-last=Kumar |editor-first=M. Dinesh |editor2-last=Ghosh |editor2-first=Shantanu |editor3-last=Patel |editor3-first=Ankit |editor4-last=Singh |editor4-first=Om Prakash |editor5-last=Ravindranath |editor5-first=R. |title=Rainwater harvesting in India: some critical issues for basin planning and research |url=https://ageconsearch.umn.edu/record/47964/ |journal=Land Use and Water Resources Research |doi=10.22004/ag.econ.47964}}</ref> In 2001, Tamil Nadu became the first Indian state to make rainwater harvesting compulsory in every building to avoid groundwater depletion. In Rajasthan, rainwater harvesting has traditionally been | In the early 21st century, India began heavily investing in [[Rainwater harvesting#India|rainwater harvesting]] infrastructure and policy as an urgent response to water scarcity.<ref>{{Cite journal |date=2006 |editor-last=Kumar |editor-first=M. Dinesh |editor2-last=Ghosh |editor2-first=Shantanu |editor3-last=Patel |editor3-first=Ankit |editor4-last=Singh |editor4-first=Om Prakash |editor5-last=Ravindranath |editor5-first=R. |title=Rainwater harvesting in India: some critical issues for basin planning and research |url=https://ageconsearch.umn.edu/record/47964/ |journal=Land Use and Water Resources Research |doi=10.22004/ag.econ.47964 |last1=Kumar |first1=M. Dinesh |last2=Ghosh |first2=Shantanu |last3=Patel |first3=Ankit |last4=Singh |first4=Om Prakash |last5=Ravindranath |first5=R. |last6=Kumar |first6=M. Dinesh |last7=Ghosh |first7=Shantanu |last8=Patel |first8=Ankit |last9=Singh |first9=Om Prakash |last10=Ravindranath |first10=R. }}</ref> In 2001, Tamil Nadu became the first Indian state to make rainwater harvesting compulsory in every building to avoid groundwater depletion. In Rajasthan, rainwater harvesting has traditionally been practised by the people of the Thar Desert. Increase in rainwater harvesting efforts across the nation have revived ancient water harvesting systems in Rajasthan, such as the chauka system from the Jaipur district. Other large cities like Pune, Mumbai and Bangalore all have varying rules for mandatory rainwater harvesting, especially in new buildings. In 2002, the Municipal Corporation of Greater Mumbai required all new buildings over {{convert|1000|m2}} to have rainwater harvesting infrastructure.<ref>{{Cite journal |last=Button |first=Cat |date=4 May 2017 |title=Domesticating water supplies through rainwater harvesting in Mumbai |url=https://eprint.ncl.ac.uk/fulltext.aspx?url=213795/E121A9CF-89E3-4B54-953E-129FBB1FF267.pdf&pub_id=213795 |journal=Gender & Development |volume=25 |issue=2 |pages=269–282 |doi=10.1080/13552074.2017.1339949 |s2cid=80471348 |issn=1355-2074}}</ref> The law was expanded in 2007 to {{convert|300|m2}}. The goal was to ensure buildings had enough water to last them through non-monsoon seasons. The process included a catchment system, an initial flush, and extensive filtering. As of 2021, the [[Brihanmumbai Municipal Corporation]] (BMC) reported 3000 newly constructed or redeveloped buildings with rainwater harvesting infrastructure.<ref>{{Cite journal |title=India Rainwater Harvesting Market, By Type (Rain Barrel System, Dry System, Wet System, Green Roof System), By Harvesting Method (Above Ground {Ground Surface and Storage Tank}, Under Ground), By Application (Residential, Commercial, Industrial and Agricultural), By Region, By Competition Forecast & Opportunities, 2018–2028 |url=https://www.techsciresearch.com/report/india-rainwater-harvesting-market/14736.html |journal=TechSci Research}}</ref> However, many residents have complained that the stored water is contaminated, turning saline and brackish. Experts and residents argue that BMC authorities have done little to take implementation seriously, and the actual effectiveness of the rainwater harvesting mandate is unknown.<ref>{{Cite web |last=Johari |first=Aarefa |title=Mumbai could save water through its mandatory rainwater harvesting rule – but no one seems to care |url=https://scroll.in/article/929966/mumbai-could-save-water-through-its-mandatory-rainwater-harvesting-rule-but-no-one-seems-to-care |access-date=12 May 2023 |website=Scroll.in |date=17 July 2019 |language=en-US}}</ref> | ||
While rainwater harvesting in an urban context has gained traction in recent years, evidence points toward rainwater harvesting in rural India since ancient times. <ref name=" | While rainwater harvesting in an urban context has gained traction in recent years, evidence points toward rainwater harvesting in rural India since ancient times.<ref name="Pandey 2003">{{Cite journal |last1=Pandey |first1=Deep Narayan |last2=Gupta |first2=Anil K. |last3=Anderson |first3=David M. |date=2003 |title=Rainwater harvesting as an adaptation to climate change |url=https://www.jstor.org/stable/24107712 |journal=Current Science |volume=85 |issue=1 |pages=46–59 |jstor=24107712 |issn=0011-3891}}</ref> The type of system varied depending on the geography and culture of the region. Himachal Pradesh, for example, relied on ''kuhls'',<ref>{{Cite web |title=Kuhl, kohli and a lost tradition |url=https://www.indiawaterportal.org/articles/kuhl-kohli-and-lost-tradition |access-date=10 May 2023 |website=India Water Portal Hindi}}</ref> a community-owned rainwater irrigation system. Maharashtra predominately used ''bhandara phads'', a [[check dam]] which lowers the velocity of flow from rivers and reduces erosion. On the onset of British rule in the early 19th century, many of these systems were abandoned.<ref>{{Cite web |title=Rainwater harvesting in India: Traditional and contemporary |url=https://www.indiawaterportal.org/articles/rainwater-harvesting-india-traditional-and-contemporary |access-date=10 May 2023 |website=India Water Portal Hindi}}</ref> Environmentalists and scholars now believe that agricultural communities should revive ancient techniques to allow for rainwater harvesting to source the water needs of the community.<ref name="Pandey 2003" /> | ||
== Sanitation == | == Sanitation == | ||
{{See also|List of countries by proportion of the population using improved sanitation facilities}} | |||
[[File:People-practicing-open-defecation-of-population (1).png|center|thumb|350x350px|This chart depicts the decrease in open defecation from 2000 to 2022 in countries sharing a land border with India. According to the [[World Health Organization|WHO]]/[[UNICEF]] [[Joint Monitoring Programme for Water Supply and Sanitation|Joint Monitoring Programme (JMP)]], as reported by [[Our World in Data]], the number of people practising open defecation fell from 62% to 33% from 2004 - 2014. About 157 million (15.7 crore), or approximately 11% of India’s population, still practised [[open defecation]] in 2022.<ref>{{Cite web |title=JMP |url=https://washdata.org/data/household#!/ind |url-status=live |archive-url=https://web.archive.org/web/20240911000000/https://washdata.org/data/household#!/ind |archive-date=2024-09-11 |access-date=2024-09-11 |website=washdata.org}} [https://data.worldbank.org/indicator/SH.STA.ODFC.ZS?locations=IN Alt URL]</ref><ref>{{Cite web |title=Share of people practicing open defecation |url=https://ourworldindata.org/grapher/people-practicing-open-defecation-of-population?tab=chart&country=MMR~BGD~IND~OWID_WRL~CHN~PAK~BTN~NPL~AFG~High-income+countries~Least+Developed+Countries~Low-income+countries~Lower-middle-income+countries |access-date=2024-08-16 |website=Our World in Data}}</ref><ref>{{Cite web |last=HARUNA KASHIWASE |date=17 November 2023 |title=World Toilet Day: 420 million people are defecating outdoors |url=https://blogs.worldbank.org/en/opendata/world-toilet-day-420-million-people-are-defecating-outdoors |access-date=21 August 2024 |website=blogs.worldbank.org}}</ref>]] | |||
A formal sanitation programme was first launched in 1954, followed by Central Rural Sanitation Programme in 1986, Total Sanitation Campaign (TSC) in 1999, Nirmal Bharat Abhiyan in 2012 and Swachh Bharat Mission in 2014. | |||
In 2020, according to the [[World Bank]] data 72% Indians, 68% Pakistanis, and 54% Bangladeshi have access to the basic sanitation facilities.<ref>{{Cite web|title=People using at least basic sanitation services (% of population) {{!}} Data|url=https://data.worldbank.org/indicator/SH.STA.BASS.ZS|access-date=8 May 2022|website=data.worldbank.org}}</ref> In 2015, 44% had access to basic sanitation, or 65% in urban areas and 34% in rural areas.<ref>{{Cite web |title=India |url=https://washwatch.org/en/countries/india/summary/statistics/ |url-status=deviated |archive-url=https://web.archive.org/web/20161113120952/https://washwatch.org/en/countries/india/summary/statistics/ |archive-date=13 November 2016 |access-date=12 April 2017 |website=WASHwatch.org |language=en}}</ref><ref name="NITI Aayog 2017" /> In 2017, at least [[Improved sanitation|basic sanitation]] increased to 59.5%. Between 2014 and 2019, the Government in India has built around 110 million toilets, all across India, due to which the basic sanitation coverage went up from 38.7% in October 2014 to 93.3% in 2019.<ref>{{Cite web |title=Data Warehouse |url=https://data.unicef.org/resources/data_explorer/unicef_f/?ag=UNICEF&df=GLOBAL_DATAFLOW&ver=1.0&dq=.WS_PPL_S-ALB..&startPeriod=2014&endPeriod=2019 |website=UNICEF Data}}</ref><ref>{{Cite web |last1=Regan |first1=Helen |last2=Suri |first2=Manveena |date=6 October 2019 |title=Half of India couldn't access a toilet 5 years ago. Modi built 110M latrines – but will people use them? |url=https://www.cnn.com/2019/10/05/asia/india-modi-open-defecation-free-intl-hnk-scli/index.html |access-date=1 January 2023 |website=CNN |language=en}}</ref><ref>{{Cite web |title=Dashboard. Swachh Bharat Mission (Grameen) 2.0 |url=https://sbm.gov.in/sbmgdashboard/statesdashboard.aspx |access-date=18 February 2019 |website=Swachh Bharat Mission – Gramin |publisher=Ministry of Jal Shakti}}</ref> | |||
For years, most Indians depended on on-site sanitation facilities which means mainly [[pit latrine]]s in rural areas. The government has been investing heavily in building sanitation units, in a nation-wide campaign called the Swachh Bharat Mission. Between 2014 and 2020, the Indian government managed to make household toilets accessible to over 99% of the population.<ref>{{cite web |author=McCarthy |first=Niall |date=19 November 2020 |title=India's Toilet-Building Revolution |url=http://www.statista.com/chart/14924/indias-toilet-building-revolution/ |access-date=17 December 2020 |publisher=Statista}}</ref> This translates to a total of 110 million toilets build since 2014, according to Statista. Preceding this success is the success of the Slum Sanitation Programme in Mumbai that has provided access to sanitation for a quarter million slum dwellers.<ref>{{cite web |date=2006 |title=Water Supply & Sanitation – Reaching the Poor Through Sustainable Partnerships: The Slum Sanitation Program in Mumbai, India<!-- Bot generated title --> |url=https://documents.worldbank.org/en/publication/documents-reports/documentdetail/380341468258301005/reaching-the-poor-through-sustainable-partnerships-the-slum-sanitation-program-in-mumbai-india |access-date=29 July 2015 |website=World Bank}}</ref><ref>{{Cite web |last=Jacobson |first=Mark |date=2007 |title=Mumbai Slum: Dharavi |url=http://www7.nationalgeographic.com/ngm/0705/feature3/text3.html |url-status=dead |archive-url=https://web.archive.org/web/20070505084934/http://www7.nationalgeographic.com/ngm/0705/feature3/text3.html |archive-date=5 May 2007 |website=National Geographic}}</ref> Sewage, where available, is often in a bad state. In Delhi the sewage network has lacked maintenance over the years and overflow of raw [[sewage]] in open drains is common, due to blockage, settlements and inadequate pumping capacities.<ref name="creaking" /> The capacity of the 17 existing [[wastewater treatment plants]] in Delhi is adequate to cater a daily production of waste water of less than 50% of the drinking water produced.<ref name="World Bank" /> Of the 892 million people in the world that [[open defecation|defecate openly]], some 15 million live in India, making it the country with the highest number of people who defecate in the open.<ref>{{cite web |author=Sharma |first=Betwa |date=15 October 2009 |title=665 million Indians still defecate in open: UN |url=http://news.rediff.com/report/2009/oct/15/in-india-665-million-defecate-in-open-un.htm |access-date=19 September 2010 |publisher=Rediff News}}</ref> This has serious public health implications.{{Citation needed|date=January 2023}} | |||
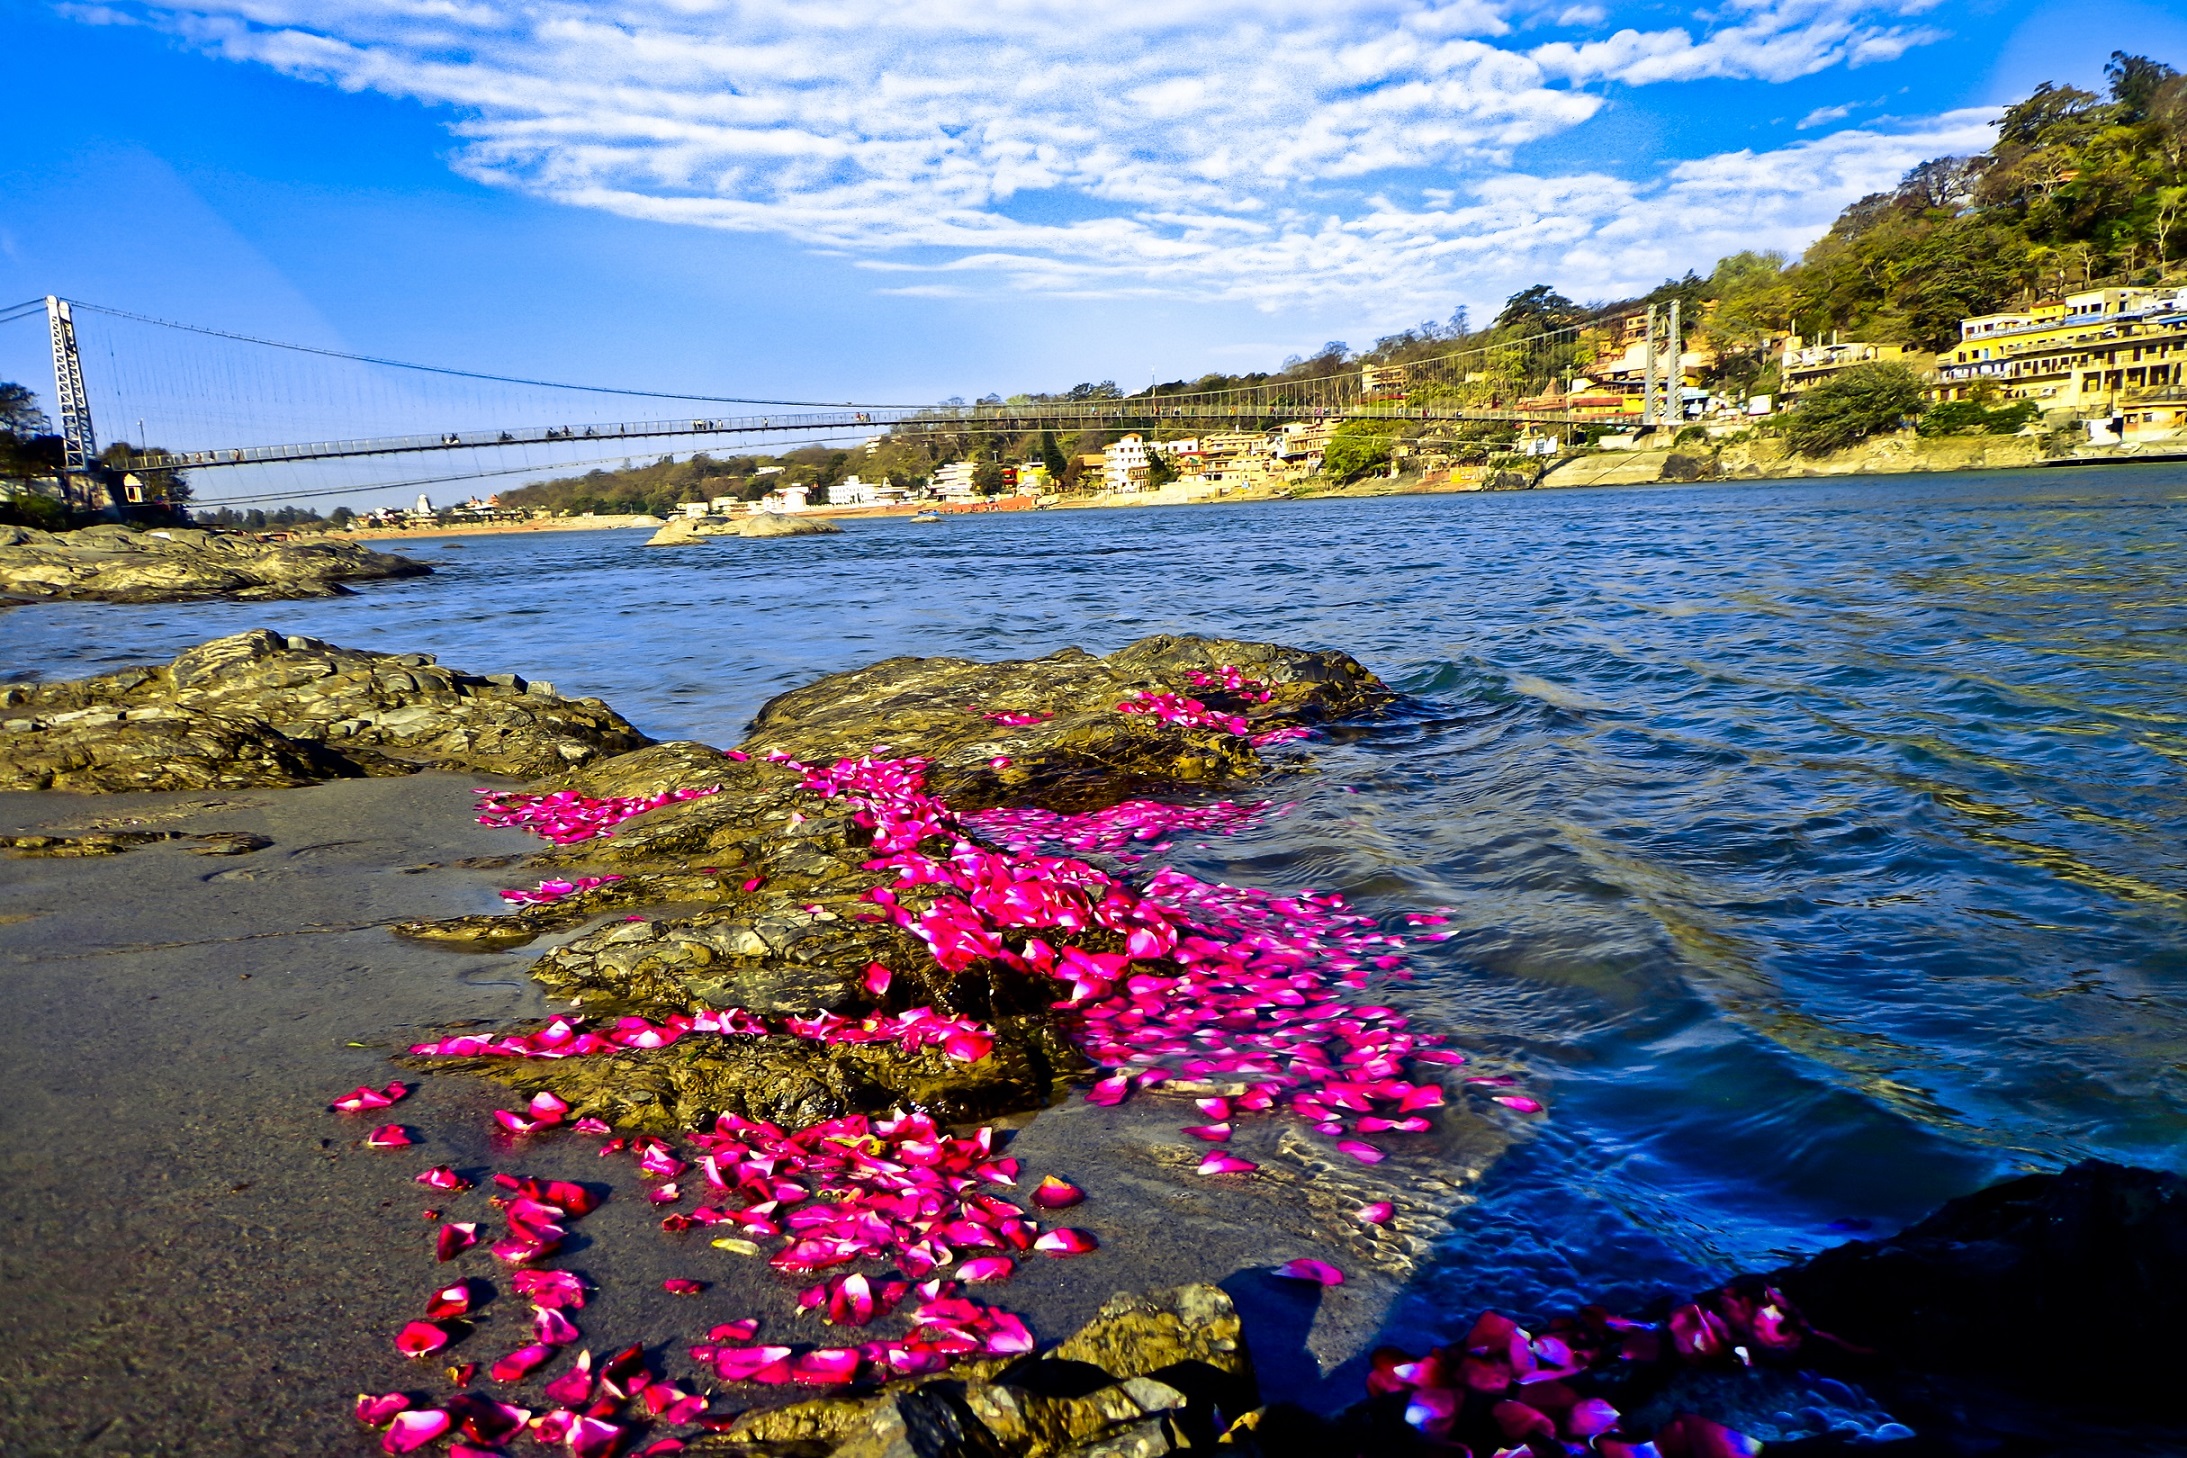
A specific Indian problem is also the (officially prohibited) "[[manual scavenging]]" which is connected to the officially banned [[caste system]],<ref>{{Cite web |last=Hobson |first=Kevin |title=Indian Caste System and The British |url=https://www.infinityfoundation.com/mandala/h_es/h_es_hobso_caste_frameset.htm |access-date=18 February 2019 |website=InfinityFoundation.com}}</ref><ref>{{cite web |last=Singh |first=Sahana |date=5 May 2016 |title=Why is the world so obsessed with India's caste system? |url=http://indiafacts.org/why-is-the-world-so-obsessed-with-indias-caste-system |website=India Facts}}</ref> and relates to unsafe and undignified emptying of toilets and pits, as well as handling of raw, untreated [[human waste|human excreta]].[[File:Holiness of Ganga.jpg|alt=|thumb|Millions depend on the [[Ganges river|Ganga river]] ]] | |||
As of 2003, it was estimated, that only 27% of India's [[wastewater]] was being treated, with the remainder flowing into rivers, canals, groundwater or the sea.<ref name="Panse 2006" /><ref>{{Cite web |last=Wallace |first=Bruce |date=6 September 2007 |title=The World – Drawing a curtain on old ways – In India, a villager uses his own strategy in a campaign to encourage the use of toilets instead of the great outdoors. |url=http://www.latimes.com/news/nationworld/world/la-fg-toilet6sep06,0,2934595,full.story?coll=la-home-center |url-status=dead |archive-url=https://archive.today/20090505110554/http://www.latimes.com/news/nationworld/world/la-fg-toilet6sep06,0,2934595,full.story |archive-date=5 May 2009 |website=Los Angeles Times}}</ref> For example, the sacred [[Ganges]] river is infested with diseases and in some places "the Ganges becomes black and septic. Corpses, of semi-cremated adults or enshrouded babies, drift slowly by."<ref name="creaking">{{cite news |date=13 December 2008 |title=Special report : Creaking, groaning: Infrastructure is India's biggest handicap |newspaper=The Economist |url=http://www.economist.com/specialreports/displaystory.cfm?story_id=12749787 |url-access=subscription}}</ref> In 2008, NewsWeek described Delhi's sacred [[Yamuna River]] as "a putrid ribbon of black sludge" where the concentration of fecal bacteria is 10,000 times the recommended safe maximum despite a 15-year programme to address the problem.<ref name="Overdorf 2008">{{Cite web |last=Overdorf |first=Jason |date=28 June 2008 |title=India: An Environmental Mess |url=https://www.newsweek.com/india-environmental-mess-91207 |access-date=1 January 2023 |website=Newsweek}}</ref> [[Cholera]] epidemics are not unknown.<ref name="Overdorf 2008" /> | |||
[[File:Crossing the street in Mathura.jpg|thumb|A street in [[Mathura]] overflowing with sewage and garbage in 2011]] | |||
=== East Kolkata wetlands === | |||
In 2018, [[The Hindu]] reported that the [[East Kolkata wetlands]], the world's largest biological [[sewage treatment]] facility, had been used to clean the sewage of Kolkata for several decades through the use of algae. This natural system, in use since the 1930s, was discovered by [[Dhrubajyoti Ghosh]], an ecologist and municipal engineer in the 1970s, while he was working in the region.<ref>{{cite news |last1=Ghatak |first1=Aditi Roy |date=17 February 2018 |title=The wetlands will weep today |url=https://www.thestatesman.com/opinion/wetlands-will-weep-today-1502586927.html |url-status=live |archive-url=https://web.archive.org/web/20180308105011/https://www.thestatesman.com/opinion/wetlands-will-weep-today-1502586927.html |archive-date=8 March 2018 |access-date=23 March 2018 |publisher=The Statesman}}</ref> Ghosh worked for decades to protect the wetlands.<ref>{{cite web |last1=Ghosh |first1=Dhrubajyoti |title=The Calcutta Wetlands: turning bad water into good |url=http://dhrubajyoti.net/publ/Dr.%20Ghosh_changemaker.pdf |url-status=live |archive-url=https://web.archive.org/web/20170113145208/http://dhrubajyoti.net/publ/Dr.%20Ghosh_changemaker.pdf |archive-date=13 January 2017 |access-date=8 March 2018 |website=www.dhrubajyoti.net |publisher=Changemakers (issue October 2008)}}</ref> It had been a practice in [[Kolkata]], one of the five largest cities in [[India]], for the municipal authorities to pump sewage into shallow ponds (''bheris'').<ref>{{cite book |last1=Ghosh |first1=Dhrubajyoti |url=http://dhrubajyoti.net/Final%20Ecosystem%20Book.pdf |title=Ecosystem management – towards merging theory and practice |date=2 October 2014 |publisher=Nimby books |isbn=9788190657044 |location=New delhi |access-date=8 March 2018 |archive-url=https://web.archive.org/web/20190624111735/http://dhrubajyoti.net/Final%20Ecosystem%20Book.pdf |archive-date=24 June 2019 |url-status=live}}</ref> Under the heat of the tropical sun, algae proliferated in these ''bheris'', converting the sewage into clean water, which in turn was used by villagers to grow [[Rice#Harvesting, drying and milling|paddy]] and vegetables. This almost 100-year-old system treats 750 million litres of [[wastewater]] per day, providing livelihoods for 100,000 people in the vicinity.<ref>{{cite news |last1=Aseem |first1=Shrivastava |date=8 March 2018 |title=The ecologically subsidised city: on Kolkata's wetland communities |url=http://www.thehindu.com/opinion/op-ed/the-ecologically-subsidised-city/article22970933.ece |url-status=live |archive-url=https://web.archive.org/web/20211123175547/https://www.thehindu.com/opinion/op-ed/the-ecologically-subsidised-city/article22970933.ece |archive-date=23 November 2021 |access-date=23 March 2018 |newspaper=The Hindu}}</ref> For his work, Ghosh was included in the UN Global 500 Roll of Honour in 1990 and received the [[Luc Hoffmann]] award in 2016.<ref>{{cite web |title=Global 500 environmental forum |url=http://www.global500.org/index.php/year/1990?start=100 |url-status=live |archive-url=https://web.archive.org/web/20180308231603/http://www.global500.org/index.php/year/1990?start=100 |archive-date=8 March 2018 |access-date=8 March 2018 |website=www.global500.org |publisher=United Nations}}</ref> | |||
== Health impact == | == Health impact == | ||
{{ | {{See also|Health in India#Health Issues}} | ||
The lack of adequate sanitation and safe water has significant negative health impacts including diarrhoea, referred to by travellers as the ''Delhi Belly'' ([[Travelers' diarrhea]]),<ref>{{cite web |author=Cunha |first=John P. |editor-last=Shiel Jr. |editor-first=William C. |editor2-last=Davis |editor2-first=Charles Patrick |title=Travelers' Diarrhea: Learn About Antibiotics and Treatment |url=http://www.medicinenet.com/travelers_diarrhea/article.htm |access-date=29 July 2015 |work=MedicineNet}}</ref> and experienced by about 10 million visitors annually.<ref>{{cite web |last=Chopp |first=Chris |title= | The lack of adequate sanitation and safe water has significant negative health impacts including diarrhoea, referred to by travellers as the ''Delhi Belly'' ([[Travelers' diarrhea]]),<ref>{{cite web |author=Cunha |first=John P. |editor-last=Shiel Jr. |editor-first=William C. |editor2-last=Davis |editor2-first=Charles Patrick |title=Travelers' Diarrhea: Learn About Antibiotics and Treatment |url=http://www.medicinenet.com/travelers_diarrhea/article.htm |access-date=29 July 2015 |work=MedicineNet}}</ref> and experienced by about 10 million visitors annually.<ref>{{cite web |last=Chopp |first=Chris |date=18 January 2010 |title=10 Ways to Avoid Traveler’s Diarrhea in India|url=http://www.fullstopindia.com/2010/01/10-ways-to-avoid-travelers-diarrhea-in-india/ |url-status=usurped |archive-url=https://web.archive.org/web/20110220145529/http://www.fullstopindia.com/2010/01/10-ways-to-avoid-travelers-diarrhea-in-india/ |archive-date=20 February 2011 |access-date=30 March 2011 |website=FullStopIndia.com }}</ref> The dismal working conditions of sewer workers are another concern. A survey of the working conditions of sewage workers in Delhi showed that most of them suffer from chronic diseases, respiratory problems, skin disorders, allergies, headaches and eye infections.<ref>{{Cite news |last=Jha |first=Rupa |date=7 February 2009 |title='My life cleaning Delhi's sewers' |language=en-GB |work=BBC |url=https://news.bbc.co.uk/2/hi/programmes/from_our_own_correspondent/7872770.stm |access-date=1 January 2023}}</ref> Various other cities in India have a record of unsafe drinking water. Municipal water in Visakhapatnam is contaminated with too much chlorine and pharmaceuticals which cause headache, short-term memory loss and loss of focus.{{Citation needed|date=January 2023}} | ||
== Responsibility for water supply and sanitation == | == Responsibility for water supply and sanitation == | ||
According to the Indian Constitution, legislating regarding matters related to provision of drinking water supply and sanitation is responsibility of the [[States of India|State]] governments as it falls in the [[State List|state list]] included in its seventh schedule. The 73rd and the 74th Amendment to the constitution required the state governments to devolve provision of drinking water and sanitation services to the [[Panchayati Raj]] Institutions (PRI) in rural areas or municipalities in urban areas, called [[Urban Local Bodies]] (ULB). At present, the arrangements for provision of these services vary. In some states, parastatal agencies are involved in provision of either of the two services or both. Further, within states, different arrangements are also observed for rural and urban areas. For example, in urban and rural areas of Kerala, drinking water is supplied by the [[Kerala Water Authority]] | According to the Indian Constitution, legislating regarding matters related to provision of drinking water supply and sanitation is responsibility of the [[States of India|State]] governments as it falls in the [[State List|state list]] included in its seventh schedule. The 73rd and the 74th Amendment to the constitution required the state governments to devolve provision of drinking water and sanitation services to the [[Panchayati Raj]] Institutions (PRI) in rural areas or municipalities in urban areas, called [[Urban Local Bodies]] (ULB). At present, the arrangements for provision of these services vary. In some states, parastatal agencies are involved in provision of either of the two services or both. Further, within states, different arrangements are also observed for rural and urban areas. For example, in urban and rural areas of Kerala, drinking water is supplied by the [[Kerala Water Authority]] a parastatal agency. In Maharashtra on the other hand, ULBs provide drinking water supply in most urban areas, but [https://mjp.maharashtra.gov.in/en Maharashtra Jeevan Pradhikaran] provides drinking water in most rural areas and a few urban areas as well.{{citation needed|date=October 2023}} | ||
Highly centralised decision-making and approvals at the state level, which are characteristic of the Indian civil service, affect the management of water supply and sanitation services. For example, according to the World Bank in the state of Punjab the process of approving designs is centralised with even minor technical approvals reaching the office of chief engineers. A majority of decisions are made in a very centralised manner at the headquarters.<ref name="World Bank Punjab 2006, Annex 1">World Bank:[http://www-wds.worldbank.org/external/default/WDSContentServer/WDSP/IB/2006/11/27/000020953_20061127111653/Rendered/INDEX/37377.txt Punjab Rural Water Supply and Sanitation Project, Project Appraisal Document ], 2006, Annex 1</ref> In 1993 the Indian constitution and relevant state legislations were amended in order to decentralise certain responsibilities, including water supply and sanitation, to municipalities. Since the assignment of responsibilities to municipalities is a state responsibility, different states have followed different approaches. According to a Planning Commission report of 2003 there is a trend to decentralise capital investment to engineering departments at the [[Districts of India|district]] level and operation and maintenance to district and gram panchayat levels.<ref>{{Cite web | Highly centralised decision-making and approvals at the state level, which are characteristic of the Indian civil service, affect the management of water supply and sanitation services. For example, according to the World Bank in the state of Punjab the process of approving designs is centralised with even minor technical approvals reaching the office of chief engineers. A majority of decisions are made in a very centralised manner at the headquarters.<ref name="World Bank Punjab 2006, Annex 1">World Bank:[http://www-wds.worldbank.org/external/default/WDSContentServer/WDSP/IB/2006/11/27/000020953_20061127111653/Rendered/INDEX/37377.txt Punjab Rural Water Supply and Sanitation Project, Project Appraisal Document ], 2006, Annex 1</ref> In 1993 the Indian constitution and relevant state legislations were amended in order to decentralise certain responsibilities, including water supply and sanitation, to municipalities. Since the assignment of responsibilities to municipalities is a state responsibility, different states have followed different approaches. According to a Planning Commission report of 2003 there is a trend to decentralise capital investment to engineering departments at the [[Districts of India|district]] level and operation and maintenance to district and gram panchayat levels.<ref>{{Cite web |title=India Assessment 2002. Water Supply and Sanitation |url=http://planningcommission.nic.in/reports/genrep/wtrsani.pdf |url-status=dead |archive-url=https://web.archive.org/web/20060106004412/http://planningcommission.nic.in/reports/genrep/wtrsani.pdf |archive-date=6 January 2006 |publisher=Planning Commission, Government of India |pages=23–26}}</ref> | ||
=== Policy and regulation === | === Policy and regulation === | ||
The responsibility for water supply and sanitation at the central and state level is shared by various Ministries. At the central level three Ministries have responsibilities in the sector: the Ministry of Drinking Water and Sanitation (until 2011 the Department of Drinking Water Supply in the Ministry of Rural Development) is responsible for rural water supply and sanitation; the [[Ministry of Housing and Urban Poverty Alleviation (India)|Ministry of Housing and Urban Poverty Alleviation]] and the Ministry of Urban Development share the responsibility for urban water supply and sanitation. Except for the National Capital Territory of Delhi and other Union Territories, the central Ministries only have an advisory capacity and a limited role in funding. Sector policy thus is a prerogative of state governments. | The responsibility for water supply and sanitation at the central and state level is shared by various Ministries. At the central level three Ministries have responsibilities in the sector: the Ministry of Drinking Water and Sanitation (until 2011 the Department of Drinking Water Supply in the Ministry of Rural Development) is responsible for rural water supply and sanitation; the [[Ministry of Housing and Urban Poverty Alleviation (India)|Ministry of Housing and Urban Poverty Alleviation]] and the Ministry of Urban Development share the responsibility for urban water supply and sanitation. Except for the National Capital Territory of Delhi and other Union Territories, the central Ministries only have an advisory capacity and a limited role in funding. Sector policy thus is a prerogative of state governments.{{citation needed|date=October 2023}} | ||
'''National Urban Sanitation Policy'''. In November 2008 the government of India launched a national urban sanitation policy with the goal of creating what it calls "totally | '''National Urban Sanitation Policy'''. In November 2008 the government of India launched a national urban sanitation policy with the goal of creating what it calls "totally sanitised cities" that are open-defecation free, safely collect and treat all their wastewater, eliminate [[manual scavenging]] and collect and dispose solid waste safely. As of 2010, 12 states were in the process of elaborating or had completed state sanitation strategies on the basis of the policy. 120 cities are in the process of preparing city sanitation plans. Furthermore, 436 cities rated themselves in terms of their achievements and processes concerning sanitation in an effort supported by the Ministry of Urban Development with the assistance of several donors. About 40% of the cities were in the "red category" (in need of immediate remedial action), more than 50% were in the "black category" (needing considerable improvement) and only a handful of cities were in the "blue category" (recovering). Not a single city was included in the "green category" (healthy and clean city). The rating serves as a baseline to measure improvements in the future and to prioritise actions. The government intends to award a prize called Nirmal Shahar Puraskar to the best sanitation performers.<ref>{{cite web |year=2010 |title=New Sanitation Award Creates Healthy Competition Among Indian Cities |url=http://www.wsp.org/wsp/node/1040 |access-date=21 August 2012 |website=Water and Sanitation Program, World Bank}}</ref> | ||
====Wastewater treatment ==== | ==== Wastewater treatment ==== | ||
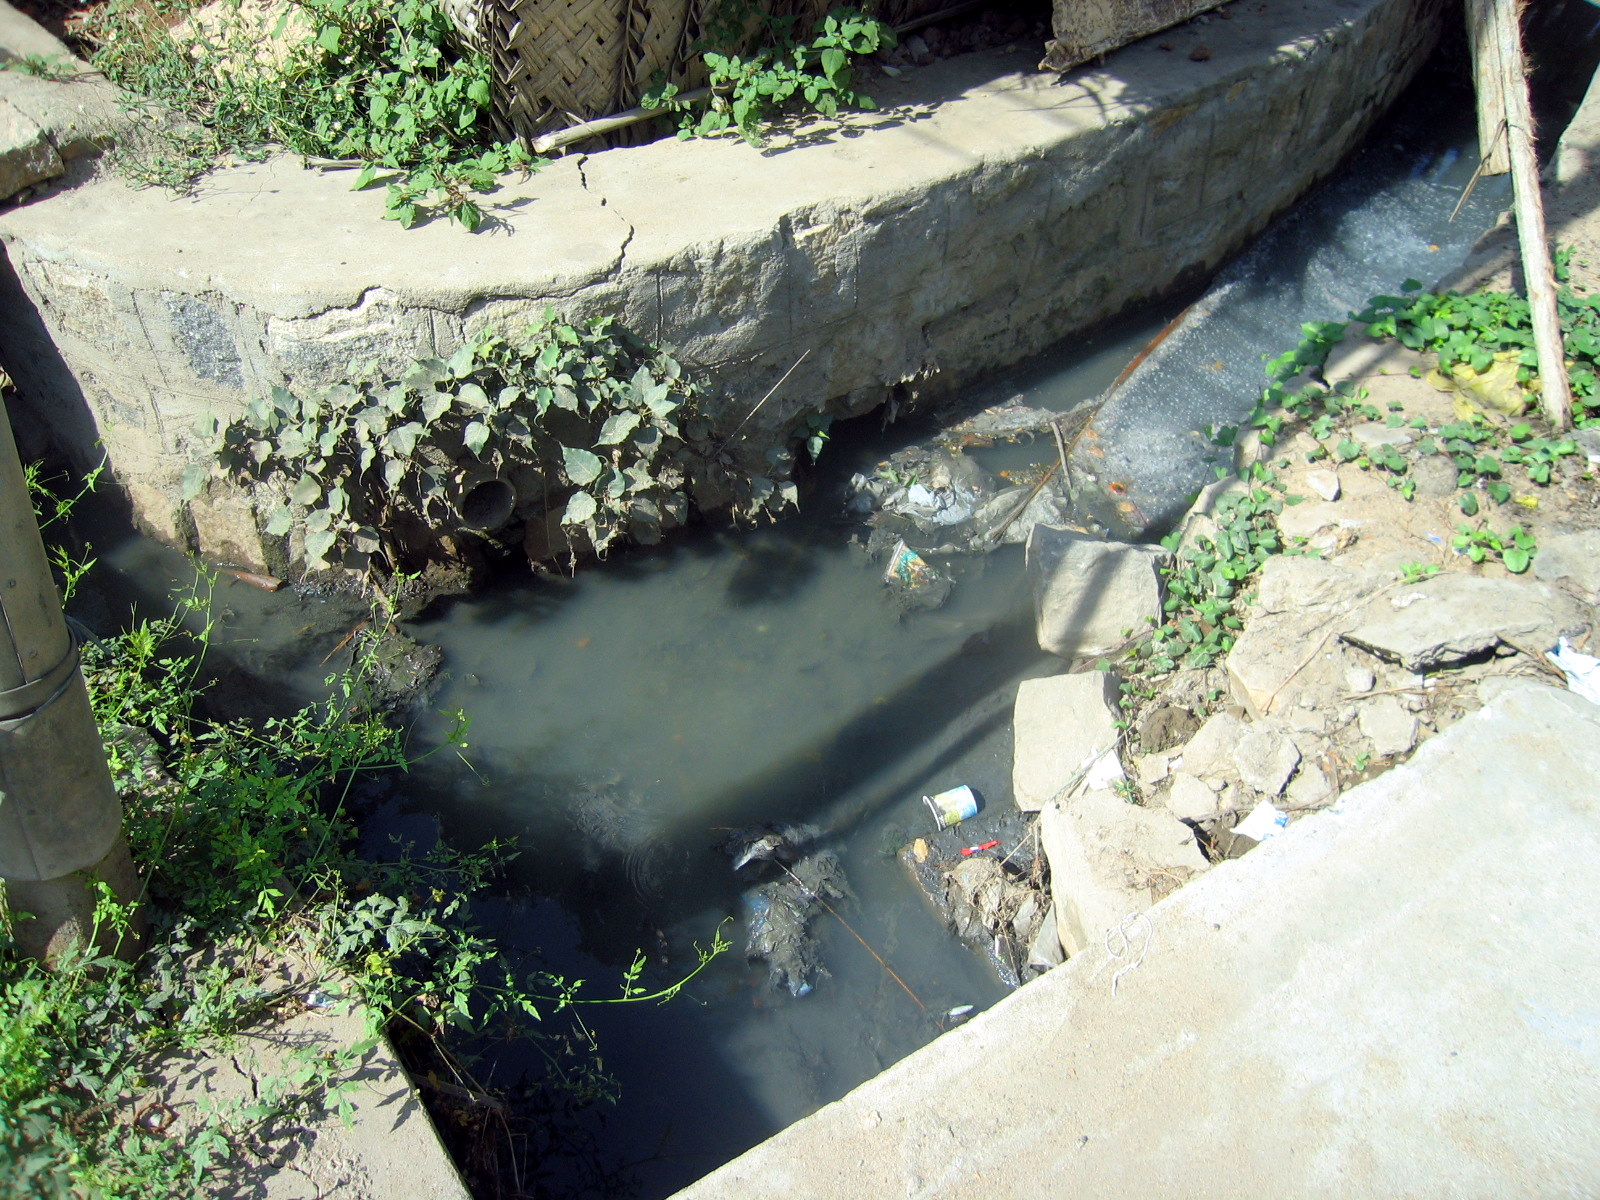
[[File:Wastewater stream.jpg|thumb|Picture of a wastewater stream]] | [[File:Wastewater stream.jpg|thumb|Picture of a wastewater stream]] | ||
In India, wastewater treatment regulations come under three central institutions, the ministries of forest, climate change housing, urban affairs and water.<ref>{{Cite journal|last1=Schellenberg|first1=Tatjana|last2=Subramanian|first2=Vrishali|last3=Ganeshan|first3=Ganapathy|last4=Tompkins|first4=David|last5=Pradeep|first5=Rohini|title=Wastewater Discharge Standards in the Evolving Context of Urban Sustainability–The Case of India|journal=Frontiers in Environmental Science|language=en|volume=8|doi=10.3389/fenvs.2020.00030|s2cid=215790363|issn=2296-665X|doi-access=free}}</ref> The various water and sanitation policies such as the "National Environment Policy 2006" and "National Sanitation Policy 2008" also lay down wastewater treatment regulations. State governments and local municipalities hold responsibility for the disposal of sewage and construction and maintenance of "sewerage infrastructure". Their efforts are supported by schemes offered by the Government of India, such as the National River Conservation Plan, Jawaharlal Nehru National Urban Renewal Mission, National Lake Conservation Plan. Through the Ministry of Environment and Forest, India's government also has set up incentives that encourage industries to establish "common facilities" to undertake the treatment of wastewater.<ref>{{Cite web|last1=Kaur|first1=R|last2=Wani|first2=SP|last3=Singh|first3=AK|editor4-last=Lal|editor4-first=K|title=Wastewater production, treatment and use in India|url=https://www.ais.unwater.org/ais/pluginfile.php/356/mod_page/content/128/CountryReport_India.pdf|access-date=2020 | In India, wastewater treatment regulations come under three central institutions, the ministries of forest, climate change housing, urban affairs and water.<ref>{{Cite journal|last1=Schellenberg|first1=Tatjana|last2=Subramanian|first2=Vrishali|last3=Ganeshan|first3=Ganapathy|last4=Tompkins|first4=David|last5=Pradeep|first5=Rohini|date=2020|title=Wastewater Discharge Standards in the Evolving Context of Urban Sustainability–The Case of India|journal=Frontiers in Environmental Science|language=en|volume=8|doi=10.3389/fenvs.2020.00030|s2cid=215790363|issn=2296-665X|doi-access=free}}</ref> The various water and sanitation policies such as the "National Environment Policy 2006" and "National Sanitation Policy 2008" also lay down wastewater treatment regulations. State governments and local municipalities hold responsibility for the disposal of sewage and construction and maintenance of "sewerage infrastructure". Their efforts are supported by schemes offered by the Government of India, such as the National River Conservation Plan, Jawaharlal Nehru National Urban Renewal Mission, National Lake Conservation Plan. Through the Ministry of Environment and Forest, India's government also has set up incentives that encourage industries to establish "common facilities" to undertake the treatment of wastewater.<ref>{{Cite web|last1=Kaur|first1=R|last2=Wani|first2=SP|last3=Singh|first3=AK|editor4-last=Lal|editor4-first=K|title=Wastewater production, treatment and use in India|url=https://www.ais.unwater.org/ais/pluginfile.php/356/mod_page/content/128/CountryReport_India.pdf|access-date=17 November 2020|website=AIS}}</ref> | ||
Recent initiatives include the 'National Water Policy 2012' that promotes efficient use and water management, recycling and reuse of wastewater, water supply and sanitation, and efficient water pricing.<ref>{{Cite web | Recent initiatives include the 'National Water Policy 2012' that promotes efficient use and water management, recycling and reuse of wastewater, water supply and sanitation, and efficient water pricing.<ref>{{Cite web |title=National Water Policy (2012) |url=http://mowr.gov.in/sites/default/files/NWP2012Eng6495132651_1.pdf |url-status=dead |archive-url=https://web.archive.org/web/20180712102455/http://mowr.gov.in/sites/default/files/NWP2012Eng6495132651_1.pdf |archive-date=12 July 2018 |access-date=15 November 2020 |website=Ministry of Water Resources, Government of India}}</ref> | ||
=== Service provision === | === Service provision === | ||
'''Urban areas'''. Institutional arrangements for water supply and sanitation in Indian cities vary greatly. Typically, a state-level agency is in charge of planning and investment, while the local government ([[Urban Local Bodies]]) is in charge of operation and maintenance.<ref name=" | '''Urban areas'''. Institutional arrangements for water supply and sanitation in Indian cities vary greatly. Typically, a state-level agency is in charge of planning and investment, while the local government ([[Urban Local Bodies]]) is in charge of operation and maintenance.<ref name="National Institute of Urban Affairs 2005" /> Some of the largest cities have created municipal water and sanitation utilities that are legally and financially separated from the local government. However, these utilities remain weak in terms of financial capacity. In spite of decentralisation, ULBs remain dependent on capital subsidies from state governments. Tariffs are also set by state governments, which often even subsidise operating costs.<ref>{{Cite web |url=http://planningcommission.nic.in/plans/planrel/fiveyr/10th/volume2/v2_ch6_1.pdf |title=10th Plan, p. 613 |access-date=11 June 2007 |archive-date=21 August 2007 |archive-url=https://web.archive.org/web/20070821113757/http://planningcommission.nic.in/plans/planrel/fiveyr/10th/volume2/v2_ch6_1.pdf |url-status=dead }}</ref> Furthermore, when no separate utility exists, there is no separation of accounts for different activities within a municipality. Some states and cities have non-typical institutional arrangements. For example, in [[Rajasthan]] the sector is more centralised and the state government is also in charge of operation and maintenance, while in [[Mumbai]] the sector is more decentralised and local government is also in charge of planning and investment.<ref name="National Institute of Urban Affairs 2005" /> In 2012 the Delhi Jal Board contracted out operations and management in three zones of the city to private companies under performance-based contracts to reduce non-revenue water. The Vasant Vihar-Mehrauli zone is operated by SMPL Infrastructure of India, Malviya Nagar by [[Suez Environnement]] and the Nangloi zone by Veolia Environnement.<ref name="GWI Delhi">{{cite web|title=Delhi Jal Board focuses on its finances|url=http://www.globalwaterintel.com/archive/14/10/general/delhi-jal-board-focuses-its-finances.html|publisher=Global Water Intelligence|access-date=27 December 2013|date=October 2013}}</ref> | ||
'''Private sector participation.''' The private sector plays a limited, albeit recently increasing role in operating and maintaining urban water systems on behalf of ULBs. For example, the Jamshedpur Utilities & Services Company (Jusco), a subsidiary of [[Tata Steel]], has a lease contract for [[Jamshedpur]] (Jharkhand), a management contract in [[Haldia]] (West Bengal), another contract in [[Mysore]] (Karnataka) and since 2007 a contract for the reduction of [[non-revenue water]] in parts of [[Bhopal]] (Madhya Pradhesh).<ref>[http://www.financialexpress.com/ The Financial Express]: [http://www.financialexpress.com/news/jusco-reaches-bhopal-aims-for-other-cities-under-jnurm/212545/ Jusco reaches Bhopal, aims for other cities under JNURM], 25 August 2007</ref> The French water company [[Veolia]] won a management contract in three cities in [[Karnataka]] in 2005.<ref name="siteresources.worldbank.org">[[World Bank]]:[http://siteresources.worldbank.org/EXTWAT/Resources/4602122-1213366294492/5106220-1234469721549/21.5_India_Karnatka_Alvarado.pdf Introducing 24/7 water supply – Challenges in three cities in Karnataka, India]. Retrieved 29 March 2009.</ref><ref name="web.worldbank.org">[[World Bank]]: [http://web.worldbank.org/external/projects/main?pagePK=64283627&piPK=73230&theSitePK=40941&menuPK=228424&Projectid=P082510 Karnataka Urban Water Sector Improvement Project]. Retrieved 29 March 2009.</ref> In 2002 a consortium including [[Thames Water]] won a pilot contract covering 40,000 households to reduce non-revenue water in parts of [[Bangalore]], funded by the [[Japan Bank for International Cooperation]]. The contract was scaled up in 2004.<ref>{{Cite web |last=D.S. |first=Madhumathi |title=Bangalore water board upbeat on project to plug leakage |url=http://www.thehindubusinessline.com/2003/12/08/stories/2003120800771300.htm |url-status=dead |archive-url=https://web.archive.org/web/20040314060725/http://www.thehindubusinessline.com/2003/12/08/stories/2003120800771300.htm |archive-date=14 March 2004 |website=The Hindu Business Line}}</ref> The Cypriot company Hydro-Comp, with two Indian companies, won a 10-year concession contract for the city of [[Latur City]] (Maharashtra) in 2007 and an operator-consultant contract in [[Madurai]] (Tamil Nadu).<ref>[http://www.thefreelibrary.com/The+Latur+water+supply+project+is+replicable+across+India-a0202434389 The Latur water supply project is replicable across India], Interview with Ashok Natarajan, Managing Director of Hydro Comp Enterprises, 1 March 2009</ref> Furthermore, the private Indian infrastructure development company SPML is engaged in build-operate-transfer (BOT) projects, such as a bulk water supply project for [[Bhiwandi]] (Maharashtra).<ref>Dealcurry.com:[http://dealcurry.com/20100621-SPML-Infra-To-Raise-PE-Funding-For-Bhiwandi-Water-Project.htm SPML Infra To Raise PE Funding For Bhiwandi Water Project] {{Webarchive|url=https://web.archive.org/web/20101225065319/http://dealcurry.com/20100621-SPML-Infra-To-Raise-PE-Funding-For-Bhiwandi-Water-Project.htm }}, 21 June 2010</ref> | '''Private sector participation.''' The private sector plays a limited, albeit recently increasing role in operating and maintaining urban water systems on behalf of ULBs. For example, the Jamshedpur Utilities & Services Company (Jusco), a subsidiary of [[Tata Steel]], has a lease contract for [[Jamshedpur]] (Jharkhand), a management contract in [[Haldia]] (West Bengal), another contract in [[Mysore]] (Karnataka) and since 2007 a contract for the reduction of [[non-revenue water]] in parts of [[Bhopal]] (Madhya Pradhesh).<ref>[http://www.financialexpress.com/ The Financial Express]: [http://www.financialexpress.com/news/jusco-reaches-bhopal-aims-for-other-cities-under-jnurm/212545/ Jusco reaches Bhopal, aims for other cities under JNURM], 25 August 2007</ref> The French water company [[Veolia]] won a management contract in three cities in [[Karnataka]] in 2005.<ref name="siteresources.worldbank.org">[[World Bank]]:[http://siteresources.worldbank.org/EXTWAT/Resources/4602122-1213366294492/5106220-1234469721549/21.5_India_Karnatka_Alvarado.pdf Introducing 24/7 water supply – Challenges in three cities in Karnataka, India]. Retrieved 29 March 2009.</ref><ref name="web.worldbank.org">[[World Bank]]: [http://web.worldbank.org/external/projects/main?pagePK=64283627&piPK=73230&theSitePK=40941&menuPK=228424&Projectid=P082510 Karnataka Urban Water Sector Improvement Project]. Retrieved 29 March 2009.</ref> In 2002 a consortium including [[Thames Water]] won a pilot contract covering 40,000 households to reduce non-revenue water in parts of [[Bangalore]], funded by the [[Japan Bank for International Cooperation]]. The contract was scaled up in 2004.<ref>{{Cite web |last=D.S. |first=Madhumathi |date=7 December 2003 |title=Bangalore water board upbeat on project to plug leakage |url=http://www.thehindubusinessline.com/2003/12/08/stories/2003120800771300.htm |url-status=dead |archive-url=https://web.archive.org/web/20040314060725/http://www.thehindubusinessline.com/2003/12/08/stories/2003120800771300.htm |archive-date=14 March 2004 |website=The Hindu Business Line}}</ref> The Cypriot company Hydro-Comp, with two Indian companies, won a 10-year concession contract for the city of [[Latur City]] (Maharashtra) in 2007 and an operator-consultant contract in [[Madurai]] (Tamil Nadu).<ref>[http://www.thefreelibrary.com/The+Latur+water+supply+project+is+replicable+across+India-a0202434389 The Latur water supply project is replicable across India], Interview with Ashok Natarajan, Managing Director of Hydro Comp Enterprises, 1 March 2009</ref> Furthermore, the private Indian infrastructure development company SPML is engaged in build-operate-transfer (BOT) projects, such as a bulk water supply project for [[Bhiwandi]] (Maharashtra).<ref>Dealcurry.com:[http://dealcurry.com/20100621-SPML-Infra-To-Raise-PE-Funding-For-Bhiwandi-Water-Project.htm SPML Infra To Raise PE Funding For Bhiwandi Water Project] {{Webarchive|url=https://web.archive.org/web/20101225065319/http://dealcurry.com/20100621-SPML-Infra-To-Raise-PE-Funding-For-Bhiwandi-Water-Project.htm |date=25 December 2010 }}, 21 June 2010</ref> In 2023, [[NeeRain]] a government supported start-up was able to save 60,000 liters of water each year through innovation by installing their [[patent]]ed technologies across multiple location in India.<ref>{{Cite web |last=Nitnaware |first=Himanshu |date=18 May 2021 |title=Gujarat Startup's Low-Cost Filters Save 60000 Litres of Water, Without Electricity |url=https://www.thebetterindia.com/255256/amit-doshi-gujarat-startup-neerain-rooftop-rainwater-harvesting-system-filter-cost-effective-no-maintenance-gandhinagar-water-crisis-conservation-innovation-success-story-him16/ |access-date=28 July 2023 |website=The Better India |language=en-US}}</ref><ref>{{Cite web |title=About NeeRain Rooftop Rainwater Harvesting Filters |url=https://neerain.com/about-us/ |access-date=28 July 2023 |website=NeeRain |language=en-US}}</ref> | ||
'''Rural areas'''. There are about a 100,000 rural water supply systems in India. At least in some states, responsibility for service provision is in the process of being partially transferred from State Water Boards and [[Districts of India|district]] governments to [[Panchayati Raj]] Institutions (PRI) at the block or village level (there were about 604 districts and 256,000 villages in India in 2002, according to [[Subdivisions of India]]. Blocks are an intermediate level between districts and villages). Where this transfer has been initiated, it seems to be more advanced for single-village water schemes than for more complex multi-village water schemes. Despite their professed role Panchayati Raj Institutions, play only a limited role in provision of rural water supply and sanitation as of 2006. There has been limited success in implementing decentralisation, partly due to low priority by some state governments.<ref name="World Bank Punjab 2006, Annex 1"/> Rural sanitation is typically provided by households themselves in the form of latrines. | '''Rural areas'''. There are about a 100,000 rural water supply systems in India. At least in some states, responsibility for service provision is in the process of being partially transferred from State Water Boards and [[Districts of India|district]] governments to [[Panchayati Raj]] Institutions (PRI) at the block or village level (there were about 604 districts and 256,000 villages in India in 2002, according to [[Subdivisions of India]]. Blocks are an intermediate level between districts and villages). Where this transfer has been initiated, it seems to be more advanced for single-village water schemes than for more complex multi-village water schemes. Despite their professed role Panchayati Raj Institutions, play only a limited role in provision of rural water supply and sanitation as of 2006. There has been limited success in implementing decentralisation, partly due to low priority by some state governments.<ref name="World Bank Punjab 2006, Annex 1"/> Rural sanitation is typically provided by households themselves in the form of latrines. | ||
== Innovative approaches == | == Innovative approaches == | ||
{{ | {{See also|Har ghar jal}} | ||
A number of innovative approaches to improve water supply and sanitation have been tested in India, in particular in the early 2000s. These include [[community-led total sanitation]], demand-driven approaches in rural water supply, a public-private partnerships to improve the continuity of urban water supply in Karnataka, and the use of [[microcredit for water supply and sanitation|microcredits in water supply and sanitation]] to women in order to improve access to water. | A number of innovative approaches to improve water supply and sanitation have been tested in India, in particular in the early 2000s. These include [[community-led total sanitation]], demand-driven approaches in rural water supply, a public-private partnerships to improve the continuity of urban water supply in Karnataka, and the use of [[microcredit for water supply and sanitation|microcredits in water supply and sanitation]] to women in order to improve access to water.{{citation needed|date=October 2023}} | ||
=== Total Sanitation Campaign === | === Total Sanitation Campaign === | ||
{{ | {{Main|Total Sanitation Campaign}} | ||
In 1999 a demand-driven and people- | |||
In 1999 a demand-driven and people-centred sanitation programme was initiated under the name [[Total Sanitation Campaign]] (TSC) which has some similarities with [[community-led total sanitation]] (CLTS), but is not the same. It evolved from the limited achievements of the first structured programme for rural sanitation in India, the Central Rural Sanitation Programme, which had minimal community participation. The main goal of Total Sanitation Campaign is to eradicate the practice of [[open defecation]] by 2017. Community-led total sanitation is not focused on building infrastructure, but on preventing open defecation through self-awareness and shame. In Maharashtra where the programme started more than 2000 [[Gram Panchayat]]s have achieved "open defecation free" status. Villages that achieve this status receive monetary rewards and high publicity under a programme called Nirmal Gram Puraskar.<ref>[http://www.irc.nl/page/103 IRC] {{Webarchive|url=https://web.archive.org/web/20140408090411/http://www.irc.nl/page/103 |date=8 April 2014 }}:[http://www.irc.nl/page/35966 India: Unrealistic approach hampers rural sanitation programme] {{Webarchive|url=https://web.archive.org/web/20081005020454/http://www.irc.nl/page/35966 |date=5 October 2008 }}, 1 June 2007</ref><ref>Benny George:[https://web.archive.org/web/20201201123012/http://www.ivcs.org.uk/IJRS/April2009/incentivising%20sanitation%20coverage%20in%20rural%20india.pdf Nirmal Gram Puraskar: A Unique Experiment in Incentivising Sanitation Coverage in Rural India], International Journal of Rural Studies (IJRS), Vol. 16, No. 1, April 2009</ref> | |||
A new sanitation campaign was launched as [[Swachh Bharat Abhiyan]] (Clean India Mission) in October 2014. | A new sanitation campaign was launched as [[Swachh Bharat Abhiyan]] (Clean India Mission) in October 2014.<ref>{{Cite news |last=Rukmini |first=S |date=2 October 2014 |title=Modi launches 'My Clean India' campaign |url=https://www.thehindu.com/news/national/Modi-launches-My-Clean-India-campaign/article60391303.ece#:~:text=Making%20an%20appeal%20for%20a,Modi%20said. |access-date=29 September 2024 |work=The Hindu |language= |issn=0971-751X}}</ref> | ||
As of 1 December 2017, Total Sanitation Coverage throughout India has risen to 73% up from 42% on October | As of 1 December 2017, Total Sanitation Coverage throughout India has risen to 73% up from 42% on 2 October 2014, the day Swachh Bharat Abhiyan was launched.<ref>{{citation |url=http://sbm.gov.in/sbmdashboard/ |title=Swachh Bharat Abhiyan Report Stats |date=12 September 2017 |url-status=dead |archive-url=https://web.archive.org/web/20170928152538/http://sbm.gov.in/sbmreport/home.aspx |archive-date=28 September 2017 }}</ref> | ||
=== Demand-driven approaches in rural water supply === | === Demand-driven approaches in rural water supply === | ||
Most rural water supply schemes in India use a centralised, supply-driven approach, i.e. a government institution designs a project and has it built with little community consultation and no capacity building for the community, often requiring no water fees to be paid for its subsequent operation. Since 2002 the Government of India has rolled out at the national level a | Most rural water supply schemes in India use a centralised, supply-driven approach, i.e. a government institution designs a project and has it built with little community consultation and no capacity building for the community, often requiring no water fees to be paid for its subsequent operation. Since 2002 the Government of India has rolled out at the national level a programme to change the way in which water and sanitation services are supported rural areas. The programme, called ''Swajaldhara'', decentralises service delivery responsibility to rural local governments and user groups. Under the new approach communities are being consulted and trained, and users agree up-front to pay a tariff that is set at a level sufficiently high to cover operation and maintenance costs. It also includes measures to promote sanitation and to improve hygiene behaviour. The national programme follows a pilot programme launched in 1999.<ref>Ministry of Rural | ||
Development, Department of Drinking Water Supply:[http://ddws.gov.in/swajaldhara.htm Swajaldhara] {{Webarchive|url=https://web.archive.org/web/20100510030643/http://ddws.gov.in/swajaldhara.htm }}, updated on 31 March 2009. Retrieved 15 April 2010.</ref> | Development, Department of Drinking Water Supply:[http://ddws.gov.in/swajaldhara.htm Swajaldhara] {{Webarchive|url=https://web.archive.org/web/20100510030643/http://ddws.gov.in/swajaldhara.htm |date=10 May 2010 }}, updated on 31 March 2009. Retrieved 15 April 2010.</ref> | ||
According to a 2008 World Bank study in 10 Indian states, ''Swajaldhara'' results in lower capital costs, lower administrative costs and better service quality compared to the supply-driven approach. In particular, the study found that the average full cost of supply-driven schemes is {{ | According to a 2008 World Bank study in 10 Indian states, ''Swajaldhara'' results in lower capital costs, lower administrative costs and better service quality compared to the supply-driven approach. In particular, the study found that the average full cost of supply-driven schemes is {{convert|38|$/m3|$/cuft|$=₹|disp=or}} ({{convert|{{#expr: {{To USD|38|IND|year=2008}} * 100}}|¢/m3|¢/cuft|abbr=on|disp=or}}), while it is only {{cvt|26|$/m3|$/cuft|$=₹|disp=or}} ({{cvt|{{#expr: {{To USD|26|IND|year=2008}} * 100}}|¢/m3|¢/cuft|abbr=on|disp=or}}) for demand-driven schemes. These costs include capital, operation and maintenance costs, administrative costs and coping costs incurred by users of malfunctioning systems. Coping costs include travelling long distances to obtain water, standing in long queues, storing water and repairing failed systems. Among the surveyed systems that were built using supply-driven approach system breakdowns were common, the quantity and quality of water supply were less than foreseen in designs, and 30% of households did not get daily supply in summer. The poor functioning of one system sometimes leads to the construction of another system, so that about 30% of households surveyed were served by several systems. As of 2008 only about 10% of rural water schemes built in India used a demand-driven approach. Since water users have to pay lower or no tariffs under the supply-driven approach, this discourages them to opt for a demand-driven approach, even if the likelihood of the systems operating on a sustainable basis is higher under a demand-driven approach.<ref>[http://www-wds.worldbank.org/external/default/WDSContentServer/WDSP/IB/2008/07/23/000333037_20080723003033/Rendered/PDF/447910PP0P09411741301PUBLIC10PAPER2.pdf World Bank:Inefficiency of Rural Water Supply Schemes in India], Smita Misra, 2008</ref> | ||
=== Achieving continuous water supply in Karnataka === | === Achieving continuous water supply in Karnataka === | ||
In the cities of [[Hubli]], [[Belgaum]] and [[Gulbarga]] in the state of [[Karnataka]], the private operator [[Veolia]] increased water supply from once every 2–15 days for 1–2 hours, to 24 hours per day for 180,000 people (12% of the population of the 3 cities) within 2 years (2006–2008). This was achieved by carefully selecting and ring-fencing demonstration zones (one in each city), renovating the distribution network, installing meters, introducing a well-functioning commercial system, and effective grass-roots social intermediation by an NGO, all without increasing the amount of bulk water supplied. The project, known by its acronym as KUWASIP (Karnataka Urban Water Sector Improvement Project), was supported by a {{USD}}39.5 million loan from the [[World Bank]]. It constitutes a milestone for India, where no large city so far has achieved continuous water supply. The project is expected to be scaled-up to cover the entire area of the three cities.<ref name="WSP Kuwasip">{{cite web | | In the cities of [[Hubli]], [[Belgaum]] and [[Gulbarga]] in the state of [[Karnataka]], the private operator [[Veolia]] increased water supply from once every 2–15 days for 1–2 hours, to 24 hours per day for 180,000 people (12% of the population of the 3 cities) within 2 years (2006–2008). This was achieved by carefully selecting and ring-fencing demonstration zones (one in each city), renovating the distribution network, installing meters, introducing a well-functioning commercial system, and effective grass-roots social intermediation by an NGO, all without increasing the amount of bulk water supplied. The project, known by its acronym as KUWASIP (Karnataka Urban Water Sector Improvement Project), was supported by a {{USD}}39.5 million loan from the [[World Bank]]. It constitutes a milestone for India, where no large city so far has achieved continuous water supply. The project is expected to be scaled-up to cover the entire area of the three cities.<ref name="WSP Kuwasip">{{cite web |date=September 2010 |title=The Karnataka Urban Water Sector Improvement Project: 24x7 Water Supply is Achievable |url=http://www.wsp.org/wsp/sites/wsp.org/files/publications/WSP_Karnataka-water-supply.pdf |url-status=deviated |archive-url=https://web.archive.org/web/20160120220844/http://www.wsp.org/sites/wsp.org/files/publications/WSP_Karnataka-water-supply.pdf |archive-date=20 January 2016 |access-date=20 August 2012 |publisher=World Bank Water and Sanitation Program (WSP) |type=Field Note}}</ref><ref name="siteresources.worldbank.org"/><ref name="web.worldbank.org"/> | ||
Karnataka Urban Infrastructure Development & Finance Corporation (KUIDFC) has taken up North Karnataka Urban Sector Investment | Karnataka Urban Infrastructure Development & Finance Corporation (KUIDFC) has taken up North Karnataka Urban Sector Investment Programme (NKUSIP) covering 25 towns. Ilkal is one of the Project town, where 24 X 7 water supply project was implemented. The construction activities commenced in February 2013 and 24 X 7 water supply is commissioned in September 2015. The system is running successfully since then.<ref>{{Cite web |last=Tamaki |first=Keiichi |date=June 2017 |title=24/7 Normalized Water Supply Through Innovative Public-Private Partnership: Case Study from Ilkal Town, Karnataka, India |url=https://think-asia.org/handle/11540/7503 |website=Think Asia |publisher=Asian Development Bank Institute}}</ref> | ||
=== Microcredit for water connections in Tamil Nadu === | === Microcredit for water connections in Tamil Nadu === | ||
{{Further|Microcredit for water supply and sanitation}} | {{Further|Microcredit for water supply and sanitation}} | ||
In [[Tiruchirapalli]] in Tamil Nadu, the NGO Gramalaya, established in 1987, and women self-help groups promote access to water supply and sanitation by the poor through microcredit. Among the benefits are that women can spend more time with their children, earn additional income, and sell surplus water to neighbours. This money contributes to her repayment of the WaterCredit loan. The initiative is supported by the US-based non-profit [[Water Partners International]].<ref> | In [[Tiruchirapalli]] in Tamil Nadu, the NGO Gramalaya, established in 1987, and women self-help groups promote access to water supply and sanitation by the poor through microcredit. Among the benefits are that women can spend more time with their children, earn additional income, and sell surplus water to neighbours. This money contributes to her repayment of the WaterCredit loan. The initiative is supported by the US-based non-profit [[Water Partners International]].<ref>{{Cite web|url=https://water.org/partners/|archiveurl=https://web.archive.org/web/20080616043138/http://www.water.org/waterpartners.aspx?pgID=1015|url-status=dead|title=Partnering for Clean Water: Join Our Mission|archivedate=16 June 2008|website=Water.org}}</ref> | ||
=== Jamshedpur Utilities and Services Company === | === Jamshedpur Utilities and Services Company === | ||
The Jamshedpur Utilities and Services Company (JUSCO) provides water and sanitation services in [[Jamshedpur]]. Until 2004 a division of Tata Steel provided water to the city's residents. However, service quality was poor with intermittent supply, high water losses and no metering.<ref name="Asian Development Bank 2010" /> To improve this situation and to establish good practices that could be replicated in other Indian cities, JUSCO was set up as a wholly owned subsidiary of Tata Steel in 2004. | |||
Efficiency and service quality improved substantially over the following years. The level on [[non-revenue water]] decreased from an estimated 36% in 2005 to 10% in 2009; one quarter of residents received continuous water supply (although the average supply remained at only 7 hours per day) in 2009; the share of metered connections increased from 2% in 2007 to 26% in 2009; the number of customers increased; and the company recovered its operating costs plus a portion of capital costs. Identifying and legalising illegal connections was an important element in the reduction of non-revenue water. The utility prides itself today of the good drinking water quality provided and encourages its customers to drink from the tap. The utility also operates a wastewater treatment plant that meets discharge standards. The private utility pays salaries that are higher than civil service salaries and conducts extensive training programmes for its staff. It has also installed a modern system to track and resolve customer complaints. Furthermore, it conducts independent annual customer satisfaction surveys. Together with Ranhill Malaysia it won a 25-year concession contract for providing the water supply in [[Haldia]] City, West Bengal.<ref name="Asian Development Bank 2010" /> | |||
Efficiency and service quality improved substantially over the following years. The level on [[non-revenue water]] decreased from an estimated 36% in 2005 to 10% in 2009; one quarter of residents received continuous water supply (although the average supply remained at only 7 hours per day) in 2009; the share of metered connections increased from 2% in 2007 to 26% in 2009; the number of customers increased; and the company recovered its operating costs plus a portion of capital costs. Identifying and legalising illegal connections was an important element in the reduction of non-revenue water. The utility prides itself today of the good drinking water quality provided and encourages its customers to drink from the tap. The utility also operates a wastewater treatment plant that meets discharge standards. The private utility pays salaries that are higher than civil service salaries and conducts extensive training | |||
=== Fecal sludge management === | === Fecal sludge management === | ||
Many small and medium towns in India have started deploying [[fecal sludge management]] (FSM) for dealing with human excreta instead of waiting for [[sewerage]] systems. It deals with excreta contained in on-site sanitation systems like pits and septic tanks (called as fecal sludge). It involves removal of fecal sludge from on-site sanitation system its conveyance to a | Many small and medium towns in India have started deploying [[fecal sludge management]] (FSM) for dealing with human excreta instead of waiting for [[sewerage]] systems. It deals with excreta contained in on-site sanitation systems like pits and septic tanks (called as fecal sludge). It involves removal of fecal sludge from on-site sanitation system its conveyance to a facility where it is treated. In sewerage systems, sizeable share of the capital expenditure is towards laying network. {{Citation needed|date=March 2021}} In deploying FSM, the waste is conveyed through vacuum emptier trucks or other vehicles using existing road network, thereby drastically reducing the capital expenditure. {{Citation needed|date=March 2021}} Already 30 towns have FSM services operational and they are at various stages of planning in 700 other towns across the country.<ref name="NFSSM Alliance 2021">{{Cite book|last=NFSSM Alliance|url=https://niti.gov.in/sites/default/files/2021-01/NITI-NFSSM-Alliance-Report-for-digital.pdf|title=Faecal Sludge and Septage Management in Urban Areas: Service and Business models|publisher=NITI Aayog|year=2021}}</ref> It is rapidly being adopted in the states of Maharashtra, Rajasthan, [[Water supply and sanitation in Uttar Pradesh|Uttar Pradesh]], Odisha, Andhra Pradesh, Telangana, and Tamil Nadu with support of members of the [https://nfssmalliance.org/ NFSSM Alliance].<ref name="NFSSM Alliance 2021" /> | ||
== Efficiency of utilities== | == Efficiency of utilities== | ||
There are only limited data on the operating efficiency of utilities in India, and even fewer data on the efficiency of investments. Two indicators of operating efficiency are non-revenue water and labour productivity. | There are only limited data on the operating efficiency of utilities in India, and even fewer data on the efficiency of investments. Two indicators of operating efficiency are non-revenue water and labour productivity. | ||
'''Non-revenue water'''. According to the results of a | '''Non-revenue water'''. According to the results of a service level benchmarking (SLB) programme carried out by the Ministry of Urban Development (MoUD) in 2006 in 28 cities, the average level of [[non-revenue water]] (NRW) was 44 per cent.<ref name="WSP Kuwasip"/> Another study of 20 cities by the Jawaharlal Nehru National Urban Renewal Mission with the support of the Asian Development Bank showed an average level of [[non-revenue water]] (NRW) of 32%. However, 5 out of the 20 cities did not provide any data. For those that provided data there probably is a large margin of error, since only 25% of connections are metered, which makes it very difficult to estimate non-revenue water. Also, three utilities in the sample show NRW levels of less than 20%, two of which have practically no metering, which indicates that the numbers are not reliable and actual values are likely to be higher.<ref name="Asian Development Bank" /> In Delhi, which was not included in the ADB study, non-revenue water stood at 53% and there were about 20 employees per 1000 connections. Furthermore, only 70% of revenue billed was actually collected. | ||
'''Labour productivity'''. Concerning [[labour productivity]], the 20 utilities in the sample had on average 7.4 employees per 1,000 connections, which is much higher than the estimated level for an efficient utility.<ref name=" | '''Labour productivity'''. Concerning [[labour productivity]], the 20 utilities in the sample had on average 7.4 employees per 1,000 connections, which is much higher than the estimated level for an efficient utility.<ref name="Asian Development Bank" /> A survey of a larger sample of Indian utilities showed an average ratio of 10.9 employees per 1,000 connections.<ref name="National Institute of Urban Affairs 2005" /> | ||
== Tariffs, cost recovery and subsidies == | == Tariffs, cost recovery and subsidies == | ||
[[Water tariff|Water and sewer tariffs]] in India are low in both urban and rural areas. In urban areas they were set at the equivalent of about {{cvt|10|¢/m3}} in 2007 and recovered about 60% of operating and maintenance costs, with large differences between cities. Some cities such as Kolkata do not bill residential users at all. In rural areas the level of cost recovery often is even lower than in urban areas and was estimated at only 20% in rural Punjab. Subsidies were estimated at {{USD}}1.1 billion per year in the mid-1990s, accounting to 4% of all government subsidies in India. 70% of those benefiting from the subsidies are not poor. | |||
[[Water tariff|Water and sewer tariffs]] in India are low in both urban and rural areas. In urban areas they were set at the equivalent of about {{ | |||
=== Urban areas === | === Urban areas === | ||
'''Metering.''' [[Water metering]] is the precondition for billing water users on the basis of volume consumed. Estimates of the share of customers metered vary depending on the study quoted. According to the results of a | '''Metering.''' [[Water metering]] is the precondition for billing water users on the basis of volume consumed. Estimates of the share of customers metered vary depending on the study quoted. According to the results of a service level benchmarking (SLB) rogram carried out by the Ministry of Urban Development in 2006 in 28 cities, the share of metering was 50 per cent.<ref name="WSP Kuwasip"/> According to a 1999 survey of 300 cities about 62% of urban water customers in metropolitan areas and 50% in smaller cities are metered (average 55%). However, meters often do not work so that many "metered" customers are charged flat rates. Bangalore and Pune are among the few Indian cities that meter all their customers. Many other cities have no metering at all or meter only commercial customers.<ref name="National Institute of Urban Affairs 2005" /> Users of standposts receive water free of charge. A 2007 study of 20 cities by the [[Jawaharlal Nehru National Urban Renewal Mission]] with the support of the Asian Development Bank (ADB) showed that only 25% of customers of these utilities were metered. Most other customers paid a flat tariff independent of consumption. Some utilities, such as the one serving [[Kolkata]], actually do not bill residential users at all.<ref>[[Asian Development Bank]]:[http://www.adb.org/publications/2007-benchmarking-and-data-book-water-utilities-india Benchmarking and Data Book of Water Utilities in India], 2007, p. 9</ref> | ||
'''Tariff levels'''. According to the same ADB study the average tariff for all customers – including industrial, commercial and public customers – is {{ | '''Tariff levels'''. According to the same ADB study the average tariff for all customers – including industrial, commercial and public customers – is {{convert|4.9|$/m3|$/cuft|$=₹|disp=or}} ({{convert|{{#expr: {{To USD|4.9|IND|year=2007}} * 100}}|¢/m3|¢/cuft|abbr=on|disp=or}}).<ref name="Asian Development Bank" /> According to a 2007 global water tariff survey by the OECD the residential water tariff for a consumption of {{cvt|15|m3}} was equivalent to {{cvt|0.15|$/m3}} in Bangalore, {{cvt|0.12|$/m3}} in Calcutta, {{cvt|0.11|$/m3}} in New Delhi and {{cvt|0.09|$/m3}} in Mumbai. Only Bangalore had a sewer tariff of {{cvt|0.02|$/m3}}. The other three cities did not charge for sewerage, although the better-off tend to be the ones with access to sewers.<ref>OECD/Global Water Intelligence Water Tariff Survey 2007, quoted in Peter Gleick:[https://books.google.com/books?id=_wd-s1FB7VEC&dq=oecd+gwi+water+tariff+survey&pg=PT338 The World's Water 2008–2009], p. 321-322</ref> | ||
'''Tariff structure.''' The tariff for customers that are effectively metered is typically a uniform linear tariff, although some cities apply increasing-block tariffs.<ref name=" | '''Tariff structure.''' The tariff for customers that are effectively metered is typically a uniform linear tariff, although some cities apply increasing-block tariffs.<ref name="National Institute of Urban Affairs 2005" /> | ||
'''Affordability.''' Urban water tariffs were highly affordable according to data from the year 2000. A family of five living on the poverty line which uses 20 | '''Affordability.''' Urban water tariffs were highly affordable according to data from the year 2000. A family of five living on the poverty line which uses {{convert|20|m3}} of water per month would spend less than 1.2% of its budget on its water bill if it had a water meter. If it did not have a water meter and was charged a flat rate, it would pay 2.0% of its budget. This percentage lies below the often used affordability threshold of 5%. However, at that time the average metered tariff was estimated at only {{cvt|0.03|$/m3}}, or less than three times what it was estimated to be in 2007.<ref>National Institute of Urban Affairs (NIUA), 2002, Status of Water Supply, Sanitation and Solid Waste Management in Urban India, quoted in: World Bank/PPIAF/Water and Sanitation Program/World Bank Institute:[http://www.wsp.org/wsp/sites/wsp.org/files/publications/418200752957_scorecard.pdf Water Tariffs and Subsidies in South Asia: A Scorecard for India], 2002, p. 7-8</ref> Apparently no more up-to-date estimates on the share of the average water bill in the budget of the poor are available. | ||
'''Cost recovery.''' According to a 2007 study of 20 cities the average rate of cost recovery for operating and maintenance costs of utilities in these cities was 60%. Seven of the 20 utilities generated a cash surplus to partially finance investments. [[Chennai]] generated the highest relative surplus. The lowest cost recovery ratio was found in [[Indore]] in Madhya Pradesh, which recovered less than 20% of its operating and maintenance costs.<ref name=" | '''Cost recovery.''' According to a 2007 study of 20 cities the average rate of cost recovery for operating and maintenance costs of utilities in these cities was 60%. Seven of the 20 utilities generated a cash surplus to partially finance investments. [[Chennai]] generated the highest relative surplus. The lowest cost recovery ratio was found in [[Indore]] in Madhya Pradesh, which recovered less than 20% of its operating and maintenance costs.<ref name="Asian Development Bank" /> According to the results of a service level benchmarking (SLB) programme carried out by the Ministry of Urban Development in 2006 in 28 cities, cost recovery was 67% on average.<ref name="WSP Kuwasip"/> | ||
'''Delhi example'''. Between 2011 and 2013 Delhi Jal Board (DJB) has increased its revenues by 50 | '''Delhi example'''. Between 2011 and 2013 Delhi Jal Board (DJB) has increased its revenues by 50 per cent and reduced operating subsidies from the National Capital Territory of Delhi. It owes {{INRConvert|350|b|1}} in debt, but hopes that the debt will be converted into a grant. The utility focuses on improving its customer database, meter reading through hand-held devices, billing and bill collection under a new manager, Debashree Mukherjee, who took the helm of the utility in 2012.<ref name="GWI Delhi"/> As of 2004, in [[Delhi]] revenues were just sufficient to cover about 60% of operating costs of DJB; maintenance was, as a result, minimal. In the past, the Delhi utility has relied heavily on government financial support for recurrent and capital expenditures in the magnitude of {{INRConvert|3|b|1}} per year and {{INRConvert|7|b|1}} respectively. Accounts receivable represent more than 12 months of billing, part of it being non-recoverable.<ref name="World Bank" /> The average tariff was estimated at {{USD}}0.074/m<sup>3</sup> in 2001, compared to production costs of {{USD}}0.085/m<sup>3</sup>, the latter probably being a very conservative estimate that does not take into account capital costs.<ref>[http://www.adb.org/Water/Indicators/Profiles/Delhi_city.pdf Delhi ADB 2001] {{Webarchive|url=https://web.archive.org/web/20071010125148/http://www.adb.org/Water/Indicators/Profiles/Delhi_city.pdf |date=10 October 2007 }} The same source estimates the working ratio at 2.45, which implies that current revenues must be less than half of recurrent costs</ref> | ||
'''Challenges faced in attempting to increase tariffs.''' Even if users are willing to pay more for better services, political interests often prevent tariffs from being increased even to a small extent. An example is the city of [[Jabalpur]] where the central government and the state government financed a {{INRConvert|130|m|1}} water supply project from 2000–2004 to be operated by the Jabalpur Municipal Corporation, an entity that collected only less than half of its operational costs in revenues even before this major investment. Even so, the municipal corporation initially refused to increase tariffs. Only following pressure from the state government it reluctantly agreed to increase commercial tariffs, but not residential tariffs.<ref>[[Global Water Partnership]]:[http://www.gwptoolbox.org/index.php?option=com_case&id=151&Itemid=45 Malay Raj MukerjeeIndia: Issues in introducing a realistic water pricing regime in urban local bodies]</ref> | '''Challenges faced in attempting to increase tariffs.''' Even if users are willing to pay more for better services, political interests often prevent tariffs from being increased even to a small extent. An example is the city of [[Jabalpur]] where the central government and the state government financed a {{INRConvert|130|m|1}} water supply project from 2000–2004 to be operated by the Jabalpur Municipal Corporation, an entity that collected only less than half of its operational costs in revenues even before this major investment. Even so, the municipal corporation initially refused to increase tariffs. Only following pressure from the state government it reluctantly agreed to increase commercial tariffs, but not residential tariffs.<ref>[[Global Water Partnership]]:[http://www.gwptoolbox.org/index.php?option=com_case&id=151&Itemid=45 Malay Raj MukerjeeIndia: Issues in introducing a realistic water pricing regime in urban local bodies]</ref> | ||
=== Rural areas === | === Rural areas === | ||
Cost recovery in rural areas is low and a majority of the rural water systems are defunct for lack of maintenance. Some state governments subsidise rural water systems, but funds are scarce and insufficient.<ref>Planning Commission:[http://planningcommission.nic.in/plans/planrel/fiveyr/10th/volume2/v2_ch5_5.pdf 10th Plan, p. 604] {{Webarchive|url=https://web.archive.org/web/20070727055634/http://planningcommission.nic.in/plans/planrel/fiveyr/10th/volume2/v2_ch5_5.pdf |date=27 July 2007 }}</ref> In rural areas in [[Punjab (India)|Punjab]], operation and maintenance cost recovery is only about 20%. On one hand, expenditures are high due to high salary levels, high power tariff and a high number of operating staff. On the other hand, revenue is paid only by the 10% of the households who have private connections. Those drawing water from public stand posts do not pay any water charges at all, although the official tariff for public stand post users is {{INRConvert|15|rounding_digits=1}} per month per household.<ref name="World Bank Punjab 2006, Annex 1"/> | |||
Cost recovery in rural areas is low and a majority of the rural water systems are defunct for lack of maintenance. Some state governments subsidise rural water systems, but funds are scarce and insufficient.<ref>Planning Commission:[http://planningcommission.nic.in/plans/planrel/fiveyr/10th/volume2/v2_ch5_5.pdf 10th Plan, p. 604] {{Webarchive|url=https://web.archive.org/web/20070727055634/http://planningcommission.nic.in/plans/planrel/fiveyr/10th/volume2/v2_ch5_5.pdf }}</ref> In rural areas in [[Punjab (India)|Punjab]], operation and maintenance cost recovery is only about 20%. On one hand, expenditures are high due to high salary levels, high power tariff and a high number of operating staff. On the other hand, revenue is paid only by the 10% of the households who have private connections. Those drawing water from public stand posts do not pay any water charges at all, although the official tariff for public stand post users is {{INRConvert| | |||
=== Subsidies and targeting of subsidies === | === Subsidies and targeting of subsidies === | ||
There are no accurate recent estimates of the level of subsidies for water and sanitation in India. It has been estimated that transfers to the water sector in India amounted to {{INRConvert|54708|m|1}} per year in the mid-1990s, accounting for 4% of all government subsidies in India. About 98% of this subsidy is said to come from State rather than Central budgets.<ref>Srivastava, D.K. and Sen, T.K. (1997), Government Subsidies in India, National Institute of Public Finance and Policy, New Delhi, quoted in: World Bank/PPIAF/Water and Sanitation Program/World Bank Institute:[http://www.wsp.org/wsp/sites/wsp.org/files/publications/418200752957_scorecard.pdf Water Tariffs and Subsidies in South Asia: A Scorecard for India], 2002, p. 8</ref> This figure may only cover recurrent cost subsidies and not investment subsidies, which are even higher (see below). There is little targeting of subsidies. According to the World Bank, 70% of those benefiting from subsidies for public water supply are not poor, while 40% of the poor are excluded because they do not have access to public water services.<ref>World Bank/PPIAF/Water and Sanitation Program/World Bank Institute:[http://www.wsp.org/wsp/sites/wsp.org/files/publications/418200752957_scorecard.pdf Water Tariffs and Subsidies in South Asia: A Scorecard for India], 2002, p. 12</ref> | |||
There are no accurate recent estimates of the level of subsidies for water and sanitation in India. It has been estimated that transfers to the water sector in India amounted to {{INRConvert|54708|m|1}} per year in the mid-1990s, accounting for 4% of all government subsidies in India. About 98% of this subsidy is said to come from State rather than Central budgets.<ref>Srivastava, D.K. and Sen, T.K. (1997), Government Subsidies in India, National Institute of Public Finance and Policy, New Delhi, quoted in: World Bank/PPIAF/Water and Sanitation Program/World Bank Institute:[http://www.wsp.org/wsp/sites/wsp.org/files/publications/418200752957_scorecard.pdf Water Tariffs and Subsidies in South Asia: A Scorecard for India], 2002, p. 8</ref> This figure may only cover recurrent cost subsidies and not investment subsidies, which are even higher (see below). There is little targeting of subsidies. According to the World Bank, 70% of those benefiting from subsidies for public water supply are not poor, while 40% of the poor are excluded because they do not have access to public water services.<ref | |||
== Investment and financing == | == Investment and financing == | ||
| Line 204: | Line 193: | ||
=== Investment === | === Investment === | ||
The [[Eleventh Five-Year Plan (India)|Eleventh Five-Year Plan]] (2007–2012) foresaw investments of {{INRConvert|1270.25|b|1}} for urban water supply and sanitation, including urban (stormwater) drainage and solid waste management.<ref name=" | The [[Eleventh Five-Year Plan (India)|Eleventh Five-Year Plan]] (2007–2012) foresaw investments of {{INRConvert|1270.25|b|1}} for urban water supply and sanitation, including urban (stormwater) drainage and solid waste management.<ref name="Planning Commission" /> | ||
=== Financing === | === Financing === | ||
The funding of government programmes for water supply and sanitation is shared by the central government, states and other contributors, with the share contributed by various stakeholders varying between programmes and over time. For example, as of 2016 the states pay 60% and the central government pays 40% for investments financed under the Clean India Mission and the National Rural Drinking Water Programme. Until 2015 the central government had funded 75% of the Clean India Mission.<ref>{{cite web|title=Tracking Policy and Budgetary Commitments for Drinking Water and Sanitation: A Study of Select States|url=http://www.cbgaindia.org/wp-content/uploads/2016/03/Tracking-Policy-and-Budgetary-Commitments-for-Drinking-Water-and-Sanitation-1.pdf|publisher=Centre for Budget and Governance Accountability (CBGA)|access-date=28 July 2016}}</ref> | The funding of government programmes for water supply and sanitation is shared by the central government, states and other contributors, with the share contributed by various stakeholders varying between programmes and over time. For example, as of 2016 the states pay 60% and the central government pays 40% for investments financed under the Clean India Mission and the National Rural Drinking Water Programme. Until 2015 the central government had funded 75% of the Clean India Mission.<ref>{{cite web|title=Tracking Policy and Budgetary Commitments for Drinking Water and Sanitation: A Study of Select States|url=http://www.cbgaindia.org/wp-content/uploads/2016/03/Tracking-Policy-and-Budgetary-Commitments-for-Drinking-Water-and-Sanitation-1.pdf|publisher=Centre for Budget and Governance Accountability (CBGA)|access-date=28 July 2016|date=January 2016}}</ref> | ||
Under the 11th Plan (2007–12) 55% of the investments were to be financed by the central government, 28% by state governments, 8% by "institutional financing" such as HUDCO, 8% by external agencies and 1.5% by the private sector. Local governments were not expected to contribute to the investments. The volume of investments was expected to double to reach 0.7% of GDP. Also, it implied a shift in financing from state governments to the central government.<ref name=" | Under the 11th Plan (2007–12) 55% of the investments were to be financed by the central government, 28% by state governments, 8% by "institutional financing" such as HUDCO, 8% by external agencies and 1.5% by the private sector. Local governments were not expected to contribute to the investments. The volume of investments was expected to double to reach 0.7% of GDP. Also, it implied a shift in financing from state governments to the central government.<ref name="Planning Commission" /> During the 9th Plan only 24% of investments were financed by the central government and 76% by state governments. Central government financing was heavily focused on water supply in rural areas.<ref>[[Planning Commission of India]]:[http://planningcommission.nic.in/reports/genrep/wtrsani.pdf India Assessment 2002, Water Supply and Sanitation, a WHO-UNICEF sponsored study], 2003, p. 51-53</ref> | ||
=== Institutions === | === Institutions === | ||
The current system of financing water supply and sanitation is fragmented through a number of different national and state | The current system of financing water supply and sanitation is fragmented through a number of different national and state programmes. This results in simultaneous implementation with different and conflicting rules in neighbouring areas. For example, in rural areas different programmes undermine each other, adversely affecting demand driven approaches requiring cost sharing by users. | ||
State budgets the major source of financing for water supply and sanitation. State Financing Corporations (SFC) play an important role in making recommendations regarding the allocation of state tax revenues between states and municipalities, criteria for grants, and measures to improve the financial position of municipalities. According to the Planning Commission, SFCs are in some cases not sufficiently transparent and/or competent, have high transactions costs, and their recommendations are sometimes not being implemented.<ref>Planning Commission:[http://planningcommission.nic.in/plans/planrel/fiveyr/10th/volume2/v2_ch6_1.pdf 10th Plan (2002–2007), p. 611] {{Webarchive|url=https://web.archive.org/web/20070821113757/http://planningcommission.nic.in/plans/planrel/fiveyr/10th/volume2/v2_ch6_1.pdf }}</ref> An important source of financing are loans from [[Housing and Urban Development Corporation]] Ltd (HUDCO), a Central government financial undertaking. HUDCO loans to municipal corporations need to be guaranteed by state governments. HUDCO also on-lends loans from foreign aid, including Japanese aid, to states. The [[Jawaharlal Nehru National Urban Renewal Mission]] ( | State budgets the major source of financing for water supply and sanitation. State Financing Corporations (SFC) play an important role in making recommendations regarding the allocation of state tax revenues between states and municipalities, criteria for grants, and measures to improve the financial position of municipalities. According to the Planning Commission, SFCs are in some cases not sufficiently transparent and/or competent, have high transactions costs, and their recommendations are sometimes not being implemented.<ref>Planning Commission:[http://planningcommission.nic.in/plans/planrel/fiveyr/10th/volume2/v2_ch6_1.pdf 10th Plan (2002–2007), p. 611] {{Webarchive|url=https://web.archive.org/web/20070821113757/http://planningcommission.nic.in/plans/planrel/fiveyr/10th/volume2/v2_ch6_1.pdf |date=21 August 2007 }}</ref> An important source of financing are loans from [[Housing and Urban Development Corporation]] Ltd (HUDCO), a Central government financial undertaking. HUDCO loans to municipal corporations need to be guaranteed by state governments. HUDCO also on-lends loans from foreign aid, including Japanese aid, to states. The [[Jawaharlal Nehru National Urban Renewal Mission]] (2005–2014) played an important role in financing urban water supply and sanitation through central government grants. However, its grants were limited to the 35 largest cities in the country and 28 other selected cities, so that most cities with less than 1 million inhabitants were not eligible to receive grants from this mission. It was replaced by the [[Atal Mission for Rejuvenation and Urban Transformation]] (AMRUT), the new government's flagship programme for urban development. In addition, in 2014 the new government announced its high-profile [[Swachh Bharat Abhiyan]] (Clean India Mission) that aims at eradicating [[open defecation]] by 2019, covering 4,041 cities and towns. The programme has received funding and technical support from the [[World Bank]], corporations and state governments under the [[Sarva Shiksha Abhiyan]] and [[Rashtriya Madhyamik Shiksha Abhiyan]] schemes.<ref>{{cite web|url=http://articles.economictimes.indiatimes.com/2015-02-17/news/59232518_1_india-open-defecation-swachh-bharat-abhiyan-toilets|archive-url=https://web.archive.org/web/20150220014530/http://articles.economictimes.indiatimes.com/2015-02-17/news/59232518_1_india-open-defecation-swachh-bharat-abhiyan-toilets|url-status=dead|archive-date=20 February 2015|title=Swachh Bharat Abhiyaan: Government builds 7.1 lakh toilets in January|work=timesofindia-economictimes}}</ref> Swachh Bharat Abhiyan is expected to cost over {{INRConvert|620|b}}.<ref>{{cite web|url=http://zeenews.india.com/news/india/swachh-bharat-abhiyan-with-a-broom-in-hand-pm-modi-to-lead-from-the-front_1478677.html|title=PM Modi's 'Swachh Bharat Abhiyan' set for mega launch Thursday; schools, offices gear up for event|work=[[Zee News]] |date=October 2014}}</ref> An amount of {{INRConvert|90|b}} was allocated for the mission in [[2016 Union budget of India]].<ref>{{citation |title=Budget 2016: Swachh Bharat Abhiyan gets Rs 9,000 crore |url=https://economictimes.indiatimes.com/news/politics-and-nation/budget-2016-swachh-bharat-abhiyan-gets-rs-9000-crore/articleshow/51193662.cms |work=[[The Economic Times]] |date=29 February 2016 }}</ref> In 2015 the government introduced a 0.5% service tax on air travel, telephony, eating out and banking to finance the Clean India Campaign.<ref>{{cite web|title=New steps to make Swachh Bharat, or Clean India Campaign, a reality|url=http://www.ircwash.org/news/tax-raise-realise-india%E2%80%99s-dream|publisher=IRC – Supporting water, sanitation and hygiene services for life|access-date=28 July 2016|date=17 December 2015}}</ref> A budget tracking study revealed that the shift of policy focus from water to sanitation as part of the Clean India Campaign has resulted in a cut in government spending on rural water supply. A Parliamentary Standing Committee report found that the government would be unable to achieve its 2017 target of providing 50% rural households with piped water.<ref>{{cite web|last1=Dietvorst|first1=Cor|title=The decision to divert funding from water to sanitation turned sour when drought struck India.|url=http://www.ircwash.org/news/can-you-spend-too-much-sanitation|publisher=IRC|access-date=28 July 2016|date=21 July 2016}}</ref> | ||
During the 2019 [[Independence Day (India)|Independence Day]] of India, Prime Minister Narendra Modi confirmed that the target of half of the country's households provided of piped water wasn't reached. He also announced that the Government had decided to promote the Jal Jeevan Mission with a starting endowment fund of Rs 3.5 trillion and the goal "to provide to all households in rural India safe and adequate water through individual household tap connections by 2024".<ref>{{cite news | url = https://www.business-standard.com/about/what-is-jal-jeevan-mission | title = What is Jal Jeeval Mission | newspaper = Business Standard India | year = 2019 | publisher = Business Standard | archive-url = https://web.archive.org/web/20200103121320/https://www.business-standard.com/about/what-is-jal-jeevan-mission | archive-date = January | During the 2019 [[Independence Day (India)|Independence Day]] of India, Prime Minister Narendra Modi confirmed that the target of half of the country's households provided of piped water wasn't reached. He also announced that the Government had decided to promote the Jal Jeevan Mission with a starting endowment fund of Rs 3.5 trillion and the goal "to provide to all households in rural India safe and adequate water through individual household tap connections by 2024".<ref>{{cite news | url = https://www.business-standard.com/about/what-is-jal-jeevan-mission | title = What is Jal Jeeval Mission | newspaper = Business Standard India | year = 2019 | publisher = Business Standard | archive-url = https://web.archive.org/web/20200103121320/https://www.business-standard.com/about/what-is-jal-jeevan-mission | archive-date = 3 January 2020 | url-status = live}}</ref> | ||
The Jal Jeevan Mission subsumed the older National Rural Drinking Water Programme (NRDWP), preserving the goal "to provide Functional Household Tap Connection (FHTC) to every rural household" by 2024.<ref>{{cite web | url = https://jalshakti-ddws.gov.in/sites/default/files/JJM_note.pdf | title = Jal Jeevan Mission (JJM) | page = 1 | publisher = [[Ministry of Drinking Water and Sanitation]] | archive-url = https://web.archive.org/web/20191123081359/https://jalshakti-ddws.gov.in/sites/default/files/JJM_note.pdf/ | archive-date = November | The Jal Jeevan Mission subsumed the older National Rural Drinking Water Programme (NRDWP), preserving the goal "to provide Functional Household Tap Connection (FHTC) to every rural household" by 2024.<ref>{{cite web | url = https://jalshakti-ddws.gov.in/sites/default/files/JJM_note.pdf | title = Jal Jeevan Mission (JJM) | page = 1 | publisher = [[Ministry of Drinking Water and Sanitation]] | archive-url = https://web.archive.org/web/20191123081359/https://jalshakti-ddws.gov.in/sites/default/files/JJM_note.pdf/ | archive-date = 23 November 2019 | url-status = live}}</ref> At the 107th [[Indian Science Congress]] held in January 2020 in [[Bengaluru]], Modi declared that "technology is the strength of the Jal Jeevan Mission" and young Indian scientists have the "responsibility to develop cheap and effective technology for the recycling of water", which represents a new frontier for all of them.<ref>{{cite news | url = https://www.hindustantimes.com/india-news/new-india-needs-logical-temperament-to-give-direction-to-socioeconomic-development-pm/story-82yJdEd1bKJXjBp8s7q4oK.html | title = Rural India's economic strength linked to young scientists: PM in Bengaluru | date = 3 January 2020 | journal = [[Hindustan Times]] | location = Bengaluru | archive-url = https://web.archive.org/web/20200103061146/https://www.hindustantimes.com/india-news/new-india-needs-logical-temperament-to-give-direction-to-socioeconomic-development-pm/story-82yJdEd1bKJXjBp8s7q4oK.html | archive-date = 3 January 2020 | url-status = live}}</ref> | ||
In 1996 Tamil Nadu introduced a public-private partnership, the Tamil Nadu Urban Development Fund (TNUDF), to channel both grants and loans to cities in the state. TNUDF has received funding from the [[World Bank]], Japanese [[JICA]] and [[KfW]] from Germany. It also | In 1996 Tamil Nadu introduced a public-private partnership, the Tamil Nadu Urban Development Fund (TNUDF), to channel both grants and loans to cities in the state. TNUDF has received funding from the [[World Bank]], Japanese [[JICA]] and [[KfW]] from Germany. It also mobilises funding from the capital market through a water and sanitation pooled fund, under which several municipalities joined to issue a bond in the local market. TNUDF so far is the only functioning state-level fund that channels loans to ULBs in India.<ref>{{cite web|last=Tamil Nadu Urban Development Fund|title=Water and Sanitation Pooled Fund|url=http://www.tnudf.com/wspf.asp|access-date=20 August 2012}}</ref> In 2012 the state of Orissa has created an Urban Development Fund modelled on the example of Tamil Nadu. | ||
== External cooperation == | == External cooperation == | ||
In absolute terms India receives almost twice as much development assistance for water, sanitation and water resources management as any other country, according to data from the [[Organisation for Economic Co-operation and Development]]. India accounts for 13 per cent of commitments in global water aid for 2006–07, receiving an annual average of about {{USD}}830 million (€620 million), more than double the amount provided to China. India's biggest water and sanitation donor is Japan, which provided {{USD}}635 million, followed by the World Bank with {{USD}}130 million.<ref>[[Financial Times]]:[https://www.ft.com/content/ec5ab47a-2309-11de-9c99-00144feabdc0 India gets biggest share of aid for water and hygiene], 7 April 2009</ref><ref>[[OECD]], 2007:[http://www.oecd.org/dataoecd/2/60/42265683.pdf Measuring Aid to Water Supply and Sanitation] {{webarchive |url=https://web.archive.org/web/20100525044541/http://www.oecd.org/dataoecd/2/60/42265683.pdf |date=25 May 2010 }}, p. 3</ref> The annual average for 2004–06, however, was about half as much at {{USD}}448 million, of which Japan provided {{USD}}293 million and the [[World Bank]] {{USD}}87 million.<ref>OECD:Aid to the water sector commitments, India, calculated from the following pivot table:[https://web.archive.org/web/20150924090200/http://www.oecd.org/dataoecd/16/14/41812948.xls Water focus charts: Disbursements 2004–2006]</ref> The [[Asian Development Bank]] and Germany are other important external partners in water supply and sanitation. | |||
In 2003 the Indian government decided it would only accept bilateral aid from five countries (the United Kingdom, the United States, Russia, Germany and Japan). A further 22 bilateral donors were asked to channel aid through nongovernmental organisations, United Nations agencies or multilateral institutions such as the European Union, the Asian Development Bank or the World Bank.<ref>Gareth Price, [[Chatham House]]:[http://www.chathamhouse.org.uk/files/3199_wp200904.pdf India's aid dynamics: from recipient to donor?] {{Webarchive|url=https://web.archive.org/web/20110617014553/http://www.chathamhouse.org.uk/files/3199_wp200904.pdf |date=17 June 2011 }}, Asia Programme Working Paper, September 2004, p. 4</ref> | |||
In 2003 the Indian government decided it would only accept bilateral aid from five countries (the United Kingdom, the United States, Russia, Germany and Japan). A further 22 bilateral donors were asked to channel aid through nongovernmental organisations, United Nations agencies or multilateral institutions such as the European Union, the Asian Development Bank or the World Bank.<ref>Gareth Price, [[Chatham House]]:[http://www.chathamhouse.org.uk/files/3199_wp200904.pdf India's aid dynamics: from recipient to donor?] {{Webarchive|url=https://web.archive.org/web/20110617014553/http://www.chathamhouse.org.uk/files/3199_wp200904.pdf }}, Asia Programme Working Paper, September 2004, p. 4</ref> | |||
=== Asian Development Bank === | === Asian Development Bank === | ||
India has increased its loans from the [[Asian Development Bank]] (ADB) since 2005 after the introduction of new financing modalities, such as the multitranche financing facility (MFF) which features a framework agreement with the national government under which financing is provided in flexible tranches for subprojects that meet established selection criteria. In 2008 four MFFs for urban development investment programmes were under way in North [[Karnataka]] ({{USD}}862 million), [[Jammu and Kashmir (union territory)|Jammu and Kashmir]] ({{USD}}1,260 million), [[Rajasthan]] ({{USD}}450 million), and [[Uttarakhand]] ({{USD}}1,589 million). Included in these MFFs are major investments for the development of urban water supply and sanitation services.<ref>[https://archive.today/20130703163214/http://www.adb.org/features/country-water-action-testing-innovative-financing Asian Development Bank:Country Water Action: India. Testing Innovative Financing], December 2008</ref> | |||
India has increased its loans from the [[Asian Development Bank]] (ADB) since 2005 after the introduction of new financing modalities, such as the multitranche financing facility (MFF) which features a framework agreement with the national government under which financing is provided in flexible tranches for subprojects that meet established selection criteria. In 2008 four MFFs for urban development investment | |||
=== Germany === | === Germany === | ||
Germany supports access to water and sanitation in India through financial cooperation by [[KfW]] development bank and technical cooperation by [[GTZ|GIZ]]. Since the early 1990s both institutions have supported [[watershed management]] in rural [[Maharashtra]], using a participatory approach first piloted by the Social Centre in Ahmednagar and that constituted a fundamental break with the previous top-down, technical approach to watershed management that had yielded little results.<ref>In German: [http://www.jesuiten.de/jesuitenmission.ch/pdf/jhs2005_4.pdf Interview mit Pater Hermann Bacher SJ], Jesuiten 4/2005 {{dead link|date=June 2016|bot=medic}}{{cbignore|bot=medic}}</ref> The involvement of women in decision-making is an essential part of the project. While the benefits are mostly in terms of increased agricultural production, the project also increases availability of water resources for rural water supply.<ref>{{Cite web |date=2009 |title=Project – Erosion Protection in India. Getting Women Involved in Decision-Making Processes |url=http://www.kfw-entwicklungsbank.de/EN_Home/Development_policy_positions/Gender/Project_-_Erosion_protection_in_India.jsp |url-status=dead |archive-url=https://web.archive.org/web/20110727204443/http://www.kfw-entwicklungsbank.de/EN_Home/Development_policy_positions/Gender/Project_-_Erosion_protection_in_India.jsp |archive-date=27 July 2011 |website=[[KfW]]}}</ref> In addition, GIZ actively supports the introduction of [[ecological sanitation]] concepts in India, including community toilets and decentralised wastewater systems for schools as well as small and medium enterprises. Many of these systems produce biogas from wastewater, provide fertiliser and irrigation water.<ref>{{Cite web |date=2008 |title=Sustainable Sanitation in India. Examples from Indo-German Development Cooperation |url=http://www.gtz.de/en/dokumente/en-ecosan-sustainablesanitation-india-2008.pdf |url-status=dead |archive-url=https://web.archive.org/web/20110807122633/http://www.gtz.de/en/dokumente/en-ecosan-sustainablesanitation-india-2008.pdf |archive-date=7 August 2011 |publisher=[[Deutsche Gesellschaft für Internationale Zusammenarbeit]] (GTZ)}}</ref> | |||
=== Israel === | |||
Israel is providing advanced water management technology and expertise to India.<ref>{{Cite news |last=Jha |first=Ritu |date=23 November 2017 |title=India & Israel: Cooperation on water management |work=The Economic Times |url=https://economictimes.indiatimes.com/news/economy/agriculture/india-israel-cooperation-on-water-management/articleshow/61767010.cms |access-date=1 January 2023}}</ref><ref>{{Cite web |last= |date=13 August 2024 |title=India-Israel join hands for new water technology centre at IIT Madras |url=https://www.deccanherald.com/india/india-israel-join-hands-for-new-water-technology-centre-at-iit-madras-3148683 |access-date=30 September 2024 |website=Deccan Herald |language=}}</ref> | |||
===Israel=== | |||
Israel is providing advanced water management technology and expertise to India.<ref>{{Cite news |last=Jha |first=Ritu | | |||
=== Japan === | === Japan === | ||
As India's largest donor in the sector the [[Japan International Cooperation Agency]] (JICA) finances a multitude of projects with a focus on capital-intensive urban water supply and sanitation projects, often involving follow-up projects in the same locations. Projects approved between 2006 and 2009 cover parts of Assam, Kerala, the [[Hogenakkal Integrated Drinking Water Project|Hogenakkal Water Supply and Fluorosis Mitigation Project]] in Tamil Nadu, [[Goa]], [[Agra]], [[Punjab, India|Punjab]], [[Orissa, India|Orissa]], and [[Bangalore]].<ref>[[JICA]]:[http://www.jica.go.jp/english/operations/evaluation/oda_loan/economic_cooperation/index.html Ex-Ante Evaluation]. Retrieved 18 March 2010.</ref> | As India's largest donor in the sector the [[Japan International Cooperation Agency]] (JICA) finances a multitude of projects with a focus on capital-intensive urban water supply and sanitation projects, often involving follow-up projects in the same locations. Projects approved between 2006 and 2009 cover parts of Assam, Kerala, the [[Hogenakkal Integrated Drinking Water Project|Hogenakkal Water Supply and Fluorosis Mitigation Project]] in Tamil Nadu, [[Goa]], [[Agra]], [[Punjab, India|Punjab]], [[Orissa, India|Orissa]], and [[Bangalore]].<ref>[[JICA]]:[http://www.jica.go.jp/english/operations/evaluation/oda_loan/economic_cooperation/index.html Ex-Ante Evaluation]. Retrieved 18 March 2010.</ref> | ||
'''Evaluation of past projects'''. An ex-post evaluation of one large | '''Evaluation of past projects'''. An ex-post evaluation of one large programme, the Urban Water Supply and Sanitation Improvement Programme, showed that "some 60%–70% of the goals were achieved" and that "results were moderate". The programme was implemented by the [[Housing and Urban Development Corporation]] from 1996 to 2003 in 26 cities. The evaluation says that "state government plans were not based on sufficient demand research, including the research for residents' willingness to pay for services", so that demand for connections was overestimated. Also fees (water tariffs) were rarely increased despite recommendations to increase them. The evaluation concludes that "HUDCO was not able to make significant contributions to the effectiveness, sustainability, or overall quality of individual projects. One of the reasons that not much attention was given to this problem is probably that there was little risk of default on the loans thanks to state government guarantees."<ref>{{Cite web |last=Sonoda |first=Hajime |date=2005 |title=Urban Water Supply and Sanitation Improvement Program |url=http://www.jica.go.jp/english/operations/evaluation/oda_loan/post/2006/pdf/project33_full.pdf |url-status=dead |archive-url=https://web.archive.org/web/20110928015901/http://www.jica.go.jp/english/operations/evaluation/oda_loan/post/2006/pdf/project33_full.pdf |archive-date=28 September 2011 |website=Japan International Cooperation Agency}}</ref> | ||
=== World Bank === | === World Bank === | ||
The World Bank finances a number of projects in urban and rural areas that are fully or partly dedicated to water supply and sanitation. This includes support targeted towards the Ganga River Basin, municipal development in Andhra Pradesh, Karnataka, Tamil Nadu and in rural areas of Uttarakhand and Punjab. There are multiple projects and loans that go into hundreds of millions and billions of US dollars.<ref>{{Cite web | The World Bank finances a number of projects in urban and rural areas that are fully or partly dedicated to water supply and sanitation. This includes support targeted towards the Ganga River Basin, municipal development in Andhra Pradesh, Karnataka, Tamil Nadu and in rural areas of Uttarakhand and Punjab. There are multiple projects and loans that go into hundreds of millions and billions of US dollars.<ref>{{Cite web |title=Projects |url=https://www.worldbank.org/en/cpf/india/project |access-date=1 January 2023 |website=World Bank}}</ref> | ||
'''Evaluation of past projects'''. A study by the World Bank's independent evaluation department evaluated the impact of the World Bank-supported interventions in the provision of urban water supply and wastewater services in [[Mumbai]] between 1973 and 1990. It concluded that water supply and sewerage planning, construction and operations in Bombay posed daunting challenges to those who planned and implemented the investment | '''Evaluation of past projects'''. A study by the World Bank's independent evaluation department evaluated the impact of the World Bank-supported interventions in the provision of urban water supply and wastewater services in [[Mumbai]] between 1973 and 1990. It concluded that water supply and sewerage planning, construction and operations in Bombay posed daunting challenges to those who planned and implemented the investment programme. At the outset, there was a huge backlog of unmet demand because of underinvestment. Population and economic growth accelerated in the following decades and the proportion of the poor increased as did the slums which they occupied. The intended impacts of the programme have not been realised. Shortcomings include that "water is not safe to drink; water service, especially to the poor, is difficult to access and is provided at inconvenient hours of the day; industrial water needs are not fully met; sanitary facilities are too few in number and often unusable; and urban drains, creeks and coastal waters are polluted with sanitary and industrial wastes."<ref>{{cite web |title=India – Water Supply and Waste Water Services in Bombay: First, Second and Third Bombay Water Supply and Sewerage Projects |url=http://lnweb90.worldbank.org/oed/oeddoclib.nsf/DocUNIDViewForJavaSearch/0C21174E191C96F4852567F5005D38EF?opendocument |url-status=dead |archive-url=https://web.archive.org/web/20140705220115/http://lnweb90.worldbank.org/oed/oeddoclib.nsf/DocUNIDViewForJavaSearch/0C21174E191C96F4852567F5005D38EF?opendocument |archive-date=5 July 2014 |access-date=29 July 2015 |website=Independent Evaluation Group (IEG) – The World Bank Group}}</ref> | ||
==See also== | == See also == | ||
{{div col|colwidth=15em}} | {{div col|colwidth=15em}} | ||
* [[Cleanest cities in India]] | * [[Cleanest cities in India]] | ||
| Line 279: | Line 264: | ||
== Further reading == | == Further reading == | ||
* {{cite book |last1=Sridhar |first1=Kala Seetharam |url=https://books.google.com/books?id=VkyXKPBKJI0C&pg=PA41 |title=State of Urban Services in India's Cities: Spending and Financing |last2=Reddy |first2=A. Venugopal |date=2010 |publisher=Public Affairs Centre |isbn=9780198065388 |via=Google Books}} | |||
* {{cite book |last1=Sridhar |first1=Kala Seetharam |url=https://books.google.com/books?id=VkyXKPBKJI0C&pg=PA41 |title=State of Urban Services in India's Cities: Spending and Financing |last2=Reddy |first2=A. Venugopal |publisher=Public Affairs Centre |isbn=9780198065388 |via=Google Books}} | |||
* {{Cite book |last=Zerah |first=Marie-Helene |title=Water, unreliable supply in Delhi |publisher=Manohar [and] Centre de Sciences Humaines |year=2000 |isbn=8173043280}} | * {{Cite book |last=Zerah |first=Marie-Helene |title=Water, unreliable supply in Delhi |publisher=Manohar [and] Centre de Sciences Humaines |year=2000 |isbn=8173043280}} | ||
== External links == | == External links == | ||
* [http://www-wds.worldbank.org/external/default/WDSContentServer/WDSP/IB/2006/01/24/000090341_20060124094858/Rendered/PDF/34750.pdf World Bank:India's Water Economy:Bracing for a Turbulent Future, 2005] | * [http://www-wds.worldbank.org/external/default/WDSContentServer/WDSP/IB/2006/01/24/000090341_20060124094858/Rendered/PDF/34750.pdf World Bank: India's Water Economy:Bracing for a Turbulent Future, 2005] (PDF) | ||
* [http://water.worldbank.org/water/publications/sustaining-water-all-changing-climate-world-bank-group-implementation-progress-report/ Sustaining Water for All in a Changing Climate] The World Bank, 2010, Case Study on water resources in Andhra Pradesh, India. | * [http://water.worldbank.org/water/publications/sustaining-water-all-changing-climate-world-bank-group-implementation-progress-report/ Sustaining Water for All in a Changing Climate] The World Bank, 2010, Case Study on water resources in Andhra Pradesh, India. pp. 73–77. | ||
* Comprehensive Portal on Water in India: [http://www.indiawaterportal.org/ India Water Portal] | * Comprehensive Portal on Water in India: [http://www.indiawaterportal.org/ India Water Portal] | ||
* [https://web.archive.org/web/20080403042432/http://www.solutionexchange-un.net.in/en/Water/introduction.html Solution Exchange:Water Community in India] | * [https://web.archive.org/web/20080403042432/http://www.solutionexchange-un.net.in/en/Water/introduction.html Solution Exchange:Water Community in India] (archived) | ||
* Water and Environmental Sanitation Network India:[http://www.wesnetindia.org/ WES-Net India] {{Webarchive|url=https://web.archive.org/web/20210215222918/http://www.wesnetindia.org/ }} | * Water and Environmental Sanitation Network India:[http://www.wesnetindia.org/ WES-Net India]. {{Webarchive|url=https://web.archive.org/web/20210215222918/http://www.wesnetindia.org/ |date=15 February 2021 }}. | ||
* Asian Development Bank/Jawaharlal Nehru National Urban Renewal Mission: [http://www.adb.org/publications/2007-benchmarking-and-data-book-water-utilities-india 2007 Benchmarking and Data Book of Water Utilities in India] | * Asian Development Bank/Jawaharlal Nehru National Urban Renewal Mission: [http://www.adb.org/publications/2007-benchmarking-and-data-book-water-utilities-india 2007 Benchmarking and Data Book of Water Utilities in India] | ||
*[http://web.worldbank.org/WBSITE/EXTERNAL/TOPICS/EXTWSS/0,,contentMDK:20879544~menuPK:3810623~pagePK:210058~piPK:210062~theSitePK:337302,00.html World Bank:Reaching the Poor Through Sustainable Partnerships: The Slum Sanitation Program in Mumbai, India] | *[http://web.worldbank.org/WBSITE/EXTERNAL/TOPICS/EXTWSS/0,,contentMDK:20879544~menuPK:3810623~pagePK:210058~piPK:210062~theSitePK:337302,00.html World Bank:Reaching the Poor Through Sustainable Partnerships: The Slum Sanitation Program in Mumbai, India] | ||
* [https://web.archive.org/web/20100216181522/http://jnnurm.nic.in/nurmudweb/toolkit/Overview.pdf Jawaharlal Nehru National Urban Renewal Mission:Overview] | * [https://web.archive.org/web/20100216181522/http://jnnurm.nic.in/nurmudweb/toolkit/Overview.pdf Jawaharlal Nehru National Urban Renewal Mission:Overview] (archived) | ||
{{India topics|state=collapsed}} | {{India topics|state=collapsed}} | ||
Latest revision as of 03:01, 3 January 2026
Template:Infobox water supply and sanitation In 2018, 98.7% of Indians had access to the basic water and sanitation facilities.[1] India faces challenges ranging from sourcing water for its megacities to its distribution network which is intermittent in rural areas with continuous distribution networks just beginning to emerge. Non-revenue water is a challenge.
The share of Indians with access to improved sources of water increased significantly from 72% in 1990 to 88% in 2008 and stood at 98.7% in 2018.[2] In 1980, rural sanitation coverage was estimated at 1%. By 2018, it reached over 98%.[2][1]: However, many people still lack access to water and sewage infrastructure.
Water supply[edit | edit source]
Cities[edit | edit source]
In 2005, none among 35 Indian cities with populations above one million distributed water more than a few hours per day, despite generally sufficient infrastructure. Due inadequate water pressure, people struggled collecting water even when available.[3] Service benchmarking carried out 2006 across 28 cities found average supply duration around 3.3 hours daily, ranging from one hour every three days up 18 hours daily.[4] A 2007 study showed that 20 cities recorded average supply duration only 4.3 hours daily. Longest duration reached 12 hours daily at Chandigarh, while lowest remained 0.3 hours at Rajkot.[5] By 2015, 88% total population had access at least basic water,[lower-alpha 1] reaching 96% urban and 85% rural areas. Thus, nearly 150 million people still lacked access even basic water.[citation needed]
In Delhi land usage for residential area varies widely from planned colonies to unplanned slums. Despite the large piped network, with some areas receiving intermittent water supply, there are large areas that lack coverage.[6] Reliance on dubious private water vendors is costly. For example, in Delhi water trucks get water from illegal wells on the banks of the Yamuna River for ₹200 per cubic metre or ₹0.75 per US gallon ($2.6/m3 or 1 ¢/US gal).[7]

The supply of cities that depend on surface water is threatened by pollution, increasing water scarcity and conflicts among users. For example, Bangalore depends to a large extent on water pumped since 1974 from the Kaveri river, whose waters are disputed between the states of Karnataka and Tamil Nadu. As in other Indian cities, the response to water scarcity is to transfer more water over large distances at high costs. In the case of Bangalore, 500,000 cubic metres (18,000,000 cu ft) of water is pumped per day over a distance of 100 km (62 mi), thus increasing the city's supply by two-thirds.[10]
Jamshedpur provided 25% of its residents with continuous water supply in 2009.[11] In 2021, some parts of Mumbai got 24 hour supply, others got 19 hours supply or less.[12] Puri became the first city in India to get a piped 24 hour continuous drinking water quality water supply.[13] Trivandrum is the largest Indian city and the only million agglomeration that enjoys uninterrupted hygienic water supply.[14][better source needed] Chennai has two desalination plants: the Nemmeli and Minjur.[15]
Towns[edit | edit source]
Malkapur is the first Indian town to provide 24/7 water supply with 100 per cent coverage. The programme started in 2008 as a pilot project and soon covered the entire city. The connection is 100 per cent metered with telescopic tariff.[16]
Rural[edit | edit source]
Kaapil has been successful in providing continuous piped water supply to all households.[citation needed]
Other water sources[edit | edit source]
Rainwater harvesting[edit | edit source]
In the early 21st century, India began heavily investing in rainwater harvesting infrastructure and policy as an urgent response to water scarcity.[17] In 2001, Tamil Nadu became the first Indian state to make rainwater harvesting compulsory in every building to avoid groundwater depletion. In Rajasthan, rainwater harvesting has traditionally been practised by the people of the Thar Desert. Increase in rainwater harvesting efforts across the nation have revived ancient water harvesting systems in Rajasthan, such as the chauka system from the Jaipur district. Other large cities like Pune, Mumbai and Bangalore all have varying rules for mandatory rainwater harvesting, especially in new buildings. In 2002, the Municipal Corporation of Greater Mumbai required all new buildings over 1,000 square metres (11,000 sq ft) to have rainwater harvesting infrastructure.[18] The law was expanded in 2007 to 300 square metres (3,200 sq ft). The goal was to ensure buildings had enough water to last them through non-monsoon seasons. The process included a catchment system, an initial flush, and extensive filtering. As of 2021, the Brihanmumbai Municipal Corporation (BMC) reported 3000 newly constructed or redeveloped buildings with rainwater harvesting infrastructure.[19] However, many residents have complained that the stored water is contaminated, turning saline and brackish. Experts and residents argue that BMC authorities have done little to take implementation seriously, and the actual effectiveness of the rainwater harvesting mandate is unknown.[20]
While rainwater harvesting in an urban context has gained traction in recent years, evidence points toward rainwater harvesting in rural India since ancient times.[21] The type of system varied depending on the geography and culture of the region. Himachal Pradesh, for example, relied on kuhls,[22] a community-owned rainwater irrigation system. Maharashtra predominately used bhandara phads, a check dam which lowers the velocity of flow from rivers and reduces erosion. On the onset of British rule in the early 19th century, many of these systems were abandoned.[23] Environmentalists and scholars now believe that agricultural communities should revive ancient techniques to allow for rainwater harvesting to source the water needs of the community.[21]
Sanitation[edit | edit source]
.png)
A formal sanitation programme was first launched in 1954, followed by Central Rural Sanitation Programme in 1986, Total Sanitation Campaign (TSC) in 1999, Nirmal Bharat Abhiyan in 2012 and Swachh Bharat Mission in 2014.
In 2020, according to the World Bank data 72% Indians, 68% Pakistanis, and 54% Bangladeshi have access to the basic sanitation facilities.[27] In 2015, 44% had access to basic sanitation, or 65% in urban areas and 34% in rural areas.[28][1] In 2017, at least basic sanitation increased to 59.5%. Between 2014 and 2019, the Government in India has built around 110 million toilets, all across India, due to which the basic sanitation coverage went up from 38.7% in October 2014 to 93.3% in 2019.[29][30][31]
For years, most Indians depended on on-site sanitation facilities which means mainly pit latrines in rural areas. The government has been investing heavily in building sanitation units, in a nation-wide campaign called the Swachh Bharat Mission. Between 2014 and 2020, the Indian government managed to make household toilets accessible to over 99% of the population.[32] This translates to a total of 110 million toilets build since 2014, according to Statista. Preceding this success is the success of the Slum Sanitation Programme in Mumbai that has provided access to sanitation for a quarter million slum dwellers.[33][34] Sewage, where available, is often in a bad state. In Delhi the sewage network has lacked maintenance over the years and overflow of raw sewage in open drains is common, due to blockage, settlements and inadequate pumping capacities.[35] The capacity of the 17 existing wastewater treatment plants in Delhi is adequate to cater a daily production of waste water of less than 50% of the drinking water produced.[3] Of the 892 million people in the world that defecate openly, some 15 million live in India, making it the country with the highest number of people who defecate in the open.[36] This has serious public health implications.[citation needed]
A specific Indian problem is also the (officially prohibited) "manual scavenging" which is connected to the officially banned caste system,[37][38] and relates to unsafe and undignified emptying of toilets and pits, as well as handling of raw, untreated human excreta.

As of 2003, it was estimated, that only 27% of India's wastewater was being treated, with the remainder flowing into rivers, canals, groundwater or the sea.[39][40] For example, the sacred Ganges river is infested with diseases and in some places "the Ganges becomes black and septic. Corpses, of semi-cremated adults or enshrouded babies, drift slowly by."[35] In 2008, NewsWeek described Delhi's sacred Yamuna River as "a putrid ribbon of black sludge" where the concentration of fecal bacteria is 10,000 times the recommended safe maximum despite a 15-year programme to address the problem.[41] Cholera epidemics are not unknown.[41]

East Kolkata wetlands[edit | edit source]
In 2018, The Hindu reported that the East Kolkata wetlands, the world's largest biological sewage treatment facility, had been used to clean the sewage of Kolkata for several decades through the use of algae. This natural system, in use since the 1930s, was discovered by Dhrubajyoti Ghosh, an ecologist and municipal engineer in the 1970s, while he was working in the region.[42] Ghosh worked for decades to protect the wetlands.[43] It had been a practice in Kolkata, one of the five largest cities in India, for the municipal authorities to pump sewage into shallow ponds (bheris).[44] Under the heat of the tropical sun, algae proliferated in these bheris, converting the sewage into clean water, which in turn was used by villagers to grow paddy and vegetables. This almost 100-year-old system treats 750 million litres of wastewater per day, providing livelihoods for 100,000 people in the vicinity.[45] For his work, Ghosh was included in the UN Global 500 Roll of Honour in 1990 and received the Luc Hoffmann award in 2016.[46]
Health impact[edit | edit source]
The lack of adequate sanitation and safe water has significant negative health impacts including diarrhoea, referred to by travellers as the Delhi Belly (Travelers' diarrhea),[47] and experienced by about 10 million visitors annually.[48] The dismal working conditions of sewer workers are another concern. A survey of the working conditions of sewage workers in Delhi showed that most of them suffer from chronic diseases, respiratory problems, skin disorders, allergies, headaches and eye infections.[49] Various other cities in India have a record of unsafe drinking water. Municipal water in Visakhapatnam is contaminated with too much chlorine and pharmaceuticals which cause headache, short-term memory loss and loss of focus.[citation needed]
Responsibility for water supply and sanitation[edit | edit source]
According to the Indian Constitution, legislating regarding matters related to provision of drinking water supply and sanitation is responsibility of the State governments as it falls in the state list included in its seventh schedule. The 73rd and the 74th Amendment to the constitution required the state governments to devolve provision of drinking water and sanitation services to the Panchayati Raj Institutions (PRI) in rural areas or municipalities in urban areas, called Urban Local Bodies (ULB). At present, the arrangements for provision of these services vary. In some states, parastatal agencies are involved in provision of either of the two services or both. Further, within states, different arrangements are also observed for rural and urban areas. For example, in urban and rural areas of Kerala, drinking water is supplied by the Kerala Water Authority a parastatal agency. In Maharashtra on the other hand, ULBs provide drinking water supply in most urban areas, but Maharashtra Jeevan Pradhikaran provides drinking water in most rural areas and a few urban areas as well.[citation needed]
Highly centralised decision-making and approvals at the state level, which are characteristic of the Indian civil service, affect the management of water supply and sanitation services. For example, according to the World Bank in the state of Punjab the process of approving designs is centralised with even minor technical approvals reaching the office of chief engineers. A majority of decisions are made in a very centralised manner at the headquarters.[50] In 1993 the Indian constitution and relevant state legislations were amended in order to decentralise certain responsibilities, including water supply and sanitation, to municipalities. Since the assignment of responsibilities to municipalities is a state responsibility, different states have followed different approaches. According to a Planning Commission report of 2003 there is a trend to decentralise capital investment to engineering departments at the district level and operation and maintenance to district and gram panchayat levels.[51]
Policy and regulation[edit | edit source]
The responsibility for water supply and sanitation at the central and state level is shared by various Ministries. At the central level three Ministries have responsibilities in the sector: the Ministry of Drinking Water and Sanitation (until 2011 the Department of Drinking Water Supply in the Ministry of Rural Development) is responsible for rural water supply and sanitation; the Ministry of Housing and Urban Poverty Alleviation and the Ministry of Urban Development share the responsibility for urban water supply and sanitation. Except for the National Capital Territory of Delhi and other Union Territories, the central Ministries only have an advisory capacity and a limited role in funding. Sector policy thus is a prerogative of state governments.[citation needed]
National Urban Sanitation Policy. In November 2008 the government of India launched a national urban sanitation policy with the goal of creating what it calls "totally sanitised cities" that are open-defecation free, safely collect and treat all their wastewater, eliminate manual scavenging and collect and dispose solid waste safely. As of 2010, 12 states were in the process of elaborating or had completed state sanitation strategies on the basis of the policy. 120 cities are in the process of preparing city sanitation plans. Furthermore, 436 cities rated themselves in terms of their achievements and processes concerning sanitation in an effort supported by the Ministry of Urban Development with the assistance of several donors. About 40% of the cities were in the "red category" (in need of immediate remedial action), more than 50% were in the "black category" (needing considerable improvement) and only a handful of cities were in the "blue category" (recovering). Not a single city was included in the "green category" (healthy and clean city). The rating serves as a baseline to measure improvements in the future and to prioritise actions. The government intends to award a prize called Nirmal Shahar Puraskar to the best sanitation performers.[52]
Wastewater treatment[edit | edit source]

In India, wastewater treatment regulations come under three central institutions, the ministries of forest, climate change housing, urban affairs and water.[53] The various water and sanitation policies such as the "National Environment Policy 2006" and "National Sanitation Policy 2008" also lay down wastewater treatment regulations. State governments and local municipalities hold responsibility for the disposal of sewage and construction and maintenance of "sewerage infrastructure". Their efforts are supported by schemes offered by the Government of India, such as the National River Conservation Plan, Jawaharlal Nehru National Urban Renewal Mission, National Lake Conservation Plan. Through the Ministry of Environment and Forest, India's government also has set up incentives that encourage industries to establish "common facilities" to undertake the treatment of wastewater.[54]
Recent initiatives include the 'National Water Policy 2012' that promotes efficient use and water management, recycling and reuse of wastewater, water supply and sanitation, and efficient water pricing.[55]
Service provision[edit | edit source]
Urban areas. Institutional arrangements for water supply and sanitation in Indian cities vary greatly. Typically, a state-level agency is in charge of planning and investment, while the local government (Urban Local Bodies) is in charge of operation and maintenance.[14] Some of the largest cities have created municipal water and sanitation utilities that are legally and financially separated from the local government. However, these utilities remain weak in terms of financial capacity. In spite of decentralisation, ULBs remain dependent on capital subsidies from state governments. Tariffs are also set by state governments, which often even subsidise operating costs.[56] Furthermore, when no separate utility exists, there is no separation of accounts for different activities within a municipality. Some states and cities have non-typical institutional arrangements. For example, in Rajasthan the sector is more centralised and the state government is also in charge of operation and maintenance, while in Mumbai the sector is more decentralised and local government is also in charge of planning and investment.[14] In 2012 the Delhi Jal Board contracted out operations and management in three zones of the city to private companies under performance-based contracts to reduce non-revenue water. The Vasant Vihar-Mehrauli zone is operated by SMPL Infrastructure of India, Malviya Nagar by Suez Environnement and the Nangloi zone by Veolia Environnement.[57]
Private sector participation. The private sector plays a limited, albeit recently increasing role in operating and maintaining urban water systems on behalf of ULBs. For example, the Jamshedpur Utilities & Services Company (Jusco), a subsidiary of Tata Steel, has a lease contract for Jamshedpur (Jharkhand), a management contract in Haldia (West Bengal), another contract in Mysore (Karnataka) and since 2007 a contract for the reduction of non-revenue water in parts of Bhopal (Madhya Pradhesh).[58] The French water company Veolia won a management contract in three cities in Karnataka in 2005.[59][60] In 2002 a consortium including Thames Water won a pilot contract covering 40,000 households to reduce non-revenue water in parts of Bangalore, funded by the Japan Bank for International Cooperation. The contract was scaled up in 2004.[61] The Cypriot company Hydro-Comp, with two Indian companies, won a 10-year concession contract for the city of Latur City (Maharashtra) in 2007 and an operator-consultant contract in Madurai (Tamil Nadu).[62] Furthermore, the private Indian infrastructure development company SPML is engaged in build-operate-transfer (BOT) projects, such as a bulk water supply project for Bhiwandi (Maharashtra).[63] In 2023, NeeRain a government supported start-up was able to save 60,000 liters of water each year through innovation by installing their patented technologies across multiple location in India.[64][65]
Rural areas. There are about a 100,000 rural water supply systems in India. At least in some states, responsibility for service provision is in the process of being partially transferred from State Water Boards and district governments to Panchayati Raj Institutions (PRI) at the block or village level (there were about 604 districts and 256,000 villages in India in 2002, according to Subdivisions of India. Blocks are an intermediate level between districts and villages). Where this transfer has been initiated, it seems to be more advanced for single-village water schemes than for more complex multi-village water schemes. Despite their professed role Panchayati Raj Institutions, play only a limited role in provision of rural water supply and sanitation as of 2006. There has been limited success in implementing decentralisation, partly due to low priority by some state governments.[50] Rural sanitation is typically provided by households themselves in the form of latrines.
Innovative approaches[edit | edit source]
A number of innovative approaches to improve water supply and sanitation have been tested in India, in particular in the early 2000s. These include community-led total sanitation, demand-driven approaches in rural water supply, a public-private partnerships to improve the continuity of urban water supply in Karnataka, and the use of microcredits in water supply and sanitation to women in order to improve access to water.[citation needed]
Total Sanitation Campaign[edit | edit source]
In 1999 a demand-driven and people-centred sanitation programme was initiated under the name Total Sanitation Campaign (TSC) which has some similarities with community-led total sanitation (CLTS), but is not the same. It evolved from the limited achievements of the first structured programme for rural sanitation in India, the Central Rural Sanitation Programme, which had minimal community participation. The main goal of Total Sanitation Campaign is to eradicate the practice of open defecation by 2017. Community-led total sanitation is not focused on building infrastructure, but on preventing open defecation through self-awareness and shame. In Maharashtra where the programme started more than 2000 Gram Panchayats have achieved "open defecation free" status. Villages that achieve this status receive monetary rewards and high publicity under a programme called Nirmal Gram Puraskar.[66][67]
A new sanitation campaign was launched as Swachh Bharat Abhiyan (Clean India Mission) in October 2014.[68]
As of 1 December 2017, Total Sanitation Coverage throughout India has risen to 73% up from 42% on 2 October 2014, the day Swachh Bharat Abhiyan was launched.[69]
Demand-driven approaches in rural water supply[edit | edit source]
Most rural water supply schemes in India use a centralised, supply-driven approach, i.e. a government institution designs a project and has it built with little community consultation and no capacity building for the community, often requiring no water fees to be paid for its subsequent operation. Since 2002 the Government of India has rolled out at the national level a programme to change the way in which water and sanitation services are supported rural areas. The programme, called Swajaldhara, decentralises service delivery responsibility to rural local governments and user groups. Under the new approach communities are being consulted and trained, and users agree up-front to pay a tariff that is set at a level sufficiently high to cover operation and maintenance costs. It also includes measures to promote sanitation and to improve hygiene behaviour. The national programme follows a pilot programme launched in 1999.[70]
According to a 2008 World Bank study in 10 Indian states, Swajaldhara results in lower capital costs, lower administrative costs and better service quality compared to the supply-driven approach. In particular, the study found that the average full cost of supply-driven schemes is ₹38 per cubic metre or ₹1.1 per cubic foot (87 ¢/m3 or 2.5 ¢/cu ft), while it is only ₹26/m3 or ₹0.74/cu ft (60 ¢/m3 or 1.7 ¢/cu ft) for demand-driven schemes. These costs include capital, operation and maintenance costs, administrative costs and coping costs incurred by users of malfunctioning systems. Coping costs include travelling long distances to obtain water, standing in long queues, storing water and repairing failed systems. Among the surveyed systems that were built using supply-driven approach system breakdowns were common, the quantity and quality of water supply were less than foreseen in designs, and 30% of households did not get daily supply in summer. The poor functioning of one system sometimes leads to the construction of another system, so that about 30% of households surveyed were served by several systems. As of 2008 only about 10% of rural water schemes built in India used a demand-driven approach. Since water users have to pay lower or no tariffs under the supply-driven approach, this discourages them to opt for a demand-driven approach, even if the likelihood of the systems operating on a sustainable basis is higher under a demand-driven approach.[71]
Achieving continuous water supply in Karnataka[edit | edit source]
In the cities of Hubli, Belgaum and Gulbarga in the state of Karnataka, the private operator Veolia increased water supply from once every 2–15 days for 1–2 hours, to 24 hours per day for 180,000 people (12% of the population of the 3 cities) within 2 years (2006–2008). This was achieved by carefully selecting and ring-fencing demonstration zones (one in each city), renovating the distribution network, installing meters, introducing a well-functioning commercial system, and effective grass-roots social intermediation by an NGO, all without increasing the amount of bulk water supplied. The project, known by its acronym as KUWASIP (Karnataka Urban Water Sector Improvement Project), was supported by a US$39.5 million loan from the World Bank. It constitutes a milestone for India, where no large city so far has achieved continuous water supply. The project is expected to be scaled-up to cover the entire area of the three cities.[4][59][60] Karnataka Urban Infrastructure Development & Finance Corporation (KUIDFC) has taken up North Karnataka Urban Sector Investment Programme (NKUSIP) covering 25 towns. Ilkal is one of the Project town, where 24 X 7 water supply project was implemented. The construction activities commenced in February 2013 and 24 X 7 water supply is commissioned in September 2015. The system is running successfully since then.[72]
Microcredit for water connections in Tamil Nadu[edit | edit source]
In Tiruchirapalli in Tamil Nadu, the NGO Gramalaya, established in 1987, and women self-help groups promote access to water supply and sanitation by the poor through microcredit. Among the benefits are that women can spend more time with their children, earn additional income, and sell surplus water to neighbours. This money contributes to her repayment of the WaterCredit loan. The initiative is supported by the US-based non-profit Water Partners International.[73]
Jamshedpur Utilities and Services Company[edit | edit source]
The Jamshedpur Utilities and Services Company (JUSCO) provides water and sanitation services in Jamshedpur. Until 2004 a division of Tata Steel provided water to the city's residents. However, service quality was poor with intermittent supply, high water losses and no metering.[11] To improve this situation and to establish good practices that could be replicated in other Indian cities, JUSCO was set up as a wholly owned subsidiary of Tata Steel in 2004.
Efficiency and service quality improved substantially over the following years. The level on non-revenue water decreased from an estimated 36% in 2005 to 10% in 2009; one quarter of residents received continuous water supply (although the average supply remained at only 7 hours per day) in 2009; the share of metered connections increased from 2% in 2007 to 26% in 2009; the number of customers increased; and the company recovered its operating costs plus a portion of capital costs. Identifying and legalising illegal connections was an important element in the reduction of non-revenue water. The utility prides itself today of the good drinking water quality provided and encourages its customers to drink from the tap. The utility also operates a wastewater treatment plant that meets discharge standards. The private utility pays salaries that are higher than civil service salaries and conducts extensive training programmes for its staff. It has also installed a modern system to track and resolve customer complaints. Furthermore, it conducts independent annual customer satisfaction surveys. Together with Ranhill Malaysia it won a 25-year concession contract for providing the water supply in Haldia City, West Bengal.[11]
Fecal sludge management[edit | edit source]
Many small and medium towns in India have started deploying fecal sludge management (FSM) for dealing with human excreta instead of waiting for sewerage systems. It deals with excreta contained in on-site sanitation systems like pits and septic tanks (called as fecal sludge). It involves removal of fecal sludge from on-site sanitation system its conveyance to a facility where it is treated. In sewerage systems, sizeable share of the capital expenditure is towards laying network. [citation needed] In deploying FSM, the waste is conveyed through vacuum emptier trucks or other vehicles using existing road network, thereby drastically reducing the capital expenditure. [citation needed] Already 30 towns have FSM services operational and they are at various stages of planning in 700 other towns across the country.[74] It is rapidly being adopted in the states of Maharashtra, Rajasthan, Uttar Pradesh, Odisha, Andhra Pradesh, Telangana, and Tamil Nadu with support of members of the NFSSM Alliance.[74]
Efficiency of utilities[edit | edit source]
There are only limited data on the operating efficiency of utilities in India, and even fewer data on the efficiency of investments. Two indicators of operating efficiency are non-revenue water and labour productivity.
Non-revenue water. According to the results of a service level benchmarking (SLB) programme carried out by the Ministry of Urban Development (MoUD) in 2006 in 28 cities, the average level of non-revenue water (NRW) was 44 per cent.[4] Another study of 20 cities by the Jawaharlal Nehru National Urban Renewal Mission with the support of the Asian Development Bank showed an average level of non-revenue water (NRW) of 32%. However, 5 out of the 20 cities did not provide any data. For those that provided data there probably is a large margin of error, since only 25% of connections are metered, which makes it very difficult to estimate non-revenue water. Also, three utilities in the sample show NRW levels of less than 20%, two of which have practically no metering, which indicates that the numbers are not reliable and actual values are likely to be higher.[5] In Delhi, which was not included in the ADB study, non-revenue water stood at 53% and there were about 20 employees per 1000 connections. Furthermore, only 70% of revenue billed was actually collected.
Labour productivity. Concerning labour productivity, the 20 utilities in the sample had on average 7.4 employees per 1,000 connections, which is much higher than the estimated level for an efficient utility.[5] A survey of a larger sample of Indian utilities showed an average ratio of 10.9 employees per 1,000 connections.[14]
Tariffs, cost recovery and subsidies[edit | edit source]
Water and sewer tariffs in India are low in both urban and rural areas. In urban areas they were set at the equivalent of about 10 ¢/m3 (0.28 ¢/cu ft) in 2007 and recovered about 60% of operating and maintenance costs, with large differences between cities. Some cities such as Kolkata do not bill residential users at all. In rural areas the level of cost recovery often is even lower than in urban areas and was estimated at only 20% in rural Punjab. Subsidies were estimated at US$1.1 billion per year in the mid-1990s, accounting to 4% of all government subsidies in India. 70% of those benefiting from the subsidies are not poor.
Urban areas[edit | edit source]
Metering. Water metering is the precondition for billing water users on the basis of volume consumed. Estimates of the share of customers metered vary depending on the study quoted. According to the results of a service level benchmarking (SLB) rogram carried out by the Ministry of Urban Development in 2006 in 28 cities, the share of metering was 50 per cent.[4] According to a 1999 survey of 300 cities about 62% of urban water customers in metropolitan areas and 50% in smaller cities are metered (average 55%). However, meters often do not work so that many "metered" customers are charged flat rates. Bangalore and Pune are among the few Indian cities that meter all their customers. Many other cities have no metering at all or meter only commercial customers.[14] Users of standposts receive water free of charge. A 2007 study of 20 cities by the Jawaharlal Nehru National Urban Renewal Mission with the support of the Asian Development Bank (ADB) showed that only 25% of customers of these utilities were metered. Most other customers paid a flat tariff independent of consumption. Some utilities, such as the one serving Kolkata, actually do not bill residential users at all.[75]
Tariff levels. According to the same ADB study the average tariff for all customers – including industrial, commercial and public customers – is ₹4.9 per cubic metre or ₹0.14 per cubic foot (12 ¢/m3 or 0.34 ¢/cu ft).[5] According to a 2007 global water tariff survey by the OECD the residential water tariff for a consumption of 15 m3 (530 cu ft) was equivalent to $0.15/m3 ($0.0042/cu ft) in Bangalore, $0.12/m3 ($0.0034/cu ft) in Calcutta, $0.11/m3 ($0.0031/cu ft) in New Delhi and $0.09/m3 ($0.0025/cu ft) in Mumbai. Only Bangalore had a sewer tariff of $0.02/m3 ($0.00057/cu ft). The other three cities did not charge for sewerage, although the better-off tend to be the ones with access to sewers.[76]
Tariff structure. The tariff for customers that are effectively metered is typically a uniform linear tariff, although some cities apply increasing-block tariffs.[14]
Affordability. Urban water tariffs were highly affordable according to data from the year 2000. A family of five living on the poverty line which uses 20 cubic metres (710 cu ft) of water per month would spend less than 1.2% of its budget on its water bill if it had a water meter. If it did not have a water meter and was charged a flat rate, it would pay 2.0% of its budget. This percentage lies below the often used affordability threshold of 5%. However, at that time the average metered tariff was estimated at only $0.03/m3 ($0.00085/cu ft), or less than three times what it was estimated to be in 2007.[77] Apparently no more up-to-date estimates on the share of the average water bill in the budget of the poor are available.
Cost recovery. According to a 2007 study of 20 cities the average rate of cost recovery for operating and maintenance costs of utilities in these cities was 60%. Seven of the 20 utilities generated a cash surplus to partially finance investments. Chennai generated the highest relative surplus. The lowest cost recovery ratio was found in Indore in Madhya Pradesh, which recovered less than 20% of its operating and maintenance costs.[5] According to the results of a service level benchmarking (SLB) programme carried out by the Ministry of Urban Development in 2006 in 28 cities, cost recovery was 67% on average.[4]
Delhi example. Between 2011 and 2013 Delhi Jal Board (DJB) has increased its revenues by 50 per cent and reduced operating subsidies from the National Capital Territory of Delhi. It owes ₹350 billion (US$4.9 billion) in debt, but hopes that the debt will be converted into a grant. The utility focuses on improving its customer database, meter reading through hand-held devices, billing and bill collection under a new manager, Debashree Mukherjee, who took the helm of the utility in 2012.[57] As of 2004, in Delhi revenues were just sufficient to cover about 60% of operating costs of DJB; maintenance was, as a result, minimal. In the past, the Delhi utility has relied heavily on government financial support for recurrent and capital expenditures in the magnitude of ₹3 billion (US$42.1 million) per year and ₹7 billion (US$98.1 million) respectively. Accounts receivable represent more than 12 months of billing, part of it being non-recoverable.[3] The average tariff was estimated at US$0.074/m3 in 2001, compared to production costs of US$0.085/m3, the latter probably being a very conservative estimate that does not take into account capital costs.[78]
Challenges faced in attempting to increase tariffs. Even if users are willing to pay more for better services, political interests often prevent tariffs from being increased even to a small extent. An example is the city of Jabalpur where the central government and the state government financed a ₹130 million (US$1.8 million) water supply project from 2000–2004 to be operated by the Jabalpur Municipal Corporation, an entity that collected only less than half of its operational costs in revenues even before this major investment. Even so, the municipal corporation initially refused to increase tariffs. Only following pressure from the state government it reluctantly agreed to increase commercial tariffs, but not residential tariffs.[79]
Rural areas[edit | edit source]
Cost recovery in rural areas is low and a majority of the rural water systems are defunct for lack of maintenance. Some state governments subsidise rural water systems, but funds are scarce and insufficient.[80] In rural areas in Punjab, operation and maintenance cost recovery is only about 20%. On one hand, expenditures are high due to high salary levels, high power tariff and a high number of operating staff. On the other hand, revenue is paid only by the 10% of the households who have private connections. Those drawing water from public stand posts do not pay any water charges at all, although the official tariff for public stand post users is ₹15 (21¢ US) per month per household.[50]
Subsidies and targeting of subsidies[edit | edit source]
There are no accurate recent estimates of the level of subsidies for water and sanitation in India. It has been estimated that transfers to the water sector in India amounted to ₹54,708 million (US$767.0 million) per year in the mid-1990s, accounting for 4% of all government subsidies in India. About 98% of this subsidy is said to come from State rather than Central budgets.[81] This figure may only cover recurrent cost subsidies and not investment subsidies, which are even higher (see below). There is little targeting of subsidies. According to the World Bank, 70% of those benefiting from subsidies for public water supply are not poor, while 40% of the poor are excluded because they do not have access to public water services.[82]
Investment and financing[edit | edit source]
Investment in urban water supply and sanitation has increased during the first decade of the 21st century, not least thanks to increased central government grants made available under Jawaharlal Nehru National Urban Renewal Mission under the Congress government until 2014 and the Swachh Bharat Abhiyan (Clean India Mission) under the BJP government since 2014, alongside loans from the Housing and Urban Development Corporation.
Investment[edit | edit source]
The Eleventh Five-Year Plan (2007–2012) foresaw investments of ₹1,270.25 billion (US$17.8 billion) for urban water supply and sanitation, including urban (stormwater) drainage and solid waste management.[83]
Financing[edit | edit source]
The funding of government programmes for water supply and sanitation is shared by the central government, states and other contributors, with the share contributed by various stakeholders varying between programmes and over time. For example, as of 2016 the states pay 60% and the central government pays 40% for investments financed under the Clean India Mission and the National Rural Drinking Water Programme. Until 2015 the central government had funded 75% of the Clean India Mission.[84]
Under the 11th Plan (2007–12) 55% of the investments were to be financed by the central government, 28% by state governments, 8% by "institutional financing" such as HUDCO, 8% by external agencies and 1.5% by the private sector. Local governments were not expected to contribute to the investments. The volume of investments was expected to double to reach 0.7% of GDP. Also, it implied a shift in financing from state governments to the central government.[83] During the 9th Plan only 24% of investments were financed by the central government and 76% by state governments. Central government financing was heavily focused on water supply in rural areas.[85]
Institutions[edit | edit source]
The current system of financing water supply and sanitation is fragmented through a number of different national and state programmes. This results in simultaneous implementation with different and conflicting rules in neighbouring areas. For example, in rural areas different programmes undermine each other, adversely affecting demand driven approaches requiring cost sharing by users.
State budgets the major source of financing for water supply and sanitation. State Financing Corporations (SFC) play an important role in making recommendations regarding the allocation of state tax revenues between states and municipalities, criteria for grants, and measures to improve the financial position of municipalities. According to the Planning Commission, SFCs are in some cases not sufficiently transparent and/or competent, have high transactions costs, and their recommendations are sometimes not being implemented.[86] An important source of financing are loans from Housing and Urban Development Corporation Ltd (HUDCO), a Central government financial undertaking. HUDCO loans to municipal corporations need to be guaranteed by state governments. HUDCO also on-lends loans from foreign aid, including Japanese aid, to states. The Jawaharlal Nehru National Urban Renewal Mission (2005–2014) played an important role in financing urban water supply and sanitation through central government grants. However, its grants were limited to the 35 largest cities in the country and 28 other selected cities, so that most cities with less than 1 million inhabitants were not eligible to receive grants from this mission. It was replaced by the Atal Mission for Rejuvenation and Urban Transformation (AMRUT), the new government's flagship programme for urban development. In addition, in 2014 the new government announced its high-profile Swachh Bharat Abhiyan (Clean India Mission) that aims at eradicating open defecation by 2019, covering 4,041 cities and towns. The programme has received funding and technical support from the World Bank, corporations and state governments under the Sarva Shiksha Abhiyan and Rashtriya Madhyamik Shiksha Abhiyan schemes.[87] Swachh Bharat Abhiyan is expected to cost over ₹620 billion (US$8.7 billion).[88] An amount of ₹90 billion (US$1.3 billion) was allocated for the mission in 2016 Union budget of India.[89] In 2015 the government introduced a 0.5% service tax on air travel, telephony, eating out and banking to finance the Clean India Campaign.[90] A budget tracking study revealed that the shift of policy focus from water to sanitation as part of the Clean India Campaign has resulted in a cut in government spending on rural water supply. A Parliamentary Standing Committee report found that the government would be unable to achieve its 2017 target of providing 50% rural households with piped water.[91]
During the 2019 Independence Day of India, Prime Minister Narendra Modi confirmed that the target of half of the country's households provided of piped water wasn't reached. He also announced that the Government had decided to promote the Jal Jeevan Mission with a starting endowment fund of Rs 3.5 trillion and the goal "to provide to all households in rural India safe and adequate water through individual household tap connections by 2024".[92] The Jal Jeevan Mission subsumed the older National Rural Drinking Water Programme (NRDWP), preserving the goal "to provide Functional Household Tap Connection (FHTC) to every rural household" by 2024.[93] At the 107th Indian Science Congress held in January 2020 in Bengaluru, Modi declared that "technology is the strength of the Jal Jeevan Mission" and young Indian scientists have the "responsibility to develop cheap and effective technology for the recycling of water", which represents a new frontier for all of them.[94]
In 1996 Tamil Nadu introduced a public-private partnership, the Tamil Nadu Urban Development Fund (TNUDF), to channel both grants and loans to cities in the state. TNUDF has received funding from the World Bank, Japanese JICA and KfW from Germany. It also mobilises funding from the capital market through a water and sanitation pooled fund, under which several municipalities joined to issue a bond in the local market. TNUDF so far is the only functioning state-level fund that channels loans to ULBs in India.[95] In 2012 the state of Orissa has created an Urban Development Fund modelled on the example of Tamil Nadu.
External cooperation[edit | edit source]
In absolute terms India receives almost twice as much development assistance for water, sanitation and water resources management as any other country, according to data from the Organisation for Economic Co-operation and Development. India accounts for 13 per cent of commitments in global water aid for 2006–07, receiving an annual average of about US$830 million (€620 million), more than double the amount provided to China. India's biggest water and sanitation donor is Japan, which provided US$635 million, followed by the World Bank with US$130 million.[96][97] The annual average for 2004–06, however, was about half as much at US$448 million, of which Japan provided US$293 million and the World Bank US$87 million.[98] The Asian Development Bank and Germany are other important external partners in water supply and sanitation.
In 2003 the Indian government decided it would only accept bilateral aid from five countries (the United Kingdom, the United States, Russia, Germany and Japan). A further 22 bilateral donors were asked to channel aid through nongovernmental organisations, United Nations agencies or multilateral institutions such as the European Union, the Asian Development Bank or the World Bank.[99]
Asian Development Bank[edit | edit source]
India has increased its loans from the Asian Development Bank (ADB) since 2005 after the introduction of new financing modalities, such as the multitranche financing facility (MFF) which features a framework agreement with the national government under which financing is provided in flexible tranches for subprojects that meet established selection criteria. In 2008 four MFFs for urban development investment programmes were under way in North Karnataka (US$862 million), Jammu and Kashmir (US$1,260 million), Rajasthan (US$450 million), and Uttarakhand (US$1,589 million). Included in these MFFs are major investments for the development of urban water supply and sanitation services.[100]
Germany[edit | edit source]
Germany supports access to water and sanitation in India through financial cooperation by KfW development bank and technical cooperation by GIZ. Since the early 1990s both institutions have supported watershed management in rural Maharashtra, using a participatory approach first piloted by the Social Centre in Ahmednagar and that constituted a fundamental break with the previous top-down, technical approach to watershed management that had yielded little results.[101] The involvement of women in decision-making is an essential part of the project. While the benefits are mostly in terms of increased agricultural production, the project also increases availability of water resources for rural water supply.[102] In addition, GIZ actively supports the introduction of ecological sanitation concepts in India, including community toilets and decentralised wastewater systems for schools as well as small and medium enterprises. Many of these systems produce biogas from wastewater, provide fertiliser and irrigation water.[103]
Israel[edit | edit source]
Israel is providing advanced water management technology and expertise to India.[104][105]
Japan[edit | edit source]
As India's largest donor in the sector the Japan International Cooperation Agency (JICA) finances a multitude of projects with a focus on capital-intensive urban water supply and sanitation projects, often involving follow-up projects in the same locations. Projects approved between 2006 and 2009 cover parts of Assam, Kerala, the Hogenakkal Water Supply and Fluorosis Mitigation Project in Tamil Nadu, Goa, Agra, Punjab, Orissa, and Bangalore.[106]
Evaluation of past projects. An ex-post evaluation of one large programme, the Urban Water Supply and Sanitation Improvement Programme, showed that "some 60%–70% of the goals were achieved" and that "results were moderate". The programme was implemented by the Housing and Urban Development Corporation from 1996 to 2003 in 26 cities. The evaluation says that "state government plans were not based on sufficient demand research, including the research for residents' willingness to pay for services", so that demand for connections was overestimated. Also fees (water tariffs) were rarely increased despite recommendations to increase them. The evaluation concludes that "HUDCO was not able to make significant contributions to the effectiveness, sustainability, or overall quality of individual projects. One of the reasons that not much attention was given to this problem is probably that there was little risk of default on the loans thanks to state government guarantees."[107]
World Bank[edit | edit source]
The World Bank finances a number of projects in urban and rural areas that are fully or partly dedicated to water supply and sanitation. This includes support targeted towards the Ganga River Basin, municipal development in Andhra Pradesh, Karnataka, Tamil Nadu and in rural areas of Uttarakhand and Punjab. There are multiple projects and loans that go into hundreds of millions and billions of US dollars.[108]
Evaluation of past projects. A study by the World Bank's independent evaluation department evaluated the impact of the World Bank-supported interventions in the provision of urban water supply and wastewater services in Mumbai between 1973 and 1990. It concluded that water supply and sewerage planning, construction and operations in Bombay posed daunting challenges to those who planned and implemented the investment programme. At the outset, there was a huge backlog of unmet demand because of underinvestment. Population and economic growth accelerated in the following decades and the proportion of the poor increased as did the slums which they occupied. The intended impacts of the programme have not been realised. Shortcomings include that "water is not safe to drink; water service, especially to the poor, is difficult to access and is provided at inconvenient hours of the day; industrial water needs are not fully met; sanitary facilities are too few in number and often unusable; and urban drains, creeks and coastal waters are polluted with sanitary and industrial wastes."[109]
See also[edit | edit source]
- Cleanest cities in India
- Climate of India
- Environment of India
- Kalpasar Project
- Interstate River Water Disputes Act
- List of drainage basins by area
- List of rivers of India by discharge
- List of rivers by discharge
- List of rivers by dissolved load
- List of dams and reservoirs in India
- List of water supply and sanitation by country
- National Water Policy
- Polavaram Project
- Pollution of the Ganges
- Sanitation worker
- Saemangeum Seawall
- Water scarcity in India
- Water pollution in India
References[edit | edit source]
- Notes
- ↑ Term "at least basic water" introduced new[update], related previous term "improved water source". Under Indian norms, access improved water supply exists when at least 40 litres (8.8 imp gal; 11 US gal) per person daily safe drinking water available within 1.6 kilometres (0.99 mi) distance or 100 metres (330 ft) elevation difference, relaxed as per field conditions. One pump required per 250 persons.[according to whom?]
- Citations
- ↑ 1.0 1.1 1.2 Cite error: Invalid
<ref>tag; no text was provided for refs namedNITI Aayog 2017 - ↑ 2.0 2.1 UNICEF/WHO Joint Monitoring Programme for Water Supply and Sanitation estimate for 2008 based on the 2006 Demographic and Health Survey, the 2001 census, other data and the extrapolation of previous trends to 2010.
- ↑ 3.0 3.1 3.2 "Project Information Document (PID) Concept Stage. Delhi Water Supply & Sewerage". World Bank. Archived from the original on 1 January 2023. Retrieved 1 January 2023.
- ↑ 4.0 4.1 4.2 4.3 4.4 "The Karnataka Urban Water Sector Improvement Project: 24x7 Water Supply is Achievable" (PDF) (Field Note). World Bank Water and Sanitation Program (WSP). September 2010. Archived from the original (PDF) on 20 January 2016. Retrieved 20 August 2012.
- ↑ 5.0 5.1 5.2 5.3 5.4 2007 Benchmarking and Data Book of Water Utilities India. Asian Development Bank, Government of India. 2007. p. 3. ISBN 978-971-561-648-5.
- ↑ Aijaz, Rumi (8 June 2020). "Water supply in Delhi: Five key issues". ORF. Retrieved 2 January 2023.
- ↑ Sethi, Aman (2015). "At the Mercy of the Water Mafia, Foreign Policy, July/August 2015". Foreign Policy. Retrieved 11 October 2015.
- ↑ Sharma, Harikishan (29 November 2019). "12% of urban India relies on bottled water, 1 in 4 homes has a purifier". The Indian Express. Retrieved 12 January 2023.
- ↑ "Household Water Filter Evaluation Ahmedabad, India", Comprehensive Initiative on Technology Evaluation at the Massachusetts Institute of Technology, 2015
- ↑ Rao, Lalitha (17 August 2009). "Stage-IV of Cauvery water supply scheme underway". Project Monitor. Archived from the original on 15 July 2011.
- ↑ 11.0 11.1 11.2 Every Drop Counts: Learning from Good Practices in Eight Asian Cities. Asian Development Bank. 2010. p. 22. ISBN 978-92-9092-030-4.
- ↑ Singh, Laxman (5 March 2021). "Mumbai: BMC set to wind up project supplying 24-hr water to city". The Indian Express. Retrieved 5 January 2023.
- ↑ Wallen, Joe (17 August 2021). "How Puri became the first Indian city to provide clean drinking water for all". The Telegraph. ISSN 0307-1235. Retrieved 5 January 2023.
- ↑ 14.0 14.1 14.2 14.3 14.4 14.5 Cite error: Invalid
<ref>tag; no text was provided for refs namedNational Institute of Urban Affairs 2005 - ↑ "Chennai to get more desal after Nemmeli award". Global Water Intelligence. 7 January 2010. Retrieved 1 January 2023.
- ↑ "Malkapur 24X7 Water Supply Scheme" (PDF). Malkapur Nagarpanchayat, Maharashtra Jeevan Pradhikaran.
- ↑ Kumar, M. Dinesh; Ghosh, Shantanu; Patel, Ankit; Singh, Om Prakash; Ravindranath, R.; Kumar, M. Dinesh; Ghosh, Shantanu; Patel, Ankit; Singh, Om Prakash; Ravindranath, R. (2006). Kumar, M. Dinesh; Ghosh, Shantanu; Patel, Ankit; Singh, Om Prakash; Ravindranath, R. (eds.). "Rainwater harvesting in India: some critical issues for basin planning and research". Land Use and Water Resources Research. doi:10.22004/ag.econ.47964.
- ↑ Button, Cat (4 May 2017). "Domesticating water supplies through rainwater harvesting in Mumbai". Gender & Development. 25 (2): 269–282. doi:10.1080/13552074.2017.1339949. ISSN 1355-2074. S2CID 80471348.
- ↑ "India Rainwater Harvesting Market, By Type (Rain Barrel System, Dry System, Wet System, Green Roof System), By Harvesting Method (Above Ground {Ground Surface and Storage Tank}, Under Ground), By Application (Residential, Commercial, Industrial and Agricultural), By Region, By Competition Forecast & Opportunities, 2018–2028". TechSci Research.
- ↑ Johari, Aarefa (17 July 2019). "Mumbai could save water through its mandatory rainwater harvesting rule – but no one seems to care". Scroll.in. Retrieved 12 May 2023.
- ↑ 21.0 21.1 Pandey, Deep Narayan; Gupta, Anil K.; Anderson, David M. (2003). "Rainwater harvesting as an adaptation to climate change". Current Science. 85 (1): 46–59. ISSN 0011-3891. JSTOR 24107712.
- ↑ "Kuhl, kohli and a lost tradition". India Water Portal Hindi. Retrieved 10 May 2023.
- ↑ "Rainwater harvesting in India: Traditional and contemporary". India Water Portal Hindi. Retrieved 10 May 2023.
- ↑ "JMP". washdata.org. Archived from the original on 11 September 2024. Retrieved 11 September 2024. Alt URL
- ↑ "Share of people practicing open defecation". Our World in Data. Retrieved 16 August 2024.
- ↑ HARUNA KASHIWASE (17 November 2023). "World Toilet Day: 420 million people are defecating outdoors". blogs.worldbank.org. Retrieved 21 August 2024.
- ↑ "People using at least basic sanitation services (% of population) | Data". data.worldbank.org. Retrieved 8 May 2022.
- ↑ "India". WASHwatch.org. Archived from the original on 13 November 2016. Retrieved 12 April 2017.
- ↑ "Data Warehouse". UNICEF Data.
- ↑ Regan, Helen; Suri, Manveena (6 October 2019). "Half of India couldn't access a toilet 5 years ago. Modi built 110M latrines – but will people use them?". CNN. Retrieved 1 January 2023.
- ↑ "Dashboard. Swachh Bharat Mission (Grameen) 2.0". Swachh Bharat Mission – Gramin. Ministry of Jal Shakti. Retrieved 18 February 2019.
- ↑ McCarthy, Niall (19 November 2020). "India's Toilet-Building Revolution". Statista. Retrieved 17 December 2020.
- ↑ "Water Supply & Sanitation – Reaching the Poor Through Sustainable Partnerships: The Slum Sanitation Program in Mumbai, India". World Bank. 2006. Retrieved 29 July 2015.
- ↑ Jacobson, Mark (2007). "Mumbai Slum: Dharavi". National Geographic. Archived from the original on 5 May 2007.
- ↑ 35.0 35.1 "Special report : Creaking, groaning: Infrastructure is India's biggest handicap". The Economist. 13 December 2008.
- ↑ Sharma, Betwa (15 October 2009). "665 million Indians still defecate in open: UN". Rediff News. Retrieved 19 September 2010.
- ↑ Hobson, Kevin. "Indian Caste System and The British". InfinityFoundation.com. Retrieved 18 February 2019.
- ↑ Singh, Sahana (5 May 2016). "Why is the world so obsessed with India's caste system?". India Facts.
- ↑ Cite error: Invalid
<ref>tag; no text was provided for refs namedPanse 2006 - ↑ Wallace, Bruce (6 September 2007). "The World – Drawing a curtain on old ways – In India, a villager uses his own strategy in a campaign to encourage the use of toilets instead of the great outdoors". Los Angeles Times.
{{cite web}}: CS1 maint: deprecated archival service (link) - ↑ 41.0 41.1 Overdorf, Jason (28 June 2008). "India: An Environmental Mess". Newsweek. Retrieved 1 January 2023.
- ↑ Ghatak, Aditi Roy (17 February 2018). "The wetlands will weep today". The Statesman. Archived from the original on 8 March 2018. Retrieved 23 March 2018.
- ↑ Ghosh, Dhrubajyoti. "The Calcutta Wetlands: turning bad water into good" (PDF). www.dhrubajyoti.net. Changemakers (issue October 2008). Archived (PDF) from the original on 13 January 2017. Retrieved 8 March 2018.
- ↑ Ghosh, Dhrubajyoti (2 October 2014). Ecosystem management – towards merging theory and practice (PDF). New delhi: Nimby books. ISBN 9788190657044. Archived (PDF) from the original on 24 June 2019. Retrieved 8 March 2018.
- ↑ Aseem, Shrivastava (8 March 2018). "The ecologically subsidised city: on Kolkata's wetland communities". The Hindu. Archived from the original on 23 November 2021. Retrieved 23 March 2018.
- ↑ "Global 500 environmental forum". www.global500.org. United Nations. Archived from the original on 8 March 2018. Retrieved 8 March 2018.
- ↑ Cunha, John P. Shiel Jr., William C.; Davis, Charles Patrick (eds.). "Travelers' Diarrhea: Learn About Antibiotics and Treatment". MedicineNet. Retrieved 29 July 2015.
- ↑ Chopp, Chris (18 January 2010). "10 Ways to Avoid Traveler's Diarrhea in India". FullStopIndia.com. Archived from the original on 20 February 2011. Retrieved 30 March 2011.
- ↑ Jha, Rupa (7 February 2009). "'My life cleaning Delhi's sewers'". BBC. Retrieved 1 January 2023.
- ↑ 50.0 50.1 50.2 World Bank:Punjab Rural Water Supply and Sanitation Project, Project Appraisal Document , 2006, Annex 1
- ↑ "India Assessment 2002. Water Supply and Sanitation" (PDF). Planning Commission, Government of India. pp. 23–26. Archived from the original (PDF) on 6 January 2006.
- ↑ "New Sanitation Award Creates Healthy Competition Among Indian Cities". Water and Sanitation Program, World Bank. 2010. Retrieved 21 August 2012.
- ↑ Schellenberg, Tatjana; Subramanian, Vrishali; Ganeshan, Ganapathy; Tompkins, David; Pradeep, Rohini (2020). "Wastewater Discharge Standards in the Evolving Context of Urban Sustainability–The Case of India". Frontiers in Environmental Science. 8. doi:10.3389/fenvs.2020.00030. ISSN 2296-665X. S2CID 215790363.
- ↑ Kaur, R; Wani, SP; Singh, AK. "Wastewater production, treatment and use in India" (PDF). AIS. Retrieved 17 November 2020.
- ↑ "National Water Policy (2012)" (PDF). Ministry of Water Resources, Government of India. Archived from the original (PDF) on 12 July 2018. Retrieved 15 November 2020.
- ↑ "10th Plan, p. 613" (PDF). Archived from the original (PDF) on 21 August 2007. Retrieved 11 June 2007.
- ↑ 57.0 57.1 "Delhi Jal Board focuses on its finances". Global Water Intelligence. October 2013. Retrieved 27 December 2013.
- ↑ The Financial Express: Jusco reaches Bhopal, aims for other cities under JNURM, 25 August 2007
- ↑ 59.0 59.1 World Bank:Introducing 24/7 water supply – Challenges in three cities in Karnataka, India. Retrieved 29 March 2009.
- ↑ 60.0 60.1 World Bank: Karnataka Urban Water Sector Improvement Project. Retrieved 29 March 2009.
- ↑ D.S., Madhumathi (7 December 2003). "Bangalore water board upbeat on project to plug leakage". The Hindu Business Line. Archived from the original on 14 March 2004.
- ↑ The Latur water supply project is replicable across India, Interview with Ashok Natarajan, Managing Director of Hydro Comp Enterprises, 1 March 2009
- ↑ Dealcurry.com:SPML Infra To Raise PE Funding For Bhiwandi Water Project Archived 25 December 2010 at the Wayback Machine, 21 June 2010
- ↑ Nitnaware, Himanshu (18 May 2021). "Gujarat Startup's Low-Cost Filters Save 60000 Litres of Water, Without Electricity". The Better India. Retrieved 28 July 2023.
- ↑ "About NeeRain Rooftop Rainwater Harvesting Filters". NeeRain. Retrieved 28 July 2023.
- ↑ IRC Archived 8 April 2014 at the Wayback Machine:India: Unrealistic approach hampers rural sanitation programme Archived 5 October 2008 at the Wayback Machine, 1 June 2007
- ↑ Benny George:Nirmal Gram Puraskar: A Unique Experiment in Incentivising Sanitation Coverage in Rural India, International Journal of Rural Studies (IJRS), Vol. 16, No. 1, April 2009
- ↑ Rukmini, S (2 October 2014). "Modi launches 'My Clean India' campaign". The Hindu. ISSN 0971-751X. Retrieved 29 September 2024.
- ↑ Swachh Bharat Abhiyan Report Stats, 12 September 2017, archived from the original on 28 September 2017
- ↑ Ministry of Rural Development, Department of Drinking Water Supply:Swajaldhara Archived 10 May 2010 at the Wayback Machine, updated on 31 March 2009. Retrieved 15 April 2010.
- ↑ World Bank:Inefficiency of Rural Water Supply Schemes in India, Smita Misra, 2008
- ↑ Tamaki, Keiichi (June 2017). "24/7 Normalized Water Supply Through Innovative Public-Private Partnership: Case Study from Ilkal Town, Karnataka, India". Think Asia. Asian Development Bank Institute.
- ↑ "Partnering for Clean Water: Join Our Mission". Water.org. Archived from the original on 16 June 2008.
- ↑ 74.0 74.1 NFSSM Alliance (2021). Faecal Sludge and Septage Management in Urban Areas: Service and Business models (PDF). NITI Aayog.
- ↑ Asian Development Bank:Benchmarking and Data Book of Water Utilities in India, 2007, p. 9
- ↑ OECD/Global Water Intelligence Water Tariff Survey 2007, quoted in Peter Gleick:The World's Water 2008–2009, p. 321-322
- ↑ National Institute of Urban Affairs (NIUA), 2002, Status of Water Supply, Sanitation and Solid Waste Management in Urban India, quoted in: World Bank/PPIAF/Water and Sanitation Program/World Bank Institute:Water Tariffs and Subsidies in South Asia: A Scorecard for India, 2002, p. 7-8
- ↑ Delhi ADB 2001 Archived 10 October 2007 at the Wayback Machine The same source estimates the working ratio at 2.45, which implies that current revenues must be less than half of recurrent costs
- ↑ Global Water Partnership:Malay Raj MukerjeeIndia: Issues in introducing a realistic water pricing regime in urban local bodies
- ↑ Planning Commission:10th Plan, p. 604 Archived 27 July 2007 at the Wayback Machine
- ↑ Srivastava, D.K. and Sen, T.K. (1997), Government Subsidies in India, National Institute of Public Finance and Policy, New Delhi, quoted in: World Bank/PPIAF/Water and Sanitation Program/World Bank Institute:Water Tariffs and Subsidies in South Asia: A Scorecard for India, 2002, p. 8
- ↑ World Bank/PPIAF/Water and Sanitation Program/World Bank Institute:Water Tariffs and Subsidies in South Asia: A Scorecard for India, 2002, p. 12
- ↑ 83.0 83.1 Cite error: Invalid
<ref>tag; no text was provided for refs namedPlanning Commission - ↑ "Tracking Policy and Budgetary Commitments for Drinking Water and Sanitation: A Study of Select States" (PDF). Centre for Budget and Governance Accountability (CBGA). January 2016. Retrieved 28 July 2016.
- ↑ Planning Commission of India:India Assessment 2002, Water Supply and Sanitation, a WHO-UNICEF sponsored study, 2003, p. 51-53
- ↑ Planning Commission:10th Plan (2002–2007), p. 611 Archived 21 August 2007 at the Wayback Machine
- ↑ "Swachh Bharat Abhiyaan: Government builds 7.1 lakh toilets in January". timesofindia-economictimes. Archived from the original on 20 February 2015.
- ↑ "PM Modi's 'Swachh Bharat Abhiyan' set for mega launch Thursday; schools, offices gear up for event". Zee News. October 2014.
- ↑ "Budget 2016: Swachh Bharat Abhiyan gets Rs 9,000 crore", The Economic Times, 29 February 2016
- ↑ "New steps to make Swachh Bharat, or Clean India Campaign, a reality". IRC – Supporting water, sanitation and hygiene services for life. 17 December 2015. Retrieved 28 July 2016.
- ↑ Dietvorst, Cor (21 July 2016). "The decision to divert funding from water to sanitation turned sour when drought struck India". IRC. Retrieved 28 July 2016.
- ↑ "What is Jal Jeeval Mission". Business Standard India. Business Standard. 2019. Archived from the original on 3 January 2020.
- ↑ "Jal Jeevan Mission (JJM)" (PDF). Ministry of Drinking Water and Sanitation. p. 1. Archived from the original on 23 November 2019.
- ↑ "Rural India's economic strength linked to young scientists: PM in Bengaluru". Hindustan Times. Bengaluru. 3 January 2020. Archived from the original on 3 January 2020.
- ↑ Tamil Nadu Urban Development Fund. "Water and Sanitation Pooled Fund". Retrieved 20 August 2012.
- ↑ Financial Times:India gets biggest share of aid for water and hygiene, 7 April 2009
- ↑ OECD, 2007:Measuring Aid to Water Supply and Sanitation Archived 25 May 2010 at the Wayback Machine, p. 3
- ↑ OECD:Aid to the water sector commitments, India, calculated from the following pivot table:Water focus charts: Disbursements 2004–2006
- ↑ Gareth Price, Chatham House:India's aid dynamics: from recipient to donor? Archived 17 June 2011 at the Wayback Machine, Asia Programme Working Paper, September 2004, p. 4
- ↑ Asian Development Bank:Country Water Action: India. Testing Innovative Financing, December 2008
- ↑ In German: Interview mit Pater Hermann Bacher SJ, Jesuiten 4/2005 [dead link]
- ↑ "Project – Erosion Protection in India. Getting Women Involved in Decision-Making Processes". KfW. 2009. Archived from the original on 27 July 2011.
- ↑ "Sustainable Sanitation in India. Examples from Indo-German Development Cooperation" (PDF). Deutsche Gesellschaft für Internationale Zusammenarbeit (GTZ). 2008. Archived from the original (PDF) on 7 August 2011.
- ↑ Jha, Ritu (23 November 2017). "India & Israel: Cooperation on water management". The Economic Times. Retrieved 1 January 2023.
- ↑ "India-Israel join hands for new water technology centre at IIT Madras". Deccan Herald. 13 August 2024. Retrieved 30 September 2024.
- ↑ JICA:Ex-Ante Evaluation. Retrieved 18 March 2010.
- ↑ Sonoda, Hajime (2005). "Urban Water Supply and Sanitation Improvement Program" (PDF). Japan International Cooperation Agency. Archived from the original (PDF) on 28 September 2011.
- ↑ "Projects". World Bank. Retrieved 1 January 2023.
- ↑ "India – Water Supply and Waste Water Services in Bombay: First, Second and Third Bombay Water Supply and Sewerage Projects". Independent Evaluation Group (IEG) – The World Bank Group. Archived from the original on 5 July 2014. Retrieved 29 July 2015.
Further reading[edit | edit source]
- Sridhar, Kala Seetharam; Reddy, A. Venugopal (2010). State of Urban Services in India's Cities: Spending and Financing. Public Affairs Centre. ISBN 9780198065388 – via Google Books.
- Zerah, Marie-Helene (2000). Water, unreliable supply in Delhi. Manohar [and] Centre de Sciences Humaines. ISBN 8173043280.
External links[edit | edit source]
- World Bank: India's Water Economy:Bracing for a Turbulent Future, 2005 (PDF)
- Sustaining Water for All in a Changing Climate The World Bank, 2010, Case Study on water resources in Andhra Pradesh, India. pp. 73–77.
- Comprehensive Portal on Water in India: India Water Portal
- Solution Exchange:Water Community in India (archived)
- Water and Environmental Sanitation Network India:WES-Net India. Archived 15 February 2021 at the Wayback Machine.
- Asian Development Bank/Jawaharlal Nehru National Urban Renewal Mission: 2007 Benchmarking and Data Book of Water Utilities in India
- World Bank:Reaching the Poor Through Sustainable Partnerships: The Slum Sanitation Program in Mumbai, India
- Jawaharlal Nehru National Urban Renewal Mission:Overview (archived)
