1972 elections in India
 |
|---|
| This article is part of a series on the politics and government of India |
Legislative Assembly elections[edit | edit source]
Andhra Pradesh[edit | edit source]
Bihar[edit | edit source]
Goa, Daman & Diu[edit | edit source]
| Political Party |
Seats contested |
Seats won |
Number of Votes |
% of Votes |
Seat change | |
|---|---|---|---|---|---|---|
| Maharashtrawadi Gomantak Party | 23 | 18 | 116,855 | 38.30% | ||
| United Goans Party (Superia Group) | 26 | 10 | 99,156 | 32.50% | ||
| Indian National Congress | 19 | 1 | 41,612 | 13.64% | ||
| Independents | 36 | 1 | 28,874 | 9.64% | ||
| Total | 138 | 30 | 305,077 |
Gujarat[edit | edit source]
Haryana[edit | edit source]
Himachal Pradesh[edit | edit source]
Jammu and Kashmir[edit | edit source]
Madhya Pradesh[edit | edit source]
Maharashtra[edit | edit source]
Manipur[edit | edit source]
 | |||||
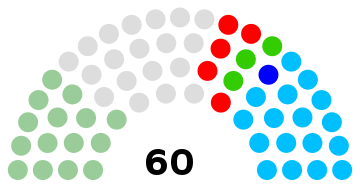
| Party | Votes | % | Seats | +/– | |
|---|---|---|---|---|---|
| Indian National Congress | 135,678 | 30.02 | 17 | +1 | |
| Manipur Peoples Party | 91,148 | 20.17 | 15 | New | |
| Communist Party of India | 45,765 | 10.13 | 5 | +4 | |
| Socialist Party (India) | 24,195 | 5.35 | 3 | New | |
| Indian National Congress (Organisation) | 10,699 | 2.37 | 1 | New | |
| Communist Party of India (Marxist) | 2,988 | 0.66 | 0 | – | |
| Bharatiya Jana Sangh | 1,004 | 0.22 | 0 | New | |
| Independents | 140,471 | 31.08 | 19 | +10 | |
| Total | 451,948 | 100.00 | 60 | +30 | |
| Valid votes | 451,948 | 97.89 | |||
| Invalid/blank votes | 9,744 | 2.11 | |||
| Total votes | 461,692 | 100.00 | |||
| Registered voters/turnout | 608,403 | 75.89 | |||
| Source: ECI[1] | |||||
Meghalaya[edit | edit source]
Mizoram[edit | edit source]
Mysore[edit | edit source]
Punjab[edit | edit source]
Rajasthan[edit | edit source]
 | |||||
| Party | Votes | % | Seats | +/– | |
|---|---|---|---|---|---|
| Indian National Congress | 3,976,157 | 51.13 | 145 | +56 | |
| Swatantra Party | 958,097 | 12.32 | 11 | –37 | |
| Bharatiya Jana Sangh | 948,928 | 12.20 | 8 | –14 | |
| Socialist Party | 189,851 | 2.44 | 4 | New | |
| Communist Party of India | 121,591 | 1.56 | 4 | +3 | |
| Indian National Congress (Organisation) | 104,398 | 1.34 | 1 | New | |
| Communist Party of India (Marxist) | 74,514 | 0.96 | 0 | 0 | |
| Vishal Haryana Party | 50,229 | 0.65 | 0 | New | |
| Republican Party of India | 2,137 | 0.03 | 0 | 0 | |
| Independents | 1,350,012 | 17.36 | 11 | –5 | |
| Total | 7,775,914 | 100.00 | 184 | 0 | |
| Valid votes | 7,775,914 | 96.77 | |||
| Invalid/blank votes | 259,313 | 3.23 | |||
| Total votes | 8,035,227 | 100.00 | |||
| Registered voters/turnout | 13,910,553 | 57.76 | |||
| Source: ECI[2] | |||||
Tripura[edit | edit source]
West Bengal[edit | edit source]
References[edit | edit source]
- ↑ "Statistical Report on General Election, 1967 to the Legislative Assembly of Manipur". Election Commission of India. Retrieved 20 October 2021.
- ↑ "Statistical Report on General Election, 1972 to the Legislative Assembly of Rajasthan". Election Commission of India. Retrieved 22 December 2021.
External links[edit | edit source]
{{#seo:
|keywords=State Assembly elections in India
|description=
}}