














No edit summary |
No edit summary |
||
| Line 1: | Line 1: | ||
{{Short description| | {{Short description|None}} | ||
{{use Indian English|date=October 2019}} | {{use Indian English|date=October 2019}} | ||
{{use dmy dates|date=October 2020}} | {{use dmy dates|date=October 2020}} | ||
{{Infobox economy | {{Infobox economy | ||
| country = India | | country = India | ||
| image = File: | | image =File:F7xZ48abwAAgNst.jpg | ||
| image_size = 300px | | image_size = 300px | ||
| alt = Economy | | alt = Economy | ||
| caption = [[Mumbai]], the [[financial centre]] of India<ref name="ibef.org">{{cite web |url=http://www.ibef.org/states/maharashtra.aspx |title=Information About Maharashtra, Industries, Economy, Exports of Maharashtra |publisher=[[India Brand Equity Foundation]] |access-date=12 April 2014}}</ref><ref name="books.google.co.in">{{cite book |title=Logistics Management for International Business: Text and Cases | | | caption = [[Mumbai]], the [[financial centre]] of India<ref name="ibef.org">{{cite web |url=http://www.ibef.org/states/maharashtra.aspx |title=Information About Maharashtra, Industries, Economy, Exports of Maharashtra |publisher=[[India Brand Equity Foundation]] |access-date=12 April 2014 |archive-date=4 August 2016 |archive-url=https://web.archive.org/web/20160804173208/http://www.ibef.org/states/maharashtra.aspx |url-status=live }}</ref><ref name="books.google.co.in">{{cite book |title=Logistics Management for International Business: Text and Cases |last1=Sudalaimuthu |first1=S. |last2=Raj |first2=S. A. |year=2009 |publisher=PHI Learning |isbn=9788120337923 |url=https://books.google.com/books?id=NG2TjfQF6zEC}}</ref> | ||
| currency = [[Indian rupee]] (INR, ₹) | | currency = [[Indian rupee]] (INR, ₹) | ||
| fixed exchange = | | fixed exchange = | ||
| year = 1 April – 31 March | | year = 1 April – 31 March | ||
| organs = [[World Trade Organization|WTO]], [[World Customs Organization|WCO]], [[South Asian Free Trade Area|SAFTA]], [[BIMSTEC]], [[World Federation of Trade Unions|WFTU]], [[BRICS]], [[G-20 major economies|G-20]], [[Bank for International Settlements|BIS]], [[Asian Infrastructure Investment Bank|AIIB]], [[Asian Development Bank|ADB]] and others | | organs = [[World Trade Organization|WTO]], [[World Customs Organization|WCO]], [[South Asian Free Trade Area|SAFTA]], [[BIMSTEC]], [[World Federation of Trade Unions|WFTU]], [[BRICS]], [[G-20 major economies|G-20]], [[Bank for International Settlements|BIS]], [[Asian Infrastructure Investment Bank|AIIB]], [[Asian Development Bank|ADB]] and others | ||
| group = {{plainlist| | | group = {{plainlist| | ||
* [[Developing country|Developing/Emerging]]<ref>{{cite web |url=https://www.imf.org/external/pubs/ft/weo/2020/01/weodata/groups.htm |title=World Economic and Financial Surveys World Economic Outlook Database—WEO Groups and Aggregates Information April 2020 |website=IMF.org |publisher=[[International Monetary Fund]] |access-date=2 September 2020}}</ref> | * [[Developing country|Developing/Emerging]]<ref>{{cite web |url=https://www.imf.org/external/pubs/ft/weo/2020/01/weodata/groups.htm |title=World Economic and Financial Surveys World Economic Outlook Database—WEO Groups and Aggregates Information April 2020 |website=IMF.org |publisher=[[International Monetary Fund]] |access-date=2 September 2020 |archive-date=22 December 2019 |archive-url=https://web.archive.org/web/20191222001529/https://www.imf.org/external/pubs/ft/weo/2019/01/weodata/weoselco.aspx?g=2200&sg=All+countries+%2f+Emerging+market+and+developing+economies |url-status=live }}</ref> | ||
* [[World Bank high-income economy|Lower-middle income economy]]<ref>{{cite web |url=https://datahelpdesk.worldbank.org/knowledgebase/articles/906519-world-bank-country-and-lending-groups |title=World Bank Country and Lending Groups |publisher=[[World Bank]] |access-date=29 September 2019}}</ref> | * [[World Bank high-income economy|Lower-middle income economy]]<ref>{{cite web |url=https://datahelpdesk.worldbank.org/knowledgebase/articles/906519-world-bank-country-and-lending-groups |title=World Bank Country and Lending Groups |publisher=[[World Bank]] |access-date=29 September 2019 |archive-date=28 October 2019 |archive-url=https://web.archive.org/web/20191028223324/https://datahelpdesk.worldbank.org/knowledgebase/articles/906519-world-bank-country-and-lending-groups |url-status=live }}</ref> | ||
* [[Newly industrialized country]] | * [[Newly industrialized country]] | ||
}} | }} | ||
| population = {{IncreaseNeutral}} 1,417,173,173 ([[List of countries and dependencies by population|2nd; 2022 est.]])<ref>{{Cite web|url=https://www.macrotrends.net/countries/IND/india/population|title=India Population 1950–2023|website=www.macrotrends.net}}</ref><ref>{{cite web |url=https://population.un.org/wpp/Download/Files/1_Indicators%20(Standard)/EXCEL_FILES/1_Population/WPP2019_POP_F01_1_TOTAL_POPULATION_BOTH_SEXES.xlsx |at=Row 137, column BZ |title=United Nations, Department of Economic and Social Affairs, Population Division (2019). World Population Prospects 2019, Online Edition. Rev. 1. |website=population.un.org |publisher=[[United Nations]]}}</ref> | | population = {{IncreaseNeutral}} 1,417,173,173 ([[List of countries and dependencies by population|2nd; 2022 est.]])<ref>{{Cite web|url=https://www.macrotrends.net/countries/IND/india/population|title=India Population 1950–2023|website=www.macrotrends.net|access-date=8 September 2022|archive-date=19 September 2022|archive-url=https://web.archive.org/web/20220919151521/https://www.macrotrends.net/countries/IND/india/population|url-status=live}}</ref><ref>{{cite web |url=https://population.un.org/wpp/Download/Files/1_Indicators%20(Standard)/EXCEL_FILES/1_Population/WPP2019_POP_F01_1_TOTAL_POPULATION_BOTH_SEXES.xlsx |at=Row 137, column BZ |title=United Nations, Department of Economic and Social Affairs, Population Division (2019). World Population Prospects 2019, Online Edition. Rev. 1. |website=population.un.org |publisher=[[United Nations]] |access-date=24 June 2021 |archive-date=18 February 2020 |archive-url=https://web.archive.org/web/20200218054922/https://population.un.org/wpp/Download/Files/1_Indicators%20(Standard)/EXCEL_FILES/1_Population/WPP2019_POP_F01_1_TOTAL_POPULATION_BOTH_SEXES.xlsx |url-status=live }}</ref> | ||
| gdp = {{plainlist| | | gdp = {{plainlist| | ||
* {{increase}} $3. | * {{increase}} $3.732 trillion ([[GDP (nominal)|nominal]]; 2023 est.)<ref name="IMFWEOIN">{{cite web |url=https://www.imf.org/en/Publications/WEO/weo-database/2023/October/weo-report?c=534,&s=NGDP_RPCH,NGDPD,PPPGDP,NGDPDPC,PPPPC,&sy=2021&ey=2028&ssm=0&scsm=1&scc=0&ssd=1&ssc=0&sic=0&sort=country&ds=.&br=1 |title=World Economic Outlook Database: October 2023 |publisher=[[International Monetary Fund]] |date=October 2023 |access-date=10 October 2023 |archive-date=11 October 2023 |archive-url=https://web.archive.org/web/20231011061018/https://www.imf.org/en/Publications/WEO/weo-database/2023/October/weo-report?c=534,&s=NGDP_RPCH,NGDPD,PPPGDP,NGDPDPC,PPPPC,&sy=2021&ey=2028&ssm=0&scsm=1&scc=0&ssd=1&ssc=0&sic=0&sort=country&ds=.&br=1 |url-status=live }}</ref> | ||
* {{increase}} $13. | * {{increase}} $13.12 trillion ([[Purchasing power parity|PPP]]; 2023 est.)<ref name="IMFWEOIN" /> | ||
}} | }} | ||
| gdp rank = {{plainlist| | | gdp rank = {{plainlist| | ||
| Line 28: | Line 28: | ||
| growth = {{plainlist| | | growth = {{plainlist| | ||
* {{increase}} 7.2% (FY2022-23)<ref name="IMFWEOIN" /> | * {{increase}} 7.2% (FY2022-23)<ref name="IMFWEOIN" /> | ||
* {{increase}} 6.3% {{abbr|(FY2023-24)|2024 forecast}}<ref name="IMF_forecast">{{cite web | url=https://www.imf.org/en/Publications/WEO/Issues/2023/04/11/world-economic-outlook-april-2023 | title=The outlook is uncertain again amid financial sector turmoil, high inflation, ongoing effects of Russia's invasion of Ukraine, and three years of COVID|work=[[International Monetary Fund]]|date=April 11, 2023 | * {{increase}} 6.3% {{abbr|(FY2023-24)|2024 forecast}}<ref name="IMF_forecast">{{cite web | url=https://www.imf.org/en/Publications/WEO/Issues/2023/04/11/world-economic-outlook-april-2023 | title=The outlook is uncertain again amid financial sector turmoil, high inflation, ongoing effects of Russia's invasion of Ukraine, and three years of COVID | work=[[International Monetary Fund]] | date=April 11, 2023 | access-date=24 July 2023 | archive-date=13 April 2023 | archive-url=https://web.archive.org/web/20230413022436/https://www.imf.org/en/Publications/WEO/Issues/2023/04/11/world-economic-outlook-april-2023 | url-status=live }}</ref> | ||
}} | }} | ||
| per capita = {{plainlist| | | per capita = {{plainlist| | ||
* {{increase}} $2, | * {{increase}} $2,612 (nominal; 2023 est.)<ref name="IMFWEOIN" /> | ||
* {{increase}} $9, | * {{increase}} $9,183 (PPP; 2023 est.)<ref name="IMFWEOIN" /> | ||
}} | }} | ||
| per capita rank = {{plainlist| | | per capita rank = {{plainlist| | ||
| Line 43: | Line 42: | ||
* [[Secondary sector of the economy|Industry]]: 28.2% | * [[Secondary sector of the economy|Industry]]: 28.2% | ||
* [[Tertiary sector of the economy|Services]]: 53% | * [[Tertiary sector of the economy|Services]]: 53% | ||
* (FY 2021–22)<ref>{{cite web|title=GDP by Sector– India FY2020-21|url=https://m.statisticstimes.com/economy/country/india-gdp-sectorwise.php|access-date=2021-10-03|website=statisticstimes.com}}</ref> | * (FY 2021–22)<ref>{{cite web|title=GDP by Sector– India FY2020-21|url=https://m.statisticstimes.com/economy/country/india-gdp-sectorwise.php|access-date=2021-10-03|website=statisticstimes.com|archive-date=3 October 2021|archive-url=https://web.archive.org/web/20211003095604/https://m.statisticstimes.com/economy/country/india-gdp-sectorwise.php|url-status=live}}</ref> | ||
}} | }} | ||
| components = {{plainlist| | | components = {{plainlist| | ||
| Line 52: | Line 51: | ||
* Imports of goods and services: -29.7% | * Imports of goods and services: -29.7% | ||
* Other source: 5.7% | * Other source: 5.7% | ||
* (FY 2022–23)<ref name="GDP mospi">{{cite web |title=Press note on the First Advanced Estimates for the year 2022–23|url=https://mospi.gov.in/sites/default/files/press_release/PressNote_FAE-2022-23.pdf |website=MoSPI |page=4|access-date=6 January 2023}}</ref> | * (FY 2022–23)<ref name="GDP mospi">{{cite web|title=Press note on the First Advanced Estimates for the year 2022–23|url=https://mospi.gov.in/sites/default/files/press_release/PressNote_FAE-2022-23.pdf|website=MoSPI|page=4|access-date=6 January 2023|archive-date=10 February 2023|archive-url=https://web.archive.org/web/20230210044548/http://mospi.gov.in/sites/default/files/press_release/PressNote_FAE-2022-23.pdf|url-status=live}}</ref> | ||
}} | }} | ||
| inflation = {{plainlist| | | inflation = {{plainlist| | ||
* {{ | * {{decreasePositive}} 5.62% (August 2023)<ref>{{cite web|url=https://www.mospi.gov.in/sites/default/files/press_release/CPI_PR_12apr23.pdf|title=CPI inflation rate ease to 5.62% in August;|date=September 2023|access-date=14 September 2023|archive-date=28 May 2023|archive-url=https://web.archive.org/web/20230528094247/https://www.mospi.gov.in/sites/default/files/press_release/CPI_PR_12apr23.pdf|url-status=live}}</ref> | ||
}} | }} | ||
| bankrate = {{IncreasePositive}} 4.50% (18 August 2023)<ref>{{cite web|title=Weekly Statistical Supplement – Ratio and Rates|url=https://m.rbi.org.in//Scripts/WSSView.aspx?Id=26317|website=Reserve Bank of India|access-date=30 August 2023}}</ref> | | bankrate = {{IncreasePositive}} 4.50% (18 August 2023)<ref>{{cite web|title=Weekly Statistical Supplement – Ratio and Rates|url=https://m.rbi.org.in//Scripts/WSSView.aspx?Id=26317|website=Reserve Bank of India|access-date=30 August 2023|archive-date=30 August 2023|archive-url=https://web.archive.org/web/20230830165210/https://m.rbi.org.in//Scripts/WSSView.aspx?Id=26317|url-status=live}}</ref> | ||
| poverty = {{plainlist| | | poverty = {{plainlist| | ||
* {{ | * {{IncreaseNegative}} $2.15/day (2017 PPP) (% population): 11.90% (2021) <ref name="WorldBankPIP">{{Cite web |title=Poverty and Inequality Platform |url=https://pip.worldbank.org/country-profiles/IND |access-date=2022-05-17 |work=[[World Bank]] |archive-date=30 January 2023 |archive-url=https://web.archive.org/web/20230130144207/https://pip.worldbank.org/country-profiles/IND |url-status=live }}</ref> | ||
* {{ | * {{DecreasePositive}} 14.96% in multidimensional poverty <ref>{{Cite web|title=National Multidimensional Poverty|url=https://www.undp.org/india/publications/national-multidimensional-poverty-index-progress-review-2023|access-date=18 July 2023|archive-date=21 July 2023|archive-url=https://web.archive.org/web/20230721225202/https://www.undp.org/india/publications/national-multidimensional-poverty-index-progress-review-2023|url-status=live}}</ref> (2023) | ||
}} | }} | ||
| gini = {{plainlist| | | gini = {{plainlist| | ||
* 35.7 {{color|darkorange|medium}} (2019)<ref name="CIAWFIN">{{cite web |url=https://www.cia.gov/the-world-factbook/countries/india/ |title=India |publisher=[[Central Intelligence Agency]] |website=CIA.gov |accessdate=10 August 2023}}</ref> | * 35.7 {{color|darkorange|medium}} (2019)<ref name="CIAWFIN">{{cite web |url=https://www.cia.gov/the-world-factbook/countries/india/ |title=India |publisher=[[Central Intelligence Agency]] |website=CIA.gov |accessdate=10 August 2023 |archive-date=18 March 2021 |archive-url=https://web.archive.org/web/20210318202107/https://www.cia.gov/the-world-factbook/countries/india |url-status=live }}</ref> | ||
* 33.9 {{color|darkorange|medium}} (2013)<ref name="GINI index">{{cite web|title=Income Gini coefficient|url=http://hdr.undp.org/en/content/income-gini-coefficient|website=United Nations Development Program|access-date=14 January 2017|archive-date=10 June 2010|archive-url=https://web.archive.org/web/20100610232357/https://www.cia.gov/library/publications/the-world-factbook/fields/2172.html|url-status=dead}}</ref>}} | * 33.9 {{color|darkorange|medium}} (2013)<ref name="GINI index">{{cite web|title=Income Gini coefficient|url=http://hdr.undp.org/en/content/income-gini-coefficient|website=United Nations Development Program|access-date=14 January 2017|archive-date=10 June 2010|archive-url=https://web.archive.org/web/20100610232357/https://www.cia.gov/library/publications/the-world-factbook/fields/2172.html|url-status=dead}}</ref>}} | ||
| cpi = {{steady}} 40 (2022)<ref name="ti_2022">{{cite web |url=https://www.transparency.org/en/cpi/2022 |title=CPI 2022 |date=31 January 2023 |publisher=[[Transparency International]] |access-date=31 January 2023}}</ref> (85th) | | cpi = {{steady}} 40 (2022)<ref name="ti_2022">{{cite web |url=https://www.transparency.org/en/cpi/2022 |title=CPI 2022 |date=31 January 2023 |publisher=[[Transparency International]] |access-date=31 January 2023 |archive-date=4 February 2023 |archive-url=https://web.archive.org/web/20230204001659/https://www.transparency.org/en/cpi/2022 |url-status=live }}</ref> (85th) | ||
| hdi = {{plainlist| | | hdi = {{plainlist| | ||
* {{decrease}} 0.633 {{color|darkorange|medium}} (2021)<ref name="UNHDR">{{cite web|url=https://hdr.undp.org/system/files/documents/global-report-document/hdr2021-22pdf_1.pdf|title=Human Development Report 2021/2022|language=en|publisher=[[United Nations Development Programme]]|date=8 September 2022|access-date=9 September 2022}}</ref> ([[List of countries by Human Development Index|132nd]]) | * {{decrease}} 0.633 {{color|darkorange|medium}} (2021)<ref name="UNHDR">{{cite web|url=https://hdr.undp.org/system/files/documents/global-report-document/hdr2021-22pdf_1.pdf|title=Human Development Report 2021/2022|language=en|publisher=[[United Nations Development Programme]]|date=8 September 2022|access-date=9 September 2022|archive-date=8 September 2022|archive-url=https://web.archive.org/web/20220908052326/https://hdr.undp.org/system/files/documents/global-report-document/hdr2021-22pdf_1.pdf|url-status=live}}</ref> ([[List of countries by Human Development Index|132nd]]) | ||
* {{ | * {{increase}} 0.475 {{color|red|low}} [[List of countries by inequality-adjusted HDI|IHDI (108th)]] (2021)<ref>{{cite web |title=India |url=https://hdr.undp.org/data-center/specific-country-data#/countries/IND |website=hdr.undp.org |publisher=[[United Nations Development Programme|UNDP]] |access-date=22 May 2023 |archive-date=29 September 2023 |archive-url=https://archive.today/20230929165648/https://hdr.undp.org/data-center/specific-country-data%23/countries/MOZ#/countries/IND |url-status=live }}</ref> | ||
}} | }} | ||
| labor = {{plainlist| | | labor = {{plainlist| | ||
* {{increase}} 523,839,158 (2022)<ref name="WB_labor"/> | * {{increase}} 523,839,158 (2022)<ref name="WB_labor"/> | ||
* 49.8% employment rate (2022)<ref>{{cite web |url=https://data.worldbank.org/indicator/SL.EMP.TOTL.SP.NE.ZS?locations=IN&name_desc=false |title=Employment to population ratio, 15+, total (%) (national estimate) – India |publisher=World Bank |access-date=29 September 2019}}</ref> | * 49.8% employment rate (2022)<ref>{{cite web |url=https://data.worldbank.org/indicator/SL.EMP.TOTL.SP.NE.ZS?locations=IN&name_desc=false |title=Employment to population ratio, 15+, total (%) (national estimate) – India |publisher=World Bank |access-date=29 September 2019 |archive-date=29 September 2019 |archive-url=https://web.archive.org/web/20190929194148/https://data.worldbank.org/indicator/SL.EMP.TOTL.SP.NE.ZS%3Flocations%3DIN%26name_desc%3Dfalse |url-status=live }}</ref> | ||
}} | }} | ||
| occupations = {{plainlist| | | occupations = {{plainlist| | ||
* [[Primary sector of the economy|Agriculture]]: 42.60% <ref>{{cite web |title=Employment in agriculture (% of total employment) (modeled ILO estimate) – India {{!}} Data |url=https://data.worldbank.org/indicator/SL.AGR.EMPL.ZS?locations=IN |website=data.worldbank.org}}</ref> | * [[Primary sector of the economy|Agriculture]]: 42.60% <ref>{{cite web |title=Employment in agriculture (% of total employment) (modeled ILO estimate) – India {{!}} Data |url=https://data.worldbank.org/indicator/SL.AGR.EMPL.ZS?locations=IN |website=data.worldbank.org |access-date=14 September 2019 |archive-date=7 June 2019 |archive-url=https://web.archive.org/web/20190607054517/https://data.worldbank.org/indicator/SL.AGR.EMPL.ZS?locations=IN |url-status=live }}</ref> | ||
* [[Secondary sector of the economy|Industry]]: 25.12% <ref>{{cite web |title=Employment in industry (% of total employment) (modeled ILO estimate) – India {{!}} Data |url=https://data.worldbank.org/indicator/SL.IND.EMPL.ZS?locations=IN |website=data.worldbank.org}}</ref> | * [[Secondary sector of the economy|Industry]]: 25.12% <ref>{{cite web |title=Employment in industry (% of total employment) (modeled ILO estimate) – India {{!}} Data |url=https://data.worldbank.org/indicator/SL.IND.EMPL.ZS?locations=IN |website=data.worldbank.org |access-date=14 September 2019 |archive-date=26 January 2020 |archive-url=https://web.archive.org/web/20200126033620/https://data.worldbank.org/indicator/SL.IND.EMPL.ZS%3Flocations%3DIN |url-status=live }}</ref> | ||
* [[Tertiary sector of the economy|Services]]: 32.28% <ref>{{cite web |title=Employment in services (% of total employment) (modeled ILO estimate) – India {{!}} Data |url=https://data.worldbank.org/indicator/SL.SRV.EMPL.ZS?locations=IN |website=data.worldbank.org}}</ref> | * [[Tertiary sector of the economy|Services]]: 32.28% <ref>{{cite web |title=Employment in services (% of total employment) (modeled ILO estimate) – India {{!}} Data |url=https://data.worldbank.org/indicator/SL.SRV.EMPL.ZS?locations=IN |website=data.worldbank.org |access-date=14 September 2019 |archive-date=26 January 2020 |archive-url=https://web.archive.org/web/20200126033559/https://data.worldbank.org/indicator/SL.SRV.EMPL.ZS%3Flocations%3DIN |url-status=live }}</ref> | ||
* (2019) | * (2019) | ||
}} | }} | ||
| unemployment = {{plainlist| | | unemployment = {{plainlist| | ||
* {{ | * {{increaseNegative}} 8.1% (August 2023)<ref>{{cite web|title=''CMIE Official Unemployment in India''|url=https://unemploymentinindia.cmie.com/|publisher=CMIE|access-date=|archive-date=10 November 2021|archive-url=https://web.archive.org/web/20211110164803/https://unemploymentinindia.cmie.com/|url-status=live}}</ref> | ||
* | * 20.2% youth unemployment (15 to 24 year-olds; 2022)<ref>{{Cite web |url=https://www.business-standard.com/economy/news/unemployment-among-urban-youth-down-in-q4fy23-but-still-elevated-at-17-3-123053000495_1.html |title=Archived copy |access-date=16 September 2023 |archive-date=29 September 2023 |archive-url=https://web.archive.org/web/20230929001603/https://www.business-standard.com/economy/news/unemployment-among-urban-youth-down-in-q4fy23-but-still-elevated-at-17-3-123053000495_1.html |url-status=live }}</ref>}} | ||
| savings = 29.345% of GDP (2022)<ref name="imf-go" /> | | savings = 29.345% of GDP (2022)<ref name="imf-go" /> | ||
| pmi = {{plainlist| | | pmi = {{plainlist| | ||
* {{increase}} 55.3 Manufacturing (Feb 2023)<ref>{{Cite web|url=https://www.pmi.spglobal.com/Public/Home/PressRelease/9522f93ee59244898c31e5b0a58aa9fc|title=Growth of factory production little-changed since January|website=pmi.spglobal.com}}</ref> | * {{increase}} 55.3 Manufacturing (Feb 2023)<ref>{{Cite web|url=https://www.pmi.spglobal.com/Public/Home/PressRelease/9522f93ee59244898c31e5b0a58aa9fc|title=Growth of factory production little-changed since January|website=pmi.spglobal.com|access-date=5 March 2023|archive-date=5 March 2023|archive-url=https://web.archive.org/web/20230305085320/https://www.pmi.spglobal.com/Public/Home/PressRelease/9522f93ee59244898c31e5b0a58aa9fc|url-status=live}}</ref> | ||
* {{increase}} 59.4 Services (Feb 2023)<ref>{{Cite web|url=https://www.pmi.spglobal.com/Public/Home/PressRelease/8dec781612134e4dba8c7dfa30b08ddf|title=Growth of services activity hits 12-year high in February|website=pmi.spglobal.com}}</ref> | * {{increase}} 59.4 Services (Feb 2023)<ref>{{Cite web|url=https://www.pmi.spglobal.com/Public/Home/PressRelease/8dec781612134e4dba8c7dfa30b08ddf|title=Growth of services activity hits 12-year high in February|website=pmi.spglobal.com|access-date=5 March 2023|archive-date=5 March 2023|archive-url=https://web.archive.org/web/20230305085328/https://www.pmi.spglobal.com/Public/Home/PressRelease/8dec781612134e4dba8c7dfa30b08ddf|url-status=live}}</ref> | ||
}} | }} | ||
| yield curve = 10-year bond 7. | | yield curve = 10-year bond 7.190% (Jan 2023)<ref>{{Cite web|url=https://www.marketwatch.com/investing/bond/ldbmkin-10y?countrycode=bx|title=LDBMKIN-10Y {{pipe}} India 10 Year Government Bond Overview|website=MarketWatch|date=19 September 2023|access-date=1 February 2023|archive-date=1 February 2023|archive-url=https://web.archive.org/web/20230201152750/https://www.marketwatch.com/investing/bond/ldbmkin-10y?countrycode=bx|url-status=live}}</ref><ref>{{cite web|url=https://www.rbi.org.in/Scripts/BS_ViewBulletin.aspx?Id=21066|title=What is the Yield Curve Telling Us About the Economy?|date=16 June 2022|website=rbi.org|access-date=1 February 2023|archive-date=1 February 2023|archive-url=https://web.archive.org/web/20230201152753/https://www.rbi.org.in/Scripts/BS_ViewBulletin.aspx?Id=21066|url-status=live}}</ref> | ||
| industries = {{hlist| [[Textiles]] | [[chemicals]] | [[food processing]] | [[steel]] | [[Material-handling equipment|transportation equipment]] | [[cement]] | [[mining]] | [[petroleum]] | machinery | [[software]] | [[pharmaceuticals]]{{sfn|Library of Congress|2004}} }} | | industries = {{hlist| [[Textiles]] | [[chemicals]] | [[food processing]] | [[steel]] | [[Material-handling equipment|transportation equipment]] | [[cement]] | [[mining]] | [[petroleum]] | machinery | [[software]] | [[pharmaceuticals]]{{sfn|Library of Congress|2004}} }} | ||
| exports = {{increase}} $770.18 billion (FY2022-23)<ref name="trade">{{cite web|title=INDIA'S FOREIGN TRADE: March 2023|url=https://commerce.gov.in/wp-content/uploads/2023/04/Press-Release-March-2023.pdf|publisher=Ministry of commerce and Industry: Government of India|access-date=13 April 2023}}</ref> | | exports = {{increase}} $770.18 billion (FY2022-23)<ref name="trade">{{cite web|title=INDIA'S FOREIGN TRADE: March 2023|url=https://commerce.gov.in/wp-content/uploads/2023/04/Press-Release-March-2023.pdf|publisher=Ministry of commerce and Industry: Government of India|access-date=13 April 2023|archive-date=13 April 2023|archive-url=https://web.archive.org/web/20230413140616/https://commerce.gov.in/wp-content/uploads/2023/04/Press-Release-March-2023.pdf|url-status=live}}</ref> | ||
| export-goods = {{ublist|[[Manufacturers]] 70.7% |[[Fuels]] and mining products 14.7%| Agricultural products 14.1%| Others 0.5%<ref name=wto_stat>{{cite web|title=India – WTO Statistics Database|url=https://www.wto.org/english/res_e/statis_e/daily_update_e/trade_profiles/IN_e.pdf|work=[[World Trade Organization]]|access-date=29 March 2022}}</ref> (2022)}} | | export-goods = {{ublist|[[Manufacturers]] 70.7% |[[Fuels]] and mining products 14.7%| Agricultural products 14.1%| Others 0.5%<ref name=wto_stat>{{cite web|title=India – WTO Statistics Database|url=https://www.wto.org/english/res_e/statis_e/daily_update_e/trade_profiles/IN_e.pdf|work=[[World Trade Organization]]|access-date=29 March 2022|archive-date=31 January 2022|archive-url=https://web.archive.org/web/20220131051943/https://www.wto.org/english/res_e/statis_e/daily_update_e/trade_profiles/IN_e.pdf|url-status=live}}</ref> (2022)}} | ||
| export-partners = {{ublist| {{flag|United States}} 18.1%| {{flag|European Union}} 14.9%| {{flag|United Arab Emirates}} 6.4%| {{flag|China}} 5.8%| {{flag|Bangladesh}} 3.6%| Other 51.1%<ref name=wto_stat /> (FY 2021–22)}} | | export-partners = {{ublist| {{flag|United States}} 18.1%| {{flag|European Union}} 14.9%| {{flag|United Arab Emirates}} 6.4%| {{flag|China}} 5.8%| {{flag|Bangladesh}} 3.6%| Other 51.1%<ref name=wto_stat /> (FY 2021–22)}} | ||
| imports = {{increase}} $892.18 billion (FY2022-23)<ref name="trade" /> | | imports = {{increase}} $892.18 billion (FY2022-23)<ref name="trade" /> | ||
| import-goods = {{ublist|Agricultural products 7%| [[Fuels]] and mining products 33.2% | [[Manufacturers]] 52.1%| Other 7.7 %<ref name=wto_stat /> (2022)}} | | import-goods = {{ublist|Agricultural products 7%| [[Fuels]] and mining products 33.2% | [[Manufacturers]] 52.1%| Other 7.7 %<ref name=wto_stat /> (2022)}} | ||
| import-partners = {{ublist| {{flag|China}} 14.07%| {{flag|United Arab Emirates}} 7.43%| {{flag|United States}} 7.21%| {{flag|Russia}} 6.32%| {{flag|Saudi Arabia}} 5.97%| Other 59%<ref>{{cite web |title=Up to 788% rise! India's imports from these countries spiked sharply in last 10 years |date=14 March 2023 |url=https://www.businesstoday.in/latest/economy/story/up-to-788-rise-indias-imports-from-these-countries-spiked-sharply-in-last-10-years-373257-2023-03-14 |publisher=[[Business Today (India)|Business Today]] |access-date=14 March 2023}}</ref> (FY 2022–23)}} | | import-partners = {{ublist| {{flag|China}} 14.07%| {{flag|United Arab Emirates}} 7.43%| {{flag|United States}} 7.21%| {{flag|Russia}} 6.32%| {{flag|Saudi Arabia}} 5.97%| Other 59%<ref>{{cite web |title=Up to 788% rise! India's imports from these countries spiked sharply in last 10 years |date=14 March 2023 |url=https://www.businesstoday.in/latest/economy/story/up-to-788-rise-indias-imports-from-these-countries-spiked-sharply-in-last-10-years-373257-2023-03-14 |publisher=[[Business Today (India)|Business Today]] |access-date=14 March 2023 |archive-date=14 March 2023 |archive-url=https://web.archive.org/web/20230314072031/https://www.businesstoday.in/latest/economy/story/up-to-788-rise-indias-imports-from-these-countries-spiked-sharply-in-last-10-years-373257-2023-03-14 |url-status=live }}</ref> (FY 2022–23)}} | ||
| FDI = {{plainlist| | | FDI = {{plainlist| | ||
* {{increase}} $514 Billion (2021–22) <ref>{{Cite web |title=Foreign investment in India – Santandertrade.com |url=https://santandertrade.com/en/portal/establish-overseas/india/foreign-investment |access-date=2023-07-24 |website=santandertrade.com}}</ref><ref>{{Cite web |title=Invest in India |url=https://international.groupecreditagricole.com/en/international-support/india/investing |access-date=2023-07-24 |website=international.groupecreditagricole.com}}</ref> | * {{increase}} $514 Billion (2021–22) <ref>{{Cite web |title=Foreign investment in India – Santandertrade.com |url=https://santandertrade.com/en/portal/establish-overseas/india/foreign-investment |access-date=2023-07-24 |website=santandertrade.com |archive-date=24 July 2023 |archive-url=https://web.archive.org/web/20230724060012/https://santandertrade.com/en/portal/establish-overseas/india/foreign-investment |url-status=live }}</ref><ref>{{Cite web |title=Invest in India |url=https://international.groupecreditagricole.com/en/international-support/india/investing |access-date=2023-07-24 |website=international.groupecreditagricole.com |archive-date=24 July 2023 |archive-url=https://web.archive.org/web/20230724060012/https://international.groupecreditagricole.com/en/international-support/india/investing |url-status=live }}</ref> | ||
}} | }} | ||
| current account = {{plainlist| | | current account = {{plainlist| | ||
* {{IncreaseNegative}} –$120.569 billion (2022)<ref name="imf-go" /><ref>{{cite web|title=Reserve Bank of India – Press Releases|url=https://www.rbi.org.in/scripts/BS_PressReleaseDisplay.aspx?prid=53906|access-date=2022-07-08|website=www.rbi.org.in}}</ref> | * {{IncreaseNegative}} –$120.569 billion (2022)<ref name="imf-go" /><ref>{{cite web|title=Reserve Bank of India – Press Releases|url=https://www.rbi.org.in/scripts/BS_PressReleaseDisplay.aspx?prid=53906|access-date=2022-07-08|website=www.rbi.org.in|archive-date=8 July 2022|archive-url=https://web.archive.org/web/20220708103058/https://www.rbi.org.in/scripts/BS_PressReleaseDisplay.aspx?prid=53906|url-status=live}}</ref> | ||
* {{IncreaseNegative}} –3.476% of GDP (2022)<ref name="imf-go" /> | * {{IncreaseNegative}} –3.476% of GDP (2022)<ref name="imf-go" /> | ||
}} | }} | ||
| gross external debt = {{plainlist| | | gross external debt = {{plainlist| | ||
* {{IncreaseNegative}} $624.7 billion (March 2023)<ref>{{cite web|title=Reserve Bank of India – Press Releases|url=https://m.rbi.org.in//Scripts/BS_PressReleaseDisplay.aspx?prid=55959}}</ref> | * {{IncreaseNegative}} $624.7 billion (March 2023)<ref>{{cite web|title=Reserve Bank of India – Press Releases|url=https://m.rbi.org.in//Scripts/BS_PressReleaseDisplay.aspx?prid=55959|access-date=2 September 2023|archive-date=2 September 2023|archive-url=https://web.archive.org/web/20230902035331/https://m.rbi.org.in//Scripts/BS_PressReleaseDisplay.aspx?prid=55959|url-status=live}}</ref> | ||
* {{small|({{DecreasePositive}} 18.9% of GDP)}} | * {{small|({{DecreasePositive}} 18.9% of GDP)}} | ||
}} | }} | ||
| NIIP = {{DecreasePositive}} –$ | | NIIP = {{DecreasePositive}} –$379.7 billion (June 2023)<ref>{{cite web|title=Reserve Bank of India – Press Releases|url=https://www.rbi.org.in/scripts/BS_PressReleaseDisplay.aspx?prid=56461|access-date=2023-10-10|website=www.rbi.org.in|archive-date=13 October 2023|archive-url=https://web.archive.org/web/20231013153201/https://www.rbi.org.in/scripts/BS_PressReleaseDisplay.aspx?prid=56461|url-status=live}}</ref> | ||
| debt = {{plainlist| | | debt = {{plainlist| | ||
* {{decreasePositive}} {{INRConvert| | * {{decreasePositive}} {{INRConvert|246.531|t|lk=on}}<ref name="imf-go">{{cite web|title=Report for Selected Countries and Subjects|url=https://www.imf.org/en/Publications/WEO/weo-database/2023/October/weo-report?c=534,&s=GGXWDG,GGXWDG_NGDP,&sy=2021&ey=2028&ssm=0&scsm=1&scc=0&ssd=1&ssc=0&sic=0&sort=country&ds=.&br=1|access-date=2023-10-10|website=IMF|language=en|archive-date=13 October 2023|archive-url=https://web.archive.org/web/20231013153207/https://www.imf.org/en/Publications/WEO/weo-database/2023/October/weo-report?c=534,&s=GGXWDG,GGXWDG_NGDP,&sy=2021&ey=2028&ssm=0&scsm=1&scc=0&ssd=1&ssc=0&sic=0&sort=country&ds=.&br=1|url-status=live}}</ref> | ||
* {{decreasePositive}} 81. | * {{decreasePositive}} 81.9% of GDP (2023)<ref name="imf-go"/> | ||
}} | }} | ||
| balance = {{abbr|6.4% of GDP (2022–23)|Fiscal deficit}}<ref>{{Cite news|url=https://www.reuters.com/world/india/indian-budget-likely-push-spending-support-growth-while-lowering-deficit-2023-02-01/|title=India hikes spending, shuns 'outright populism' in last pre-election budget|first1=Shubham|last1=Batra|first2=Nikunj|last2=Ohri|first3=Shivangi|last3=Acharya|newspaper=Reuters |date=1 February 2023|via=www.reuters.com}}</ref> | | balance = {{abbr|6.4% of GDP (2022–23)|Fiscal deficit}}<ref>{{Cite news|url=https://www.reuters.com/world/india/indian-budget-likely-push-spending-support-growth-while-lowering-deficit-2023-02-01/|title=India hikes spending, shuns 'outright populism' in last pre-election budget|first1=Shubham|last1=Batra|first2=Nikunj|last2=Ohri|first3=Shivangi|last3=Acharya|newspaper=Reuters|date=1 February 2023|via=www.reuters.com|access-date=1 February 2023|archive-date=1 February 2023|archive-url=https://web.archive.org/web/20230201152750/https://www.reuters.com/world/india/indian-budget-likely-push-spending-support-growth-while-lowering-deficit-2023-02-01/|url-status=live}}</ref> | ||
| revenue = {{plainlist| | | revenue = {{plainlist| | ||
* {{INRConvert|27.163|t|lk=on}} | * {{INRConvert|27.163|t|lk=on}} | ||
* (2023–24) <ref name="ubudget">{{cite web |url=https://prsindia.org/budgets/parliament/union-budget-2023-24-analysis | title=Union Budget 2023–24 Analysis|access-date=11 April 2023}}</ref> | * (2023–24) <ref name="ubudget">{{cite web |url=https://prsindia.org/budgets/parliament/union-budget-2023-24-analysis |title=Union Budget 2023–24 Analysis |access-date=11 April 2023 |archive-date=20 March 2023 |archive-url=https://web.archive.org/web/20230320220502/https://prsindia.org/budgets/parliament/union-budget-2023-24-analysis |url-status=live }}</ref> | ||
}} | }} | ||
| expenses = {{plainlist| | | expenses = {{plainlist| | ||
| Line 123: | Line 120: | ||
* (2023–24) <ref name="ubudget" /> | * (2023–24) <ref name="ubudget" /> | ||
}} | }} | ||
| aid = :Donor:<br />{{increase}} $4.234 billion (2021) ($30.59 billions Line of Credit in total)<ref name="Line of Credit for Development Project">{{cite web |title=Lines of Credit for Development Projects |url=https://mea.gov.in/Lines-of-Credit-for-Development-Projects.htm#:~:text=Development%20assistance%20in%20the%20form,been%20extended%20to%2064%20countries. |website= Wristband.com|date=1 April 2017}}</ref> | | aid = :Donor:<br />{{increase}} $4.234 billion (2021) ($30.59 billions Line of Credit in total)<ref name="Line of Credit for Development Project">{{cite web |title=Lines of Credit for Development Projects |url=https://mea.gov.in/Lines-of-Credit-for-Development-Projects.htm#:~:text=Development%20assistance%20in%20the%20form,been%20extended%20to%2064%20countries. |website=Wristband.com |date=1 April 2017 |access-date=14 February 2022 |archive-date=19 January 2022 |archive-url=https://web.archive.org/web/20220119130728/https://mea.gov.in/Lines-of-Credit-for-Development-Projects.htm#:~:text=Development%20assistance%20in%20the%20form,been%20extended%20to%2064%20countries. |url-status=live }}</ref> | ||
| credit = {{plainlist| | | credit = {{plainlist| | ||
* [[Standard & Poor's]]:<ref name="Credit Rating India">{{cite news | url=https://www.theglobaleconomy.com/India/credit_rating/ | title=India: Sovereign credit ratings | work=TheGlobalEconomy.com |access-date=26 May 2020}}</ref> | * [[Standard & Poor's]]:<ref name="Credit Rating India">{{cite news | url=https://www.theglobaleconomy.com/India/credit_rating/ | title=India: Sovereign credit ratings | work=TheGlobalEconomy.com | access-date=26 May 2020 | archive-date=28 October 2020 | archive-url=https://web.archive.org/web/20201028055532/https://www.theglobaleconomy.com/India/credit_rating/ | url-status=live }}</ref> | ||
* BBB- | * BBB- | ||
* Outlook: Positive | * Outlook: Positive | ||
| Line 140: | Line 137: | ||
* BBB(low) | * BBB(low) | ||
* Outlook: Positive}} | * Outlook: Positive}} | ||
| reserves = {{ | | reserves = {{increase}} $590.781 billion{{efn|Indian reports are released on a weekly basis rather than the traditional monthly basis with the figures being of the previous week, by [[Reserve Bank of India]].}}<ref>{{Cite web|url=https://m.rbi.org.in//scripts/WSSViewDetail.aspx?PARAM1=2&TYPE=Section|title=Reserve Bank of India – Weekly Statistical Supplement|publisher=Reserve Bank of India|access-date=2023-11-10|archive-date=8 June 2021|archive-url=https://web.archive.org/web/20210608150230/https://m.rbi.org.in//Scripts/WSSViewDetail.aspx?TYPE=Section&PARAM1=2|url-status=live}}</ref> ([[List of countries by foreign-exchange reserves|4th]]) <br /> {{small|(as of 3 November 2023)}} | ||
}} | }} | ||
The ''' | The '''economy of India''' has transitioned from a [[Mixed economy|mixed]] [[planned economy]] to a [[Mixed economy|mixed]] [[Newly industrialized country|middle-income]] [[Developing country|developing]] [[social market economy]] with notable [[Public sector undertakings in India|public sector]] in strategic sectors.<ref name="Eco_info">* {{Cite news|title=Indian Economic policy: View: India needn't worry about the 'middle-income trap'|newspaper=The Economic Times|url=https://economictimes.indiatimes.com/news/economy/policy/view-india-neednt-worry-about-a-middle-income-trap/articleshow/70283084.cms?from=mdr|access-date=5 December 2020|archive-date=5 April 2023|archive-url=https://web.archive.org/web/20230405072853/https://economictimes.indiatimes.com/news/economy/policy/view-india-neednt-worry-about-a-middle-income-trap/articleshow/70283084.cms?from=mdr|url-status=live}} | ||
* {{cite book|last=Alamgir|first=Jalal|url=https://books.google.com/books?id=gj6UAgAAQBAJ&q=India+a+market+economy|title=India's Open-Economy Policy: Globalism, Rivalry, Continuity|date=2008|publisher=[[Routledge]]|isbn=978-1-135-97056-7|page=176|author-link=Jalal Alamgir|access-date=10 November 2020|archive-date=9 November 2023|archive-url=https://web.archive.org/web/20231109222926/https://books.google.com/books?id=gj6UAgAAQBAJ&q=India+a+market+economy#v=snippet&q=India%20a%20market%20economy&f=false|url-status=live}} | |||
* {{cite book| | * {{cite book|last1=Kanungo|first1=Rama P.|url=https://books.google.com/books?id=aMlaDwAAQBAJq|title=Changing the Indian Economy: Renewal, Reform and Revival|last2=Rowley|first2=Chris|last3=Banerjee|first3=Anurag N.|date=2018|publisher=[[Elsevier]]|isbn=978-0-08-102014-2|page=24}}{{Dead link|date=November 2023 |bot=InternetArchiveBot |fix-attempted=yes }} | ||
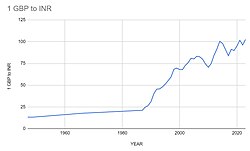
* {{cite journal |last1=Kaushik |first1=Surendra K. |title=India's Evolving Economic Model: A Perspective on Economic and Financial Reforms |journal=The American Journal of Economics and Sociology |year=1997 |volume=56 |issue=1 |pages=69–84 |doi=10.1111/j.1536-7150.1997.tb03452.x |jstor=3487351|issn=0002-9246}}</ref> It is the world's [[List of countries by GDP (nominal)|fifth-largest]] economy by [[gross domestic product|nominal GDP]] and the [[List of countries by GDP (PPP)|third-largest]] by [[purchasing power parity]] (PPP). According to the [[International Monetary Fund]] (IMF), on a [[per capita income]] basis, [[India]] [[ranked]] [[List of countries by GDP (nominal) per capita|139th by GDP (nominal)]] and [[List of countries by GDP per capita (PPP)|127th by GDP (PPP)]].<ref name="IMF2">{{cite web |url=https://www.imf.org/external/datamapper/NGDPDPC@WEO/OEMDC/ADVEC/WEOWORLD?year=2022 |title=IMF DataMapper / Datasets / World Economic Outlook (October 2022) / GDP per capita, current prices / List (2022) – Analytical group: European Union, World |date=11 October 2022 |website=IMF.org |publisher=[[International Monetary Fund]] |access-date=17 November 2022 |archive-date=14 November 2022 |archive-url=https://web.archive.org/web/20221114210550/https://www.imf.org/external/datamapper/NGDPDPC@WEO/OEMDC/ADVEC/WEOWORLD?year=2022 |url-status=live }}</ref> From [[Independence of India|independence in 1947]] until 1991, successive governments followed [[Economy of the Soviet Union|Soviet model]] and promoted [[protectionist]] economic policies, with extensive [[Sovietization]], [[state intervention]], [[Demand-side economics|demand-side economics]], [[natural resources]], [[Bureaucracy|bureaucrat driven enterprises]] and [[economic regulation]]. This is characterised as [[dirigism]], in the form of the [[Licence Raj]].<ref name=":1">{{Citation|last=Chandrasekhar|first=C. P.|title=From Dirigisme to Neoliberalism: Aspects of the Political Economy of the Transition in India|year=2012|work=Developmental Politics in Transition: The Neoliberal Era and Beyond|pages=140–165|editor-last=Kyung-Sup|editor-first=Chang|series=International Political Economy Series|place=London|publisher=Palgrave Macmillan UK|language=en|url=https://eprints.soas.ac.uk/29360/1/10731455.pdf|doi=10.1057/9781137028303_8|isbn=978-1-137-02830-3|access-date=4 September 2020|editor2-last=Fine|editor2-first=Ben|editor3-last=Weiss|editor3-first=Linda|archive-date=15 July 2021|archive-url=https://web.archive.org/web/20210715134718/https://eprints.soas.ac.uk/29360/1/10731455.pdf|url-status=live}}</ref><ref name=":2">{{cite web|last=Mazumdar|first=Surajit|year=2012|title=Industrialization, Dirigisme and Capitalists: Indian Big Business from Independence to Liberalization|url=https://mpra.ub.uni-muenchen.de/93158/|access-date=4 September 2020|website=mpra.ub.uni-muenchen.de|language=en|archive-date=18 April 2021|archive-url=https://web.archive.org/web/20210418101506/https://mpra.ub.uni-muenchen.de/93158/|url-status=live}}</ref> The end of the [[Cold War]] and an acute [[1991 Indian economic crisis|balance of payments crisis]] in 1991 led to the adoption of a broad [[economic liberalisation in India]] and [[Dirigisme|indicative planning]].<ref name="oecd" /><ref name="nyt" /> Since the start of the 21st century, [[List of countries by real GDP growth rate|annual average GDP growth]] has been 6% to 7%.<ref name="Eco_info" /> The economy of the [[Indian subcontinent]] was the [[List of regions by past GDP (PPP)|largest in the world for most of recorded history]] up until the onset of [[Colonial India|colonialism]] in early 19th century.<ref name="Maddison379" /><ref name="maddison261" /><ref>{{cite book|title=Economics and World History: Myths and Paradoxes|author=Paul Bairoch|publisher=[[University of Chicago Press]]|year=1995|page=[https://archive.org/details/economicsworldhi00bair_0/page/95 95]|url=https://archive.org/details/economicsworldhi00bair_0|url-access=registration|isbn=978-0-226-03463-8|author-link=Paul Bairoch}}</ref> India accounts for 7.2% of the [[global economy]] in 2022 in PPP terms, and around 3.4% in nominal terms in 2022.<ref name="pwc_1">{{cite web|url=http://www.pwc.com/gx/en/issues/economy/global-economy-watch/projections.html|website=PWC|title=Global Economy Watch – Projections > Real GDP / Inflation > Share of 2016 world GDP|access-date=23 June 2017|archive-date=19 October 2015|archive-url=https://web.archive.org/web/20151019092523/http://www.pwc.com/gx/en/issues/economy/global-economy-watch/projections.html|url-status=live}}</ref><ref>{{Cite web |last=Naill |first=Aaron |title=India's share of global gross domestic product |url=https://www.statista.com/statistics/271328/indias-share-of-global-gross-domestic-product-gdp/ |website=Statiata |access-date=14 October 2022 |archive-date=14 October 2022 |archive-url=https://web.archive.org/web/20221014042649/https://www.statista.com/statistics/271328/indias-share-of-global-gross-domestic-product-gdp/ |url-status=live }}</ref> | |||
India still has [[Informal economy|informal domestic economies]]; [[COVID-19 pandemic|COVID-19]] reversed both [[economic growth]] and poverty reduction; credit access weaknesses contributed to lower private consumption and inflation; and new social and infrastructure equity efforts.<ref name="CIA_IND">{{cite web|title=Field Listing: GDP – Composition, by Sector of Origin|url=https://www.cia.gov/the-world-factbook/countries/india/#economy |website=Central Intelligence Agency World Factbook|publisher=[[Central Intelligence Agency]]|access-date=April 3, 2022 | India still has [[Informal economy|informal domestic economies]]; [[COVID-19 pandemic|COVID-19]] reversed both [[economic growth]] and poverty reduction; credit access weaknesses contributed to lower private consumption and inflation; and new social and infrastructure equity efforts.<ref name="CIA_IND">{{cite web|title=Field Listing: GDP – Composition, by Sector of Origin|url=https://www.cia.gov/the-world-factbook/countries/india/#economy|website=Central Intelligence Agency World Factbook|publisher=[[Central Intelligence Agency]]|access-date=April 3, 2022|archive-date=18 March 2021|archive-url=https://web.archive.org/web/20210318202107/https://www.cia.gov/the-world-factbook/countries/india#economy|url-status=live}}</ref> Economic growth slowed down in 2017 due to the shocks of "[[2016 Indian banknote demonetisation|demonetisation]]" in 2016 and the introduction of the [[Goods and Services Tax (India)|Goods and Services Tax]] in 2017.<ref>{{cite journal |last1=Nagaraj |first1=R |title=Understanding India's Economic Slowdown |journal=The India Forum |date=20 January 2020 |url=https://www.theindiaforum.in/article/understanding-india-s-economic-slowdown |access-date=11 May 2022 |language=en |archive-date=11 June 2022 |archive-url=https://web.archive.org/web/20220611212419/https://www.theindiaforum.in/article/understanding-india-s-economic-slowdown |url-status=live }}</ref> Nearly 70% of India's GDP is driven by domestic consumption.<ref>{{cite web |url=https://data.worldbank.org/indicator/NE.CON.TOTL.ZS?most_recent_value_desc=true&locations=IN |title=Final consumption expenditure (% of GDP) – India |work=[[World Bank]] |access-date=11 March 2022 |archive-date=18 May 2022 |archive-url=https://web.archive.org/web/20220518055752/https://data.worldbank.org/indicator/NE.CON.TOTL.ZS?most_recent_value_desc=true&locations=IN |url-status=live }}</ref> The country remains the world's [[List of largest consumer markets|sixth-largest consumer market]].<ref>{{cite web|url=https://data.worldbank.org/indicator/NE.CON.PRVT.CD?most_recent_value_desc=true&year_high_desc=true|title=Household final consumption expenditure (current US$) {{!}} Data|publisher=World Bank|language=en-us|access-date=7 April 2018|archive-date=11 November 2020|archive-url=https://web.archive.org/web/20201111211439/https://data.worldbank.org/indicator/NE.CON.PRVT.CD?most_recent_value_desc=true|url-status=live}}</ref> Apart from private [[Consumption (economics)|consumption]], India's GDP is also fueled by [[government spending]], [[Investment|investments]], and [[Export|exports]].<ref>{{cite news |url=https://timesofindia.indiatimes.com/business/india-business/is-your-debt-dragging-the-economy-down/articleshow/71082520.cms |title=Is your debt dragging the economy down? |work=The Times of India |date=11 September 2019 |access-date=11 September 2019 |archive-date=8 July 2022 |archive-url=https://web.archive.org/web/20220708155130/https://timesofindia.indiatimes.com/business/india-business/is-your-debt-dragging-the-economy-down/articleshow/71082520.cms |url-status=live }}</ref> In 2022, India was the world's [[List of countries by imports|6th-largest importer]] and the [[List of countries by exports|9th-largest exporter]].<ref>{{cite web |url=https://www.wto.org/english/res_e/booksp_e/wtsr_2022_e.pdf |title=World Trade Statistical Review 2022 |work=[[World Trade Organization]] |page=58 |access-date=11 March 2023 |archive-date=13 March 2023 |archive-url=https://web.archive.org/web/20230313050827/https://www.wto.org/english/res_e/booksp_e/wtsr_2022_e.pdf |url-status=live }}</ref> India has been a member of the [[World Trade Organization]] since 1 January 1995.<ref>{{cite web|url=https://www.wto.org/english/thewto_e/countries_e/india_e.htm|publisher=WTO|title=India – Member information|access-date=5 September 2019|archive-date=21 May 2022|archive-url=https://web.archive.org/web/20220521070029/https://www.wto.org/english/thewto_e/countries_e/india_e.htm|url-status=live}}</ref> It ranks 63rd on the [[Ease of doing business index]] and 40th on the Global Competitiveness Index.<ref>{{cite news |title=Singapore falls one spot to 4th in 2023 global competitiveness index, India ranks 40th |url=https://economictimes.indiatimes.com/news/india/singapore-falls-one-spot-to-4th-in-2023-global-competitiveness-index-india-ranks-40th/articleshow/101265654.cms?from=mdr |access-date=19 September 2023 |work=The Economic Times |agency=ANI |date=26 June 2023 |archive-date=29 September 2023 |archive-url=https://web.archive.org/web/20230929001604/https://economictimes.indiatimes.com/news/india/singapore-falls-one-spot-to-4th-in-2023-global-competitiveness-index-india-ranks-40th/articleshow/101265654.cms?from=mdr |url-status=live }}</ref> Due to extreme rupee/dollar [[Exchange rate|rate fluctuations]] India's nominal GDP fluctuates significantly.<ref>{{cite web |url=https://www.livemint.com/budget/opinion/we-can-strike-the-gdp-target-provided-economy-does-well-rupee-appreciates-1562353376032.html |title=Opinion – We can strike the GDP target, provided economy does well, rupee appreciates |last=Debroy |first=Bibek |date=6 July 2019 |website=livemint.com |publisher=[[Mint (newspaper)|Mint]] |access-date= |quote= |archive-date=20 May 2022 |archive-url=https://web.archive.org/web/20220520062938/https://www.livemint.com/budget/opinion/we-can-strike-the-gdp-target-provided-economy-does-well-rupee-appreciates-1562353376032.html |url-status=live }}</ref> With 476 million workers, the [[Labour in India|Indian labour force]] is the [[List of countries by labour force|world's second-largest]].<ref name="WB_labor">{{cite web |url=https://data.worldbank.org/indicator/SL.TLF.TOTL.IN?locations=IN |title=Labor force, total – India |publisher=World Bank & [[International Labour Organization|ILO]] |access-date=22 December 2022 |archive-date=30 January 2023 |archive-url=https://web.archive.org/web/20230130024828/https://data.worldbank.org/indicator/SL.TLF.TOTL.IN?locations=IN |url-status=live }}</ref> India has one of the world's [[List of countries by the number of billionaires|highest number of billionaires]] and extreme [[Income inequality in India|income inequality]].<ref>{{cite news|url=https://economictimes.indiatimes.com/news/economy/indicators/wealth-of-indias-richest-1-more-than-4-times-of-total-for-70-poorest-oxfam/articleshow/73416122.cms|title=Wealth of India's richest 1% more than 4-times of total for 70% poorest: Oxfam|work=The Economic Times|access-date=20 January 2020|archive-date=20 April 2021|archive-url=https://web.archive.org/web/20210420072830/https://economictimes.indiatimes.com/news/economy/indicators/wealth-of-indias-richest-1-more-than-4-times-of-total-for-70-poorest-oxfam/articleshow/73416122.cms|url-status=live}}</ref><ref>{{cite web|url=https://www.bbc.com/news/world-asia-india-36186116|title=Indian inequality still hidden|first=Justin|last=Rowlatt|date=2 May 2016|publisher=BBC|access-date=22 January 2020|archive-date=14 July 2020|archive-url=https://web.archive.org/web/20200714231303/https://www.bbc.com/news/world-asia-india-36186116|url-status=live}}</ref> The number of income tax returns filed has been increasing year on year reaching a record 6,77,00,000 income tax returns for the 2023-24 financial year filed by 31st July 2023; this was a 16.1% increase on the previous year when 5,83,00,000 tax returns were filed by 31 July 2022.<ref name="PIB-01Aug23">{{cite news |title=New record of over 6.77 crore Income Tax Returns (ITRs) filed till 31st July, 2023; record growth of 16.1% Year-on-Year |url=https://pib.gov.in/PressReleaseIframePage.aspx?PRID=1944821 |access-date=19 September 2023 |work=pib.gov.in |date=1 August 2023 |archive-date=29 September 2023 |archive-url=https://web.archive.org/web/20230929001605/https://pib.gov.in/PressReleaseIframePage.aspx?PRID=1944821 |url-status=live }}</ref> Income-Tax Department said that it was a "fair indication of widening of [the] tax base" that 53,67,000 of the tax returns were by people who had never filed a tax return before.<ref name="PIB-01Aug23"/> | ||
During the [[2008 global financial crisis]], the economy faced a mild slowdown. India endorsed [[Keynesian economics|Keynesian policy]] and initiated [[Stimulus (economics)|stimulus measures]] (both [[Fiscal policy|fiscal]] and [[Monetary policy|monetary]]) to boost growth and generate [[demand]]. In subsequent years, economic growth revived.<ref>{{cite news|url=https://www.livemint.com/Politics/CMJ5nWjNnZnWquihUArZCJ/Govt-announces-stimulus-package-including-tax-cuts.html|title=Govt announces stimulus package, including tax cuts |newspaper=[[Mint (newspaper)|Live Mint]]|access-date=7 December 2008}}</ref> According to the [[World Bank]], to achieve [[sustainable economic development]], India must focus on public sector reform, [[Transport in India|infrastructure]], [[Agriculture in India|agricultural]] and rural development, removal of [[Land acquisition in India|land]] and [[Labour in India|labour regulations]], [[financial inclusion]], spur private investment and exports, [[Education in India|education]], and [[Healthcare in India|public health]].<ref>{{cite web |url=https://www.worldbank.org/en/country/india/overview |title=India Country Overview |publisher=[[World Bank]] |access-date=20 January 2019}}</ref> | During the [[2008 global financial crisis]], the economy faced a mild slowdown. India endorsed [[Keynesian economics|Keynesian policy]] and initiated [[Stimulus (economics)|stimulus measures]] (both [[Fiscal policy|fiscal]] and [[Monetary policy|monetary]]) to boost growth and generate [[demand]]. In subsequent years, economic growth revived.<ref>{{cite news|url=https://www.livemint.com/Politics/CMJ5nWjNnZnWquihUArZCJ/Govt-announces-stimulus-package-including-tax-cuts.html|title=Govt announces stimulus package, including tax cuts|newspaper=[[Mint (newspaper)|Live Mint]]|access-date=7 December 2008|archive-date=21 June 2022|archive-url=https://web.archive.org/web/20220621031506/https://www.livemint.com/Politics/CMJ5nWjNnZnWquihUArZCJ/Govt-announces-stimulus-package-including-tax-cuts.html|url-status=live}}</ref> According to the [[World Bank]], to achieve [[sustainable economic development]], India must focus on public sector reform, [[Transport in India|infrastructure]], [[Agriculture in India|agricultural]] and rural development, removal of [[Land acquisition in India|land]] and [[Labour in India|labour regulations]], [[financial inclusion]], spur private investment and exports, [[Education in India|education]], and [[Healthcare in India|public health]].<ref>{{cite web |url=https://www.worldbank.org/en/country/india/overview |title=India Country Overview |publisher=[[World Bank]] |access-date=20 January 2019 |archive-date=18 November 2021 |archive-url=https://web.archive.org/web/20211118154214/https://www.worldbank.org/en/country/india/overview |url-status=live }}</ref> The period between 2004 and 2014 is referred to as India’s lost decade as India fell behind other BRIC economies.<ref>{{Cite web |url=https://www.livemint.com/Opinion/pJn6VtNuSyLCIkQFwx5OqN/2004-to-2014Indias-lost-decade.html |title=Archived copy |access-date=12 October 2023 |archive-date=19 October 2023 |archive-url=https://web.archive.org/web/20231019140801/https://www.livemint.com/Opinion/pJn6VtNuSyLCIkQFwx5OqN/2004-to-2014Indias-lost-decade.html |url-status=live }}</ref><ref>{{Cite web |url=https://www.firstpost.com/opinion/indias-lost-decade-falling-behind-bric-economies-between-2004-and-2014-and-the-subsequent-recovery-13073382.html |title=Archived copy |access-date=12 October 2023 |archive-date=11 October 2023 |archive-url=https://web.archive.org/web/20231011070711/https://www.firstpost.com/opinion/indias-lost-decade-falling-behind-bric-economies-between-2004-and-2014-and-the-subsequent-recovery-13073382.html |url-status=live }}</ref> | ||
In 2022, India's ten [[List of the largest trading partners of India|largest trading partners]] were the [[United States]], [[China]], [[United Arab Emirates]] (UAE), [[Saudi Arabia]], [[Russia]], [[Germany]], [[Hong Kong]], [[Indonesia]], [[South Korea]], and [[Malaysia]].<ref>{{cite web|url=https://tradestat.commerce.gov.in/eidb/ecnt.asp|title=Total Trade|date=2019–2020|website=commerce.gov.in/|publisher=Department of Commerce|access-date=27 December 2020}}</ref> In 2021–22, the [[Foreign direct investment in India|foreign direct investment]] (FDI) in India was $82 billion. The leading sectors for FDI inflows were the service sector, the computer industry, and the telecom industry.<ref>{{cite web |url=https://dpiit.gov.in/sites/default/files/IPP_ANNUAL_REPORT_ENGLISH.pdf |title=FDI Statistics |work= Department for Promotion of Industry and Internal Trade, MoCI, GoI |access-date=31 May 2022}}</ref> India has [[free trade agreement]]s with several nations and blocs, including [[ASEAN]], [[South Asian Free Trade Area|SAFTA]], [[Mercosur]], South Korea, Japan, Australia, UAE, and several others which are in effect or under negotiating stage.<ref>{{cite web |title=By Country/Economy – Free Trade Agreements |url=https://aric.adb.org/fta-country |website=aric.adb.org |access-date=30 August 2019}}</ref><ref>{{cite web|url=https://aric.adb.org/database/fta|title=ASIA REGIONAL INTEGRATION CENTER|website=ASIA REGIONAL INTEGRATION CENTER|archive-url=https://web.archive.org/web/20190829160702/https://aric.adb.org/database/fta|archive-date=29 August 2019|url-status=live|access-date=29 August 2019}}</ref> | In 2022, India's ten [[List of the largest trading partners of India|largest trading partners]] were the [[United States]], [[China]], [[United Arab Emirates]] (UAE), [[Saudi Arabia]], [[Russia]], [[Germany]], [[Hong Kong]], [[Indonesia]], [[South Korea]], and [[Malaysia]].<ref>{{cite web|url=https://tradestat.commerce.gov.in/eidb/ecnt.asp|title=Total Trade|date=2019–2020|website=commerce.gov.in/|publisher=Department of Commerce|access-date=27 December 2020|archive-date=9 November 2023|archive-url=https://web.archive.org/web/20231109222933/https://tradestat.commerce.gov.in/eidb/error.htm|url-status=live}}</ref> In 2021–22, the [[Foreign direct investment in India|foreign direct investment]] (FDI) in India was $82 billion. The leading sectors for FDI inflows were the service sector, the computer industry, and the telecom industry.<ref>{{cite web |url=https://dpiit.gov.in/sites/default/files/IPP_ANNUAL_REPORT_ENGLISH.pdf |title=FDI Statistics |work=Department for Promotion of Industry and Internal Trade, MoCI, GoI |access-date=31 May 2022 |archive-date=27 July 2022 |archive-url=https://web.archive.org/web/20220727164626/https://dpiit.gov.in/sites/default/files/IPP_ANNUAL_REPORT_ENGLISH.pdf |url-status=live }}</ref> India has [[free trade agreement]]s with several nations and blocs, including [[ASEAN]], [[South Asian Free Trade Area|SAFTA]], [[Mercosur]], South Korea, Japan, Australia, UAE, and several others which are in effect or under negotiating stage.<ref>{{cite web |title=By Country/Economy – Free Trade Agreements |url=https://aric.adb.org/fta-country |website=aric.adb.org |access-date=30 August 2019 |archive-date=11 November 2020 |archive-url=https://web.archive.org/web/20201111195902/https://aric.adb.org/fta-country |url-status=live }}</ref><ref>{{cite web|url=https://aric.adb.org/database/fta|title=ASIA REGIONAL INTEGRATION CENTER|website=ASIA REGIONAL INTEGRATION CENTER|archive-url=https://web.archive.org/web/20190829160702/https://aric.adb.org/database/fta|archive-date=29 August 2019|url-status=live|access-date=29 August 2019}}</ref> | ||
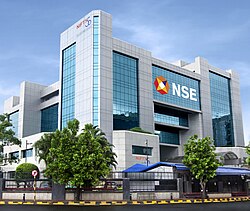
The [[service sector]] makes up more than 50% of GDP and remains the fastest growing sector, while the [[industrial sector]] and the [[agricultural sector]] employs a majority of the labor force.<ref name="auto">{{cite news|url=http://m.thehindu.com/business/budget/india-has-second-fastest-growing-services-sector/article6193500.ece|work=The Hindu|title=India has second fastest growing services sector | The [[service sector]] makes up more than 50% of GDP and remains the fastest growing sector, while the [[industrial sector]] and the [[agricultural sector]] employs a majority of the labor force.<ref name="auto">{{cite news|url=http://m.thehindu.com/business/budget/india-has-second-fastest-growing-services-sector/article6193500.ece|work=The Hindu|title=India has second fastest growing services sector|access-date=18 June 2015|archive-date=16 May 2016|archive-url=http://arquivo.pt/wayback/20160516233427/http://m.thehindu.com/business/budget/india-has-second-fastest-growing-services-sector/article6193500.ece|url-status=live}}</ref> The [[Bombay Stock Exchange]] and [[National Stock Exchange of India|National Stock Exchange]] are some of the world's [[List of stock exchanges|largest stock exchanges]] by [[market capitalization|market capitalisation]].<ref>{{cite web|url=https://www.world-exchanges.org/our-work/statistics|title=Monthly Reports – World Federation of Exchanges|publisher=WFE|access-date=31 August 2019|archive-date=12 September 2019|archive-url=https://web.archive.org/web/20190912130053/https://www.world-exchanges.org/our-work/statistics|url-status=live}}</ref> India is the world's [[List of countries by manufacturing output|sixth-largest manufacturer]], representing 2.6% of global manufacturing output.<ref>{{cite web|url=https://data.worldbank.org/indicator/NV.IND.MANF.CD?most_recent_value_desc=true|title=Manufacturing, value added (current US$) {{!}} Data|publisher=World Bank|language=en-us|access-date=11 November 2018|archive-date=7 January 2020|archive-url=https://web.archive.org/web/20200107135049/https://data.worldbank.org/indicator/NV.IND.MANF.CD?most_recent_value_desc=true|url-status=live}}</ref> Nearly 65% of India's population is rural,<ref name="world bank_rural population">{{cite web|url=https://data.worldbank.org/indicator/SP.RUR.TOTL.ZS?name_desc=false|title=Rural Population (% of Total Population)|date=1 May 2016|publisher=World Bank|access-date=14 July 2020|archive-date=14 July 2020|archive-url=https://web.archive.org/web/20200714171721/https://data.worldbank.org/indicator/SP.RUR.TOTL.ZS?name_desc=false|url-status=live}}</ref> and contributes about 50% of India's GDP.<ref name="bs_India">{{Cite news|url=https://www.business-standard.com/article/b2b-connect/india-an-agricultural-powerhouse-of-the-world-116051800253_1.html|title=India: An agricultural powerhouse of the world|date=1 May 2016|newspaper=Business Standard India|access-date=8 January 2019|archive-date=28 June 2022|archive-url=https://web.archive.org/web/20220628044812/https://www.business-standard.com/article/b2b-connect/india-an-agricultural-powerhouse-of-the-world-116051800253_1.html|url-status=live}}</ref> It has the world's [[List of countries by foreign-exchange reserves|fifth-largest]] foreign-exchange reserves worth $561 billion.<ref name="RBI_reserves">{{cite web|title = Weekly statistical supplement|url = https://m.rbi.org.in/scripts/WSSViewDetail.aspx?TYPE=Section&PARAM1=2|work = [[Reserve Bank of India]]|access-date = 2 December 2022|archive-date = 29 March 2019|archive-url = https://web.archive.org/web/20190329172637/https://m.rbi.org.in/scripts/WSSViewDetail.aspx?TYPE=Section&PARAM1=2|url-status = live}}</ref> India has a high [[public debt]] with 83% of GDP, while its [[fiscal deficit]] stood at 6.4% of GDP.<ref>{{cite news|url=https://www.business-standard.com/article/economy-policy/fiscal-deficit-for-fy22-at-6-7-of-gdp-lower-than-earlier-estimate-govt-122053100971_1.html|title=Fiscal deficit for FY22 at 6.7% of GDP lower than earlier estimate|newspaper=Business Standard India|date=31 May 2022|agency=Press Trust of India|access-date=15 June 2022|archive-date=9 June 2022|archive-url=https://web.archive.org/web/20220609103437/https://www.business-standard.com/article/economy-policy/fiscal-deficit-for-fy22-at-6-7-of-gdp-lower-than-earlier-estimate-govt-122053100971_1.html|url-status=live}}</ref> India faces high [[Unemployment in India|unemployment]], rising [[Income inequality in India|income inequality]], and a drop in [[aggregate demand]].<ref>{{cite web|url=https://unemploymentinindia.cmie.com/|title=Unemployment Rate in India|work=Centre for Monitoring Indian Economy|access-date=1 October 2019|archive-date=10 November 2021|archive-url=https://web.archive.org/web/20211110164803/https://unemploymentinindia.cmie.com/|url-status=live}}</ref><ref>{{cite web|url=https://www.moneycontrol.com/news/podcast/digging-deeper-is-indias-economy-losing-its-way-4427191.html|title=Digging Deeper, Is India's economy losing its way?|website=moneycontrol.com|date=11 September 2019|language=en-us|access-date=9 November 2019|archive-date=14 April 2021|archive-url=https://web.archive.org/web/20210414051659/https://www.moneycontrol.com/news/podcast/digging-deeper-is-indias-economy-losing-its-way-4427191.html|url-status=live}}</ref> India's gross domestic savings rate stood at 29.3% of GDP in 2022.<ref>{{cite web|url=https://www.rbi.org.in/scripts/PublicationsView.aspx?id=20623|title=Reserve Bank of India – Publications|work=Reserve Bank of India|access-date=8 July 2022|archive-date=8 July 2022|archive-url=https://web.archive.org/web/20220708104448/https://www.rbi.org.in/scripts/PublicationsView.aspx?id=20623|url-status=live}}</ref> In recent years, independent economists and financial institutions have accused the government of manipulating various economic data, especially GDP growth.<ref>{{cite news|url=https://www.reuters.com/article/us-india-economy-data-insight/indias-incredulous-data-economists-create-own-benchmarks-idUSKCN1SF0L6|title=India's incredulous data: Economists create own benchmarks|work=[[Reuters]]|date=9 May 2019|access-date=9 May 2019|last1=Kumar|first1=Manoj|archive-date=9 May 2019|archive-url=https://web.archive.org/web/20190509085922/https://www.reuters.com/article/us-india-economy-data-insight/indias-incredulous-data-economists-create-own-benchmarks-idUSKCN1SF0L6|url-status=live}}</ref><ref>{{cite news|url=https://www.business-standard.com/article/economy-policy/gdp-data-under-cloud-govt-should-know-that-this-is-a-crisis-of-credibility-119061300134_1.html|title=GDP data under cloud: Govt should know that this is a crisis of credibility|work=[[Business Standard]]|date=13 June 2019|access-date=13 June 2019|last1=Sharma|first1=Mihir S.|archive-date=13 June 2019|archive-url=https://web.archive.org/web/20190613040500/https://www.business-standard.com/article/economy-policy/gdp-data-under-cloud-govt-should-know-that-this-is-a-crisis-of-credibility-119061300134_1.html|url-status=live}}</ref> India's overall [[Welfare state#Social expenditure as a percentage of GDP|social spending as a share of GDP]] in 2021–22 will be 8.6%, which is much lower than the average for [[OECD]] nations.<ref>[https://pib.gov.in/Pressreleaseshare.aspx?PRID=1793817 Government's spending on Social Services increased significantly during the pandemic] {{Webarchive|url=https://web.archive.org/web/20221107064604/https://pib.gov.in/Pressreleaseshare.aspx?PRID=1793817 |date=7 November 2022 }} Press Information Bureau. Government of India, Ministry of Finance 31 January 2022. Retrieved 29 November 2022.</ref><ref>{{Cite web|url=https://www.indiabudget.gov.in/economicsurvey/ebook_es2022/files/basic-html/page377.html|title=Page 377 – economic_survey_2021-2022|website=www.indiabudget.gov.in|access-date=7 November 2022|archive-date=7 November 2022|archive-url=https://web.archive.org/web/20221107070110/https://www.indiabudget.gov.in/economicsurvey/ebook_es2022/files/basic-html/page377.html|url-status=live}}</ref> | ||
== History == | == History == | ||
| Line 164: | Line 161: | ||
| image3 = Ateshgah temple inscription.png|caption3=[[Ateshgah of Baku|Atashgah]] is a temple built by Indian traders before 1745, west of the [[Caspian Sea]]. The inscription shown, is a [[Sanskrit]] invocation of Lord [[Shiva]]. | | image3 = Ateshgah temple inscription.png|caption3=[[Ateshgah of Baku|Atashgah]] is a temple built by Indian traders before 1745, west of the [[Caspian Sea]]. The inscription shown, is a [[Sanskrit]] invocation of Lord [[Shiva]]. | ||
}} | }} | ||
For a continuous duration of nearly 1700 years from the year 1 CE, India was the | For a continuous duration of nearly 1700 years from the year 1 CE, India was the world's largest economy, constituting 35 to 40% of the world GDP.<ref>{{cite web|url=http://www.visualcapitalist.com/2000-years-economic-history-one-chart/|title=2000 years economic history one chart|access-date=29 August 2017|archive-date=9 September 2017|archive-url=https://web.archive.org/web/20170909213431/http://www.visualcapitalist.com/2000-years-economic-history-one-chart/|url-status=live}}</ref> The combination of [[protectionist]], [[import-substitution]], [[Fabian Society|Fabian socialism]], and [[Social democracy|social democratic]]-inspired policies governed India for sometime after the end of [[British Raj|British rule]]. The economy was then characterised as [[Dirigisme|Dirigism]],<ref name=":1" /><ref name=":2" /> It had extensive regulation, [[protectionism]], [[public ownership]] of large monopolies, pervasive corruption and slow growth.<ref name="oecd" /><ref name="nyt" /><ref name="potential">{{cite web|url=http://www.usindiafriendship.net/viewpoints1/Indias_Rising_Growth_Potential.pdf|title=India's Rising Growth Potential|publisher=Goldman Sachs|year=2007|access-date=21 June 2009|url-status=dead|archive-url=https://web.archive.org/web/20110724120152/http://www.usindiafriendship.net/viewpoints1/Indias_Rising_Growth_Potential.pdf|archive-date=24 July 2011}}</ref> Since 1991, [[Economic liberalisation in India|continuing economic liberalisation]] has moved the country towards a [[market economy|market-based economy]].<ref name="oecd">{{cite web|url=http://www.oecd.org/dataoecd/17/52/39452196.pdf |title=Economic survey of India 2007: Policy Brief |publisher=[[OECD]] |access-date=21 June 2009 |url-status=dead |archive-url=https://web.archive.org/web/20110606112149/http://www.oecd.org/dataoecd/17/52/39452196.pdf |archive-date= 6 June 2011 }}</ref><ref name="nyt">{{cite news|url=https://www.nytimes.com/1992/08/15/world/india-stumbles-in-rush-to-a-free-market-economy.html|title=India Stumbles in Rush to a Free Market Economy|newspaper=[[The New York Times]]|date=15 August 1992|author=Edward A. Gargan|access-date=17 January 2011|archive-date=8 February 2011|archive-url=https://web.archive.org/web/20110208134134/http://www.nytimes.com/1992/08/15/world/india-stumbles-in-rush-to-a-free-market-economy.html|url-status=live}}</ref> By 2008, India had established itself as one of the world's faster-growing economies. | ||
=== Ancient and medieval eras === | === Ancient and medieval eras === | ||
| Line 174: | Line 171: | ||
==== Silk Route ==== | ==== Silk Route ==== | ||
Other scholars suggest trading from India to West Asia and Eastern Europe was active between the 14th and 18th centuries.<ref name="hanway1753">{{Citation | title=An Historical Account of the British Trade Over the Caspian Sea | first=Jonas| last=Hanway | year=1753 | publisher=Sold by Mr. Dodsley | url=https://books.google.com/books?id=etApAAAAYAAJ | quote=''... The Persians have very little maritime strength ... their ship carpenters on the Caspian were mostly Indians ... there is a little temple, in which the Indians now worship''}}</ref><ref name="dale2002">{{Citation | title=Indian Merchants and Eurasian Trade, 1600–1750 | author=Stephen Frederic Dale | year=2002 | publisher=Cambridge University Press | isbn=0-521-52597-7 | url=https://books.google.com/books?id=GqEWw_54uVUC | quote=''... The Russian merchant, F.A. Kotov ... saw in Isfahan in 1623, both Hindus and Muslims, as Multanis.''}}</ref><ref name="levi2002">{{Citation | title=The Indian diaspora in Central Asia and its trade, 1550–1900 | author=Scott Cameron Levi | year=2002 | publisher=BRILL | isbn=90-04-12320-2 | url=https://books.google.com/books?id=9qVkNBge8mIC | quote=''... George Forster ... On the 31st of March, I visited the Atashghah or place of fire; and on making myself known to the Hindoo mendicants, who resided there, I was received among these sons of Brihma as a brother''}}</ref> During this period, Indian traders settled in [[Suraxanı raion|Surakhani]], a suburb of greater [[Baku]], Azerbaijan. These traders built a [[Ateshgah of Baku|Hindu temple]], which suggests commerce was active and prosperous for Indians by the 17th century.<ref name="jackson1911">{{Citation | title=From Constantinople to the home of Omar Khayyam: travels in Transcaucasia and northern Persia for historic and literary research | author=Abraham Valentine Williams Jackson | year=1911 | publisher=The Macmillan company | url=https://books.google.com/books?id=Z4aBAAAAIAAJ }}</ref><ref name="forster1798">{{Citation | title=A journey from Bengal to England: through the northern part of India, Kashmire, Afghanistan, and Persia, and into Russia, by the Caspian-Sea | author=George Forster | year=1798 | publisher=R. Faulder | url=https://books.google.com/books?id=CSkQAAAAYAAJ | quote=''... A society of [[Multan|Moultan]] Hindoos, which has long been established in Baku, contributes largely to the circulation of its commerce; and with the Armenians, they may be accounted the principal merchants of Shirwan ...''| author-link=George Forster (traveller) }}</ref><ref name="morier1818">{{Citation | title=A Second Journey through Persia, Armenia, and Asia Minor, to Constantinople, between the Years 1810 and 1816 | author=James Justinian Morier | year=1818 | publisher=A. Strahan | url=https://books.google.com/books?id=VjdtPAAACAAJ}}</ref><ref name="usgovt1887hd">{{Citation | title=Reports from the consuls of the United States, 1887 | author=United States Bureau of Foreign Commerce | year=1887 | publisher=United States Government |url=https://books.google.com/books?id=KBASAAAAYAAJ | quote=''... Six or 7 miles southeast is Surakhani, the location of a very ancient monastery of the fire-worshippers of India ...''}}</ref> | Other scholars suggest trading from India to West Asia and Eastern Europe was active between the 14th and 18th centuries.<ref name="hanway1753">{{Citation | title=An Historical Account of the British Trade Over the Caspian Sea | first=Jonas | last=Hanway | year=1753 | publisher=Sold by Mr. Dodsley | url=https://books.google.com/books?id=etApAAAAYAAJ | quote=''... The Persians have very little maritime strength ... their ship carpenters on the Caspian were mostly Indians ... there is a little temple, in which the Indians now worship'' | access-date=14 November 2015 | archive-date=9 November 2023 | archive-url=https://web.archive.org/web/20231109222928/https://books.google.com/books?id=etApAAAAYAAJ | url-status=live }}</ref><ref name="dale2002">{{Citation | title=Indian Merchants and Eurasian Trade, 1600–1750 | author=Stephen Frederic Dale | year=2002 | publisher=Cambridge University Press | isbn=0-521-52597-7 | url=https://books.google.com/books?id=GqEWw_54uVUC | quote=''... The Russian merchant, F.A. Kotov ... saw in Isfahan in 1623, both Hindus and Muslims, as Multanis.'' | access-date=14 November 2015 | archive-date=9 November 2023 | archive-url=https://web.archive.org/web/20231109222930/https://books.google.com/books?id=GqEWw_54uVUC | url-status=live }}</ref><ref name="levi2002">{{Citation | title=The Indian diaspora in Central Asia and its trade, 1550–1900 | author=Scott Cameron Levi | year=2002 | publisher=BRILL | isbn=90-04-12320-2 | url=https://books.google.com/books?id=9qVkNBge8mIC | quote=''... George Forster ... On the 31st of March, I visited the Atashghah or place of fire; and on making myself known to the Hindoo mendicants, who resided there, I was received among these sons of Brihma as a brother'' }}{{Dead link|date=September 2023 |bot=InternetArchiveBot |fix-attempted=yes }}</ref> During this period, Indian traders settled in [[Suraxanı raion|Surakhani]], a suburb of greater [[Baku]], Azerbaijan. These traders built a [[Ateshgah of Baku|Hindu temple]], which suggests commerce was active and prosperous for Indians by the 17th century.<ref name="jackson1911">{{Citation | title=From Constantinople to the home of Omar Khayyam: travels in Transcaucasia and northern Persia for historic and literary research | author=Abraham Valentine Williams Jackson | year=1911 | publisher=The Macmillan company | url=https://books.google.com/books?id=Z4aBAAAAIAAJ | access-date=14 November 2015 | archive-date=26 March 2023 | archive-url=https://web.archive.org/web/20230326205033/https://books.google.com/books?id=Z4aBAAAAIAAJ | url-status=live }}</ref><ref name="forster1798">{{Citation | title=A journey from Bengal to England: through the northern part of India, Kashmire, Afghanistan, and Persia, and into Russia, by the Caspian-Sea | author=George Forster | year=1798 | publisher=R. Faulder | url=https://books.google.com/books?id=CSkQAAAAYAAJ | quote=''... A society of [[Multan|Moultan]] Hindoos, which has long been established in Baku, contributes largely to the circulation of its commerce; and with the Armenians, they may be accounted the principal merchants of Shirwan ...'' | author-link=George Forster (traveller) | access-date=14 November 2015 | archive-date=9 November 2023 | archive-url=https://web.archive.org/web/20231109222928/https://books.google.com/books?id=CSkQAAAAYAAJ | url-status=live }}</ref><ref name="morier1818">{{Citation | title=A Second Journey through Persia, Armenia, and Asia Minor, to Constantinople, between the Years 1810 and 1816 | author=James Justinian Morier | year=1818 | publisher=A. Strahan | url=https://books.google.com/books?id=VjdtPAAACAAJ}}</ref><ref name="usgovt1887hd">{{Citation | title=Reports from the consuls of the United States, 1887 | author=United States Bureau of Foreign Commerce | year=1887 | publisher=United States Government | url=https://books.google.com/books?id=KBASAAAAYAAJ | quote=''... Six or 7 miles southeast is Surakhani, the location of a very ancient monastery of the fire-worshippers of India ...'' | access-date=14 November 2015 | archive-date=9 November 2023 | archive-url=https://web.archive.org/web/20231109222930/https://books.google.com/books?id=KBASAAAAYAAJ | url-status=live }}</ref> | ||
Further north, the [[Saurashtra (region)|Saurashtra]] and [[Bengal]] coasts played an important role in maritime trade, and the [[Gangetic plains]] and the [[Indus valley]] housed several centres of river-borne commerce. Most overland trade was carried out via the [[Khyber Pass]] connecting the [[Punjab region]] with Afghanistan and onward to the Middle East and Central Asia.<ref>{{Harvnb|Raychaudhuri|Habib|2004|pp=10–13}}</ref> Although many kingdoms and rulers issued coins, [[barter]] was prevalent. Villages paid a portion of their agricultural produce as revenue to the rulers, while their craftsmen received a part of the crops at harvest time for their services.<ref name="Dutt-1">{{Harvnb|Datt|Sundharam|2009|page=14}}</ref> | Further north, the [[Saurashtra (region)|Saurashtra]] and [[Bengal]] coasts played an important role in maritime trade, and the [[Gangetic plains]] and the [[Indus valley]] housed several centres of river-borne commerce. Most overland trade was carried out via the [[Khyber Pass]] connecting the [[Punjab region]] with Afghanistan and onward to the Middle East and Central Asia.<ref>{{Harvnb|Raychaudhuri|Habib|2004|pp=10–13}}</ref> Although many kingdoms and rulers issued coins, [[barter]] was prevalent. Villages paid a portion of their agricultural produce as revenue to the rulers, while their craftsmen received a part of the crops at harvest time for their services.<ref name="Dutt-1">{{Harvnb|Datt|Sundharam|2009|page=14}}</ref> | ||
| Line 186: | Line 183: | ||
}} | }} | ||
=== Mughal | === Mughal, Rajput, and Maratha eras (1526–1820) === | ||
{{See also|Muslin trade in Bengal|Economy of the Kingdom of Mysore}} | {{See also|Muslin trade in Bengal|Economy of the Kingdom of Mysore}} | ||
The Indian economy was largest and most prosperous throughout | The Indian economy was the largest and most prosperous throughout world history and would continue to be under the [[Mughal Empire]], up until the 18th century.<ref name="schmidt">Karl J. Schmidt (2015), [https://books.google.com/books?id=BqdzCQAAQBAJ&pg=PA100 ''An Atlas and Survey of South Asian History'', page 100] {{Webarchive|url=https://web.archive.org/web/20230922034442/https://books.google.com/books?id=BqdzCQAAQBAJ&pg=PA100 |date=22 September 2023 }}, [[Routledge]]</ref> Sean Harkin estimates that China and India may have accounted for 60 to 70 percent of world GDP in the 17th century. The Mughal economy functioned on an elaborate system of [[coin]]ed currency, land revenue and trade. Gold, silver and copper coins were issued by the royal [[mint (coin)|mints]] which functioned on the basis of [[Commodity money|free coinage]].<ref>{{Harvnb|Raychaudhuri|Habib|2004|pp=360–361}}</ref> The political stability and uniform revenue policy resulting from a centralized administration under the Mughals, coupled with a well-developed internal trade network, ensured that India–before the arrival of the British–was to a large extent economically unified, despite having a traditional agrarian economy characterised by a predominance of [[subsistence agriculture]].<ref>{{Harvnb|Kumar|2005|p=3}}</ref> Agricultural production increased under Mughal [[agrarian reform]]s,<ref name="schmidt" /> with Indian agriculture being advanced compared to Europe at the time, such as the widespread use of the [[seed drill]] among Indian peasants before its adoption in European agriculture,<ref>{{cite book|author=[[Irfan Habib]]|author2=[[Dharma Kumar]]|author3=[[Tapan Raychaudhuri]]|title=The Cambridge Economic History of India|volume=1|page=214|year=1987|publisher=[[Cambridge University Press]]|url=http://www.hkrdb.kar.nic.in/documents/Downloads/Good%20Reads/The%20Cambridge%20Economic%20History%20of%20India,%20Volume%201.pdf#page=230|access-date=5 August 2017|archive-date=4 August 2017|archive-url=https://web.archive.org/web/20170804231000/http://www.hkrdb.kar.nic.in/documents/Downloads/Good%20Reads/The%20Cambridge%20Economic%20History%20of%20India,%20Volume%201.pdf#page=230|url-status=live}}</ref> and possibly higher per-capita agricultural output and standards of consumption then 17 century Europe.<ref>{{Cite book|author=Vivek Suneja|title=Understanding Business: A Multidimensional Approach to the Market Economy|page=13|publisher=[[Psychology Press]]|year=2000|url=https://books.google.com/books?id=8Stw3qadXG0C&pg=PA13|isbn=978-0-415-23857-1|access-date=26 August 2017|archive-date=22 September 2023|archive-url=https://web.archive.org/web/20230922034936/https://books.google.com/books?id=8Stw3qadXG0C&pg=PA13|url-status=live}}</ref> | ||
[[File:Muslin men.jpg|thumb|right|Mughal princes wearing muslin robes in 1665 CE]] | [[File:Muslin men.jpg|thumb|right|Mughal princes wearing muslin robes in 1665 CE]] | ||
The Mughal Empire had a thriving industrial manufacturing economy, with India producing about 25% of the world's industrial output up until 1750,<ref name="williamson">{{cite web|url=http://www.tcd.ie/Economics/staff/orourkek/Istanbul/JGWGEHNIndianDeind.pdf|title=India's Deindustrialization in the 18th and 19th Centuries|author=[[Jeffrey G. Williamson]], David Clingingsmith|publisher=[[Harvard University]]|date=August 2005|access-date=18 May 2017}}</ref> making it the most important manufacturing center in [[international trade]].<ref name=":3">{{Citation |title=Why Europe Grew Rich and Asia Did Not: Global Economic Divergence, 1600–1850 |given=Prasannan |surname=Parthasarathi |publisher=Cambridge University Press |year=2011 |isbn=978-1-139-49889-0 |page=2}}</ref> Manufactured goods and [[cash crop]]s from the Mughal Empire were sold throughout the world. Key industries included textiles, [[shipbuilding]], and steel, and processed exports included cotton textiles, [[yarn]]s, [[Thread (yarn)|thread]], silk, [[jute]] products, [[metalware]], and foods such as sugar, oils and butter.<ref name="schmidt" /> Cities and towns boomed under the Mughal Empire, which had a relatively high degree of urbanization for its time, with 15% of its population living in urban centres, higher than the percentage of the urban population in contemporary Europe at the time and higher than that of [[British India]] in the 19th century.<ref name="eraly">{{cite book |last=Eraly |first=Abraham |author-link=Abraham Eraly |year=2007 |title=The Mughal World: Life in India's Last Golden Age |url=https://books.google.com/books?id=Zpa8gyGW_twC&pg=PA5 |publisher=Penguin Books India |page=5 |isbn=978-0-14-310262-5}}</ref> | The Mughal Empire had a thriving industrial manufacturing economy, with India producing about 25% of the world's industrial output up until 1750,<ref name="williamson">{{cite web|url=http://www.tcd.ie/Economics/staff/orourkek/Istanbul/JGWGEHNIndianDeind.pdf|title=India's Deindustrialization in the 18th and 19th Centuries|author=[[Jeffrey G. Williamson]], David Clingingsmith|publisher=[[Harvard University]]|date=August 2005|access-date=18 May 2017|archive-date=13 December 2016|archive-url=https://web.archive.org/web/20161213044056/http://www.tcd.ie/Economics/staff/orourkek/Istanbul/JGWGEHNIndianDeind.pdf|url-status=live}}</ref> making it the most important manufacturing center in [[international trade]].<ref name=":3">{{Citation |title=Why Europe Grew Rich and Asia Did Not: Global Economic Divergence, 1600–1850 |given=Prasannan |surname=Parthasarathi |publisher=Cambridge University Press |year=2011 |isbn=978-1-139-49889-0 |page=2}}</ref> Manufactured goods and [[cash crop]]s from the Mughal Empire were sold throughout the world. Key industries included textiles, [[shipbuilding]], and steel, and processed exports included cotton textiles, [[yarn]]s, [[Thread (yarn)|thread]], silk, [[jute]] products, [[metalware]], and foods such as sugar, oils and butter.<ref name="schmidt" /> Cities and towns boomed under the Mughal Empire, which had a relatively high degree of urbanization for its time, with 15% of its population living in urban centres, higher than the percentage of the urban population in contemporary Europe at the time and higher than that of [[British India]] in the 19th century.<ref name="eraly">{{cite book |last=Eraly |first=Abraham |author-link=Abraham Eraly |year=2007 |title=The Mughal World: Life in India's Last Golden Age |url=https://books.google.com/books?id=Zpa8gyGW_twC&pg=PA5 |publisher=Penguin Books India |page=5 |isbn=978-0-14-310262-5}}</ref> | ||
In [[early modern Europe]], there was significant demand for products from Mughal India, particularly cotton textiles, as well as goods such as spices, peppers, [[indigo]], silks, and [[saltpeter]] (for use in [[munitions]]).<ref name="schmidt" /> [[1650–1700 in Western European fashion|European fashion]], for example, became increasingly dependent on Mughal Indian textiles and silks. From the late 17th century to the early 18th century, Mughal India accounted for 95% of [[East India Company|British imports]] from Asia, and the [[Bengal Subah]] province alone accounted for 40% of [[Dutch East India Company|Dutch imports]] from Asia.<ref name="Prakash">[[Om Prakash (historian)|Om Prakash]], "[http://link.galegroup.com/apps/doc/CX3447600139/WHIC?u=seat24826&xid=6b597320 Empire, Mughal]", ''History of World Trade Since 1450'', edited by [[John J. McCusker]], vol. 1, Macmillan Reference USA, 2006, pp. 237–240, ''World History in Context''. Retrieved 3 August 2017</ref> In contrast, there was very little demand for European goods in Mughal India, which was largely self-sufficient.<ref name="schmidt" /> Indian goods, especially those from Bengal, were also exported in large quantities to other Asian markets, such as [[Indonesia]] and Japan.<ref name="richards95">{{cite book |last=Richards |first=John F. |author-link=John F. Richards |year=1995 |title=The Mughal Empire |url=https://books.google.com/books?id=HHyVh29gy4QC&pg=PA202 |publisher=Cambridge University Press |page=202 |isbn=978-0-521-56603-2}}</ref> At the time, [[Mughal Bengal]] was the most important center of cotton textile production.<ref>Richard Maxwell Eaton (1996), [https://books.google.com/books?id=gKhChF3yAOUC&pg=PA202 ''The Rise of Islam and the Bengal Frontier, 1204–1760'', page 202], [[University of California Press]]</ref> | In [[early modern Europe]], there was significant demand for products from Mughal India, particularly cotton textiles, as well as goods such as spices, peppers, [[indigo]], silks, and [[saltpeter]] (for use in [[munitions]]).<ref name="schmidt" /> [[1650–1700 in Western European fashion|European fashion]], for example, became increasingly dependent on Mughal Indian textiles and silks. From the late 17th century to the early 18th century, Mughal India accounted for 95% of [[East India Company|British imports]] from Asia, and the [[Bengal Subah]] province alone accounted for 40% of [[Dutch East India Company|Dutch imports]] from Asia.<ref name="Prakash">[[Om Prakash (historian)|Om Prakash]], "[http://link.galegroup.com/apps/doc/CX3447600139/WHIC?u=seat24826&xid=6b597320 Empire, Mughal] {{Webarchive|url=https://web.archive.org/web/20221118051038/https://go.gale.com/ps/i.do?p=WHIC&u=seat24826&id=GALE%7B%7B%21%7D%7DCX3447600139&v=2.1&it=r&asid=6b597320 |date=18 November 2022 }}", ''History of World Trade Since 1450'', edited by [[John J. McCusker]], vol. 1, Macmillan Reference USA, 2006, pp. 237–240, ''World History in Context''. Retrieved 3 August 2017</ref> In contrast, there was very little demand for European goods in Mughal India, which was largely self-sufficient.<ref name="schmidt" /> Indian goods, especially those from Bengal, were also exported in large quantities to other Asian markets, such as [[Indonesia]] and Japan.<ref name="richards95">{{cite book |last=Richards |first=John F. |author-link=John F. Richards |year=1995 |title=The Mughal Empire |url=https://books.google.com/books?id=HHyVh29gy4QC&pg=PA202 |publisher=Cambridge University Press |page=202 |isbn=978-0-521-56603-2}}</ref> At the time, [[Mughal Bengal]] was the most important center of cotton textile production.<ref>Richard Maxwell Eaton (1996), [https://books.google.com/books?id=gKhChF3yAOUC&pg=PA202 ''The Rise of Islam and the Bengal Frontier, 1204–1760'', page 202] {{Webarchive|url=https://web.archive.org/web/20230404212612/https://books.google.com/books?id=gKhChF3yAOUC&pg=PA202 |date=4 April 2023 }}, [[University of California Press]]</ref> | ||
In the early 18th century the [[Mughal Empire]] declined, as it lost western, central and parts of south and north India to the [[Maratha Empire]], which integrated and continued to administer those regions.<ref name="kumar">{{Harvnb|Kumar|2005|pp=5–8}}</ref> The decline of the Mughal Empire led to decreased agricultural productivity, which in turn negatively affected the textile industry.<ref>{{cite book|title=Trade and Poverty: When the Third World Fell Behind|author=Jeffrey G. Williamson|publisher=[[MIT Press]]|year=2011|page=91|url=https://books.google.com/books?id=QiDslL0o-hUC&pg=PA91|author-link=Jeffrey G. Williamson|isbn=978-0-262-29518-5}}</ref> The subcontinent's dominant economic power in the post-Mughal era was the [[Bengal Subah]] in the east., which continued to maintain thriving textile industries and relatively high [[real wages]].<ref name="Parthasarathi">{{Citation |title=Why Europe Grew Rich and Asia Did Not: Global Economic Divergence, 1600–1850 |given=Prasannan |surname=Parthasarathi |publisher=Cambridge University Press |year=2011 |isbn=978-1-139-49889-0}}</ref> However, the former was devastated by the [[Maratha invasions of Bengal]]<ref name="Chaudhuri253">{{cite book|author=Kirti N. Chaudhuri|title=The Trading World of Asia and the English East India Company: 1660–1760|publisher=[[Cambridge University Press]]|year=2006|page=253|url=https://books.google.com/books?id=9xt7Fgzq9e8C&pg=PA253|author-link=Kirti N. Chaudhuri|isbn=978-0-521-03159-2}}</ref><ref name="Marshall73">{{cite book|title=Bengal: The British Bridgehead: Eastern India 1740–1828|author=P. J. Marshall|publisher=[[Cambridge University Press]]|year=2006|page=73|url=https://books.google.com/books?id=lIZrfokYSY8C&pg=PA73|author-link=P. J. Marshall|isbn=978-0-521-02822-6}}</ref> and then [[Battle of Plassey|British colonization]] in the mid-18th century.<ref name="Parthasarathi" /> After the loss at the [[Third Battle of Panipat]], the Maratha Empire disintegrated into several confederate states, and the resulting political instability and armed conflict severely affected economic life in several parts of the country – although this was mitigated by localised prosperity in the new provincial kingdoms.<ref name="kumar" /> By the late eighteenth century, the British [[East India Company]] had entered the Indian political theatre and established its dominance over other European powers. This marked a determinative shift in India's trade, and a less-powerful effect on the rest of the economy.<ref>{{Harvnb|Kumar|2005|p=26}}</ref> | In the early 18th century the [[Mughal Empire]] declined, as it lost western, central and parts of south and north India to the [[Maratha Empire]], which integrated and continued to administer those regions.<ref name="kumar">{{Harvnb|Kumar|2005|pp=5–8}}</ref> The decline of the Mughal Empire led to decreased agricultural productivity, which in turn negatively affected the textile industry.<ref>{{cite book|title=Trade and Poverty: When the Third World Fell Behind|author=Jeffrey G. Williamson|publisher=[[MIT Press]]|year=2011|page=91|url=https://books.google.com/books?id=QiDslL0o-hUC&pg=PA91|author-link=Jeffrey G. Williamson|isbn=978-0-262-29518-5|access-date=15 August 2017|archive-date=22 September 2023|archive-url=https://web.archive.org/web/20230922033919/https://books.google.com/books?id=QiDslL0o-hUC&pg=PA91|url-status=live}}</ref> The subcontinent's dominant economic power in the post-Mughal era was the [[Bengal Subah]] in the east., which continued to maintain thriving textile industries and relatively high [[real wages]].<ref name="Parthasarathi">{{Citation |title=Why Europe Grew Rich and Asia Did Not: Global Economic Divergence, 1600–1850 |given=Prasannan |surname=Parthasarathi |publisher=Cambridge University Press |year=2011 |isbn=978-1-139-49889-0}}</ref> However, the former was devastated by the [[Maratha invasions of Bengal]]<ref name="Chaudhuri253">{{cite book|author=Kirti N. Chaudhuri|title=The Trading World of Asia and the English East India Company: 1660–1760|publisher=[[Cambridge University Press]]|year=2006|page=253|url=https://books.google.com/books?id=9xt7Fgzq9e8C&pg=PA253|author-link=Kirti N. Chaudhuri|isbn=978-0-521-03159-2}}</ref><ref name="Marshall73">{{cite book|title=Bengal: The British Bridgehead: Eastern India 1740–1828|author=P. J. Marshall|publisher=[[Cambridge University Press]]|year=2006|page=73|url=https://books.google.com/books?id=lIZrfokYSY8C&pg=PA73|author-link=P. J. Marshall|isbn=978-0-521-02822-6}}</ref> and then [[Battle of Plassey|British colonization]] in the mid-18th century.<ref name="Parthasarathi" /> After the loss at the [[Third Battle of Panipat]], the Maratha Empire disintegrated into several confederate states, and the resulting political instability and armed conflict severely affected economic life in several parts of the country – although this was mitigated by localised prosperity in the new provincial kingdoms.<ref name="kumar" /> By the late eighteenth century, the British [[East India Company]] had entered the Indian political theatre and established its dominance over other European powers. This marked a determinative shift in India's trade, and a less-powerful effect on the rest of the economy.<ref>{{Harvnb|Kumar|2005|p=26}}</ref> | ||
=== British era (1793–1947) === | === British era (1793–1947) === | ||
| Line 202: | Line 199: | ||
{{Blockquote| There is no doubt that our grievances against the British Empire had a sound basis. As the painstaking statistical work of the Cambridge historian Angus Maddison has shown, India's share of world income collapsed from 22.6% in 1700, almost equal to Europe's share of 23.3% at that time, to as low as 3.8% in 1952. Indeed, at the beginning of the 20th century, "the brightest jewel in the British Crown" was the poorest country in the world in terms of per capita income.|[[Manmohan Singh]]<ref name="Hindu">{{cite news|title=Of Oxford, economics, empire, and freedom|url=http://www.hindu.com/2005/07/10/stories/2005071002301000.htm|archive-url=https://web.archive.org/web/20051027013702/http://www.hindu.com/2005/07/10/stories/2005071002301000.htm|url-status=dead|archive-date=27 October 2005|location=Chennai|date=2 October 2005|newspaper=[[The Hindu]]|access-date=6 December 2010}}</ref>}} | {{Blockquote| There is no doubt that our grievances against the British Empire had a sound basis. As the painstaking statistical work of the Cambridge historian Angus Maddison has shown, India's share of world income collapsed from 22.6% in 1700, almost equal to Europe's share of 23.3% at that time, to as low as 3.8% in 1952. Indeed, at the beginning of the 20th century, "the brightest jewel in the British Crown" was the poorest country in the world in terms of per capita income.|[[Manmohan Singh]]<ref name="Hindu">{{cite news|title=Of Oxford, economics, empire, and freedom|url=http://www.hindu.com/2005/07/10/stories/2005071002301000.htm|archive-url=https://web.archive.org/web/20051027013702/http://www.hindu.com/2005/07/10/stories/2005071002301000.htm|url-status=dead|archive-date=27 October 2005|location=Chennai|date=2 October 2005|newspaper=[[The Hindu]]|access-date=6 December 2010}}</ref>}} | ||
[[File:1 AD to 2003 AD Historical Trends in global distribution of GDP China India Western Europe USA Middle East.png|thumb|300px|The global contribution to world's GDP by major economies from 1 CE to 2003 CE according to Angus Maddison's estimates.<ref name="Maddison379">{{cite book |last=Maddison |first=Angus |date=2007 |title=Contours of the World Economy 1–2030 AD: Essays in Macro-Economic History |url=https://books.google.com/books?id=a-JGGp2suQUC&q=angus+maddison |publisher=[[Oxford University Press]] |page=379 |isbn=978-0-19-164758-1 |author-link=Angus Maddison}}</ref> Up until the 18th century, China and India were the two largest economies by GDP output.]] | [[File:1 AD to 2003 AD Historical Trends in global distribution of GDP China India Western Europe USA Middle East.png|thumb|300px|The global contribution to world's GDP by major economies from 1 CE to 2003 CE according to Angus Maddison's estimates.<ref name="Maddison379">{{cite book |last=Maddison |first=Angus |date=2007 |title=Contours of the World Economy 1–2030 AD: Essays in Macro-Economic History |url=https://books.google.com/books?id=a-JGGp2suQUC&q=angus+maddison |publisher=[[Oxford University Press]] |page=379 |isbn=978-0-19-164758-1 |author-link=Angus Maddison |access-date=10 November 2020 |archive-date=9 November 2023 |archive-url=https://web.archive.org/web/20231109223015/https://books.google.com/books?id=a-JGGp2suQUC&q=angus+maddison#v=snippet&q=angus%20maddison&f=false |url-status=live }}</ref> Up until the 18th century, China and India were the two largest economies by GDP output.]] | ||
From the beginning of the 19th century, the British [[East India Company]]'s gradual expansion and consolidation of power brought a major change in taxation and agricultural policies, which tended to promote commercialisation of agriculture with a focus on trade, resulting in decreased production of food crops, mass impoverishment and destitution of farmers, and in the short term, led to [[Famine in India|numerous famines]].<ref>{{Harvnb|Roy|2006|pp=158–160}}</ref> The economic policies of the [[British Raj]] caused a severe decline in the [[handicrafts]] and [[handloom]] sectors, due to reduced demand and dipping employment.<ref>{{Harvnb|Kumar|2005|pp=538–540}}</ref> After the removal of international restrictions by the [[East India Company#Charter Act 1813|Charter of 1813]], Indian trade expanded substantially with steady growth.<ref>{{Harvnb|Kumar|2005|pp=826–827}}</ref> The result was a significant transfer of capital from India to England, which, due to the colonial policies of the British, led to a massive drain of revenue rather than any systematic effort at modernisation of the domestic economy.<ref>{{Harvnb|Kumar|2005|pp=876–877}}</ref> | From the beginning of the 19th century, the British [[East India Company]]'s gradual expansion and consolidation of power brought a major change in taxation and agricultural policies, which tended to promote commercialisation of agriculture with a focus on trade, resulting in decreased production of food crops, mass impoverishment and destitution of farmers, and in the short term, led to [[Famine in India|numerous famines]].<ref>{{Harvnb|Roy|2006|pp=158–160}}</ref> The economic policies of the [[British Raj]] caused a severe decline in the [[handicrafts]] and [[handloom]] sectors, due to reduced demand and dipping employment.<ref>{{Harvnb|Kumar|2005|pp=538–540}}</ref> After the removal of international restrictions by the [[East India Company#Charter Act 1813|Charter of 1813]], Indian trade expanded substantially with steady growth.<ref>{{Harvnb|Kumar|2005|pp=826–827}}</ref> The result was a significant transfer of capital from India to England, which, due to the colonial policies of the British, led to a massive drain of revenue rather than any systematic effort at modernisation of the domestic economy.<ref>{{Harvnb|Kumar|2005|pp=876–877}}</ref> | ||
[[File:1700 AD through 1950 AD per capita GDP of United Kingdom and India during the Colonial Era.png|thumb|left | [[File:1700 AD through 1950 AD per capita GDP of United Kingdom and India during the Colonial Era.png|thumb|left|Estimated GDP per capita of India and United Kingdom during 1700–1950 in 1990 US$ according to [[Angus Maddison|Maddison]].<ref>Maddison A (2007), Contours of the World Economy I-2030AD, Oxford University Press, {{ISBN|978-0199227204}}. The data tables from this book are available online here [http://www.ggdc.net/maddison/oriindex.htm] {{Webarchive|url=https://web.archive.org/web/20190216033959/http://www.ggdc.net/MADDISON/oriindex.htm |date=16 February 2019 }}</ref> However, Maddison's estimates for 18th-century India have been criticized as gross underestimates,<ref>{{cite book|title=Reorienting the 19th Century: Global Economy in the Continuing Asian Age|author=[[Andre Gunder Frank]], Robert A. Denemark|publisher=[[Routledge]]|year=2015|pages=83–85|url=https://books.google.com/books?id=8NXOCgAAQBAJ&pg=PA83|isbn=978-1-317-25293-1}}</ref> [[Paul Bairoch|Bairoch]] estimates India had a higher GDP per capita in the 18th century,<ref>{{cite book|title=Economics and World History: Myths and Paradoxes|author=Paul Bairoch|publisher=[[University of Chicago Press]]|year=1995|pages=95–104|url=https://www.scribd.com/document/193124153/Economics-and-World-History-Myths-and-Paradoxes-Paul-Bairoch|author-link=Paul Bairoch|access-date=9 August 2017|archive-date=12 October 2017|archive-url=https://web.archive.org/web/20171012060209/https://www.scribd.com/document/193124153/Economics-and-World-History-Myths-and-Paradoxes-Paul-Bairoch|url-status=dead}}</ref><ref>Chris Jochnick, Fraser A. Preston (2006), [https://books.google.com/books?id=SpqmITSjgWAC&pg=PA86 ''Sovereign Debt at the Crossroads: Challenges and Proposals for Resolving the Third World Debt Crisis'', pages 86–87] {{Webarchive|url=https://web.archive.org/web/20231109222929/https://books.google.com/books?id=SpqmITSjgWAC&pg=PA86#v=onepage&q&f=false |date=9 November 2023 }}, [[Oxford University Press]]</ref> and Parthasarathi's findings show higher [[real wages]] in 18th-century [[Bengal Subah|Bengal]] and [[Kingdom of Mysore|Mysore]].<ref name="Parthasarathi38">{{Citation|title=Why Europe Grew Rich and Asia Did Not: Global Economic Divergence, 1600–1850|url=https://books.google.com/books?id=1_YEcvo-jqcC&pg=PA38|pages=38–45|year=2011|publisher=Cambridge University Press|isbn=978-1-139-49889-0|given=Prasannan|surname=Parthasarathi|access-date=26 August 2017|archive-date=4 April 2023|archive-url=https://web.archive.org/web/20230404212704/https://books.google.com/books?id=1_YEcvo-jqcC&pg=PA38|url-status=live}}</ref><ref name="williamson" /> But there is consensus that India's per capita GDP and income stagnated during the colonial era, starting in the late 18th century.<ref name="Kumar-3">{{Harvnb|Kumar|2005|page=422}}</ref>]] | ||
Under British rule, India's share of the world economy declined from 24.4% in 1700 down to 4.2% in 1950. India's GDP (PPP) per capita was stagnant during the [[Mughal Empire]] and began to decline prior to the onset of British rule.<ref name="maddison261">[[Angus Maddison|Maddison, Angus]] (2003): ''[https://books.google.com/books?id=rHJGz3HiJbcC&pg=PA261 Development Centre Studies The World Economy Historical Statistics: Historical Statistics]'', [[OECD Publishing]], {{ISBN|9264104143}}, page 261</ref> India's share of global industrial output declined from 25% in 1750 down to 2% in 1900.<ref name="williamson" /> At the same time, United Kingdom's share of the world economy rose from 2.9% in 1700 up to 9% in 1870. The British East India Company, following their [[Battle of Plassey|conquest of Bengal]] in 1757, had forced open the large Indian market to British goods, which could be sold in India without [[tariff]]s or [[Duty (economics)|duties]], compared to local Indian producers who were heavily taxed, while in Britain [[protectionist]] policies such as bans and high tariffs were implemented to restrict Indian textiles from being sold there, whereas raw cotton was imported from India without tariffs to British factories which manufactured textiles from Indian cotton and sold them back to the Indian market. British economic policies gave them a monopoly over India's large market and cotton resources.<ref>{{cite book|title=The Process of Economic Development|author=James Cypher|year=2014|publisher=[[Routledge]]|url=https://books.google.com/books?id=TxFxAwAAQBAJ&pg=PA97|isbn=978-1-136-16828-4}}</ref><ref name="gupta">{{cite web|last1=Broadberry|first1=Stephen|last2=Gupta|first2=Bishnupriya|title=Cotton textiles and the great divergence: Lancashire, India and shifting competitive advantage, 1600–1850|year=2005|url=http://www.iisg.nl/hpw/papers/broadberry-gupta.pdf|website=International Institute of Social History|publisher=Department of Economics, University of Warwick|access-date=5 December 2016}}</ref><ref>{{cite book|title=Economics and World History: Myths and Paradoxes|author=Paul Bairoch|publisher=[[University of Chicago Press]]|year=1995|page=89|url=https://www.scribd.com/document/193124153/Economics-and-World-History-Myths-and-Paradoxes-Paul-Bairoch|author-link=Paul Bairoch|access-date=9 August 2017|archive-date=12 October 2017|archive-url=https://web.archive.org/web/20171012060209/https://www.scribd.com/document/193124153/Economics-and-World-History-Myths-and-Paradoxes-Paul-Bairoch|url-status=dead}}</ref> India served as both a significant supplier of raw goods to British manufacturers and a large [[captive market]] for British manufactured goods.<ref>{{cite book|title=Hobson-Jobson: The Definitive Glossary of British India|author=[[Henry Yule]], [[A. C. Burnell]]|publisher=[[Oxford University Press]]|year=2013|page=20|url=https://books.google.com/books?id=8NXOCgAAQBAJ&pg=PA20|isbn=978-1-317-25293-1}}</ref> | Under British rule, India's share of the world economy declined from 24.4% in 1700 down to 4.2% in 1950. India's GDP (PPP) per capita was stagnant during the [[Mughal Empire]] and began to decline prior to the onset of British rule.<ref name="maddison261">[[Angus Maddison|Maddison, Angus]] (2003): ''[https://books.google.com/books?id=rHJGz3HiJbcC&pg=PA261 Development Centre Studies The World Economy Historical Statistics: Historical Statistics]'', [[OECD Publishing]], {{ISBN|9264104143}}, page 261</ref> India's share of global industrial output declined from 25% in 1750 down to 2% in 1900.<ref name="williamson" /> At the same time, United Kingdom's share of the world economy rose from 2.9% in 1700 up to 9% in 1870. The British East India Company, following their [[Battle of Plassey|conquest of Bengal]] in 1757, had forced open the large Indian market to British goods, which could be sold in India without [[tariff]]s or [[Duty (economics)|duties]], compared to local Indian producers who were heavily taxed, while in Britain [[protectionist]] policies such as bans and high tariffs were implemented to restrict Indian textiles from being sold there, whereas raw cotton was imported from India without tariffs to British factories which manufactured textiles from Indian cotton and sold them back to the Indian market. British economic policies gave them a monopoly over India's large market and cotton resources.<ref>{{cite book|title=The Process of Economic Development|author=James Cypher|year=2014|publisher=[[Routledge]]|url=https://books.google.com/books?id=TxFxAwAAQBAJ&pg=PA97|isbn=978-1-136-16828-4|access-date=26 August 2017|archive-date=9 November 2023|archive-url=https://web.archive.org/web/20231109223836/https://books.google.com/books?id=TxFxAwAAQBAJ&pg=PA97#v=onepage&q&f=false|url-status=live}}</ref><ref name="gupta">{{cite web|last1=Broadberry|first1=Stephen|last2=Gupta|first2=Bishnupriya|title=Cotton textiles and the great divergence: Lancashire, India and shifting competitive advantage, 1600–1850|year=2005|url=http://www.iisg.nl/hpw/papers/broadberry-gupta.pdf|website=International Institute of Social History|publisher=Department of Economics, University of Warwick|access-date=5 December 2016|archive-date=10 September 2016|archive-url=https://web.archive.org/web/20160910075425/http://www.iisg.nl/hpw/papers/broadberry-gupta.pdf|url-status=live}}</ref><ref>{{cite book|title=Economics and World History: Myths and Paradoxes|author=Paul Bairoch|publisher=[[University of Chicago Press]]|year=1995|page=89|url=https://www.scribd.com/document/193124153/Economics-and-World-History-Myths-and-Paradoxes-Paul-Bairoch|author-link=Paul Bairoch|access-date=9 August 2017|archive-date=12 October 2017|archive-url=https://web.archive.org/web/20171012060209/https://www.scribd.com/document/193124153/Economics-and-World-History-Myths-and-Paradoxes-Paul-Bairoch|url-status=dead}}</ref> India served as both a significant supplier of raw goods to British manufacturers and a large [[captive market]] for British manufactured goods.<ref>{{cite book|title=Hobson-Jobson: The Definitive Glossary of British India|author=[[Henry Yule]], [[A. C. Burnell]]|publisher=[[Oxford University Press]]|year=2013|page=20|url=https://books.google.com/books?id=8NXOCgAAQBAJ&pg=PA20|isbn=978-1-317-25293-1}}</ref> | ||
British territorial expansion in India throughout the 19th century created an institutional environment that, on paper, guaranteed [[property rights]] among the colonisers, encouraged [[free trade]], and created a single currency with [[fixed exchange rates]], standardised weights and measures and [[capital market]]s within the company-held territories. It also established a system of [[Rail transport in India|railways]] and telegraphs, a civil service that aimed to be free from political interference, a common-law, and an adversarial legal system.<ref>{{Harvnb|Roy|2006|pp=291–292}}</ref> This coincided with major changes in the world economy – industrialisation, and significant growth in production and trade. However, at the end of colonial rule, India inherited an economy that was one of the poorest in the developing world,<ref name="roy-2">{{Harvnb|Roy|2006|p = 1}}</ref> with industrial development stalled, agriculture unable to feed a rapidly growing population, a largely illiterate and unskilled labour force, and extremely inadequate infrastructure.<ref name="AtIndependence">{{Harvnb|Datt|Sundharam|2009|p=179}}</ref> | British territorial expansion in India throughout the 19th century created an institutional environment that, on paper, guaranteed [[property rights]] among the colonisers, encouraged [[free trade]], and created a single currency with [[fixed exchange rates]], standardised weights and measures and [[capital market]]s within the company-held territories. It also established a system of [[Rail transport in India|railways]] and telegraphs, a civil service that aimed to be free from political interference, a common-law, and an adversarial legal system.<ref>{{Harvnb|Roy|2006|pp=291–292}}</ref> This coincided with major changes in the world economy – industrialisation, and significant growth in production and trade. However, at the end of colonial rule, India inherited an economy that was one of the poorest in the developing world,<ref name="roy-2">{{Harvnb|Roy|2006|p = 1}}</ref> with industrial development stalled, agriculture unable to feed a rapidly growing population, a largely illiterate and unskilled labour force, and extremely inadequate infrastructure.<ref name="AtIndependence">{{Harvnb|Datt|Sundharam|2009|p=179}}</ref> | ||
The 1872 census revealed that 91.3% of the population of the region constituting present-day India resided in villages.<ref name="non-urban">{{Harvnb|Kumar|2005|p=519}}</ref> This was a decline from the earlier Mughal era, when 85% of the population resided in villages and 15% in urban centers under [[Akbar]]'s reign in 1600.<ref>{{cite book |author=[[Irfan Habib]] |author2=[[Dharma Kumar]] |author3=[[Tapan Raychaudhuri]]|title=The Cambridge Economic History of India|volume=1|page=165|year=1987|publisher=[[Cambridge University Press]]|url=http://www.hkrdb.kar.nic.in/documents/Downloads/Good%20Reads/The%20Cambridge%20Economic%20History%20of%20India,%20Volume%201.pdf#page=185}}</ref> Urbanisation generally remained sluggish in British India until the 1920s, due to the lack of industrialisation and absence of adequate transportation. Subsequently, the policy of discriminating protection (where certain important industries were given financial protection by the state), coupled with the Second World War, saw the development and dispersal of industries, encouraging rural-urban migration, and in particular, the large port cities of [[Bombay]], [[Calcutta]] and [[Madras]] grew rapidly. Despite this, only one-sixth of India's population lived in cities by 1951.<ref>{{Harvnb|Kumar|2005|pp=520–521}}</ref> | The 1872 census revealed that 91.3% of the population of the region constituting present-day India resided in villages.<ref name="non-urban">{{Harvnb|Kumar|2005|p=519}}</ref> This was a decline from the earlier Mughal era, when 85% of the population resided in villages and 15% in urban centers under [[Akbar]]'s reign in 1600.<ref>{{cite book|author=[[Irfan Habib]]|author2=[[Dharma Kumar]]|author3=[[Tapan Raychaudhuri]]|title=The Cambridge Economic History of India|volume=1|page=165|year=1987|publisher=[[Cambridge University Press]]|url=http://www.hkrdb.kar.nic.in/documents/Downloads/Good%20Reads/The%20Cambridge%20Economic%20History%20of%20India,%20Volume%201.pdf#page=185|access-date=5 August 2017|archive-date=4 August 2017|archive-url=https://web.archive.org/web/20170804231000/http://www.hkrdb.kar.nic.in/documents/Downloads/Good%20Reads/The%20Cambridge%20Economic%20History%20of%20India,%20Volume%201.pdf#page=185|url-status=live}}</ref> Urbanisation generally remained sluggish in British India until the 1920s, due to the lack of industrialisation and absence of adequate transportation. Subsequently, the policy of discriminating protection (where certain important industries were given financial protection by the state), coupled with the Second World War, saw the development and dispersal of industries, encouraging rural-urban migration, and in particular, the large port cities of [[Bombay]], [[Calcutta]] and [[Madras]] grew rapidly. Despite this, only one-sixth of India's population lived in cities by 1951.<ref>{{Harvnb|Kumar|2005|pp=520–521}}</ref> | ||
The effect of British rule on India's economy is a controversial topic. Leaders of the [[Indian independence movement]] and [[economic history|economic historians]] have blamed colonial rule for India's poor economic performance following independence and argued that the wealth required for Britain's industrial development was derived from wealth taken from India. At the same time, right-wing historians have countered that India's poor economic performance was due to various sectors being in a state of growth and decline due to changes brought in by colonialism and a world that was moving towards industrialisation and [[economic integration]].<ref name="roy-1">{{Harvnb|Roy|2006|pp= 22–24}}</ref> | The effect of British rule on India's economy is a controversial topic. Leaders of the [[Indian independence movement]] and [[economic history|economic historians]] have blamed colonial rule for India's poor economic performance following independence and argued that the wealth required for Britain's industrial development was derived from wealth taken from India. At the same time, right-wing historians have countered that India's poor economic performance was due to various sectors being in a state of growth and decline due to changes brought in by colonialism and a world that was moving towards industrialisation and [[economic integration]].<ref name="roy-1">{{Harvnb|Roy|2006|pp= 22–24}}</ref> | ||
| Line 222: | Line 219: | ||
Indian [[economic policy]] after independence was influenced by the colonial experience, which was seen as exploitative by Indian leaders exposed to the planned [[economy of the Soviet Union]].<ref name="AtIndependence" /> Domestic policy tended towards protectionism, with a strong emphasis on [[import substitution industrialisation]], [[economic interventionism]], a large government-run [[public sector]], [[Regulation (socio-legal concept)|business regulation]], and [[central planning]],<ref>{{Harvnb|Panagariya|2008|pp=31–32}}</ref> while trade and foreign investment policies were relatively liberal.<ref>{{Harvnb|Panagariya|2008|p=24}}</ref> [[Five-Year Plans of India]] resembled central planning in the [[Soviet Union]]. Steel, mining, machine tools, telecommunications, insurance, and power plants, among other industries, were effectively nationalised in the mid-1950s.<ref name="staley">{{cite magazine|url=http://www.reason.com/news/show/36682.html|title=The Rise and Fall of Indian Socialism: Why India embraced economic reform|first=Sam|last=Staley|magazine=[[Reason (magazine)|Reason]]|year=2006|access-date=17 January 2011|archive-url=https://web.archive.org/web/20090114053740/http://reason.com/news/show/36682.html|archive-date=14 January 2009|url-status=dead}}</ref> The Indian economy of this period is characterised as [[Dirigisme|Dirigism]].<ref name=":1" /><ref name=":2" /> | Indian [[economic policy]] after independence was influenced by the colonial experience, which was seen as exploitative by Indian leaders exposed to the planned [[economy of the Soviet Union]].<ref name="AtIndependence" /> Domestic policy tended towards protectionism, with a strong emphasis on [[import substitution industrialisation]], [[economic interventionism]], a large government-run [[public sector]], [[Regulation (socio-legal concept)|business regulation]], and [[central planning]],<ref>{{Harvnb|Panagariya|2008|pp=31–32}}</ref> while trade and foreign investment policies were relatively liberal.<ref>{{Harvnb|Panagariya|2008|p=24}}</ref> [[Five-Year Plans of India]] resembled central planning in the [[Soviet Union]]. Steel, mining, machine tools, telecommunications, insurance, and power plants, among other industries, were effectively nationalised in the mid-1950s.<ref name="staley">{{cite magazine|url=http://www.reason.com/news/show/36682.html|title=The Rise and Fall of Indian Socialism: Why India embraced economic reform|first=Sam|last=Staley|magazine=[[Reason (magazine)|Reason]]|year=2006|access-date=17 January 2011|archive-url=https://web.archive.org/web/20090114053740/http://reason.com/news/show/36682.html|archive-date=14 January 2009|url-status=dead}}</ref> The Indian economy of this period is characterised as [[Dirigisme|Dirigism]].<ref name=":1" /><ref name=":2" /> | ||
[[File:GDP per capita of India (1820 to present).png|thumb|350px|Change in per capita GDP of India, 1820–2015. Figures are inflation-adjusted to 1990 International Geary-Khamis dollars.<ref>Data Source: Tables of Prof. Angus Maddison (2010). The per capita GDP over various years and population data can be downloaded in a spreadsheet from here [http://www.ggdc.net/maddison/oriindex.htm].</ref><ref>The 2015 estimate is retrieved from the [[International Monetary Fund]].</ref>]] | [[File:GDP per capita of India (1820 to present).png|thumb|350px|Change in per capita GDP of India, 1820–2015. Figures are inflation-adjusted to 1990 International Geary-Khamis dollars.<ref>Data Source: Tables of Prof. Angus Maddison (2010). The per capita GDP over various years and population data can be downloaded in a spreadsheet from here [http://www.ggdc.net/maddison/oriindex.htm] {{Webarchive|url=https://web.archive.org/web/20190216033959/http://www.ggdc.net/MADDISON/oriindex.htm |date=16 February 2019 }}.</ref><ref>The 2015 estimate is retrieved from the [[International Monetary Fund]].</ref>]] | ||
{{Blockquote|Never talk to me about profit, Jeh, it is a dirty word.|Nehru, India's Fabian Socialism-inspired first prime minister to industrialist [[J. R. D. Tata]], when Tata suggested state-owned companies should be profitable<ref name=gdas2002>{{cite book|title=India Unbound|first=Gurcharan|last=Das|publisher=Anchor Books|year=2002|isbn=978-0-385-72074-8|pages=167–174}}</ref>}} | {{Blockquote|Never talk to me about profit, Jeh, it is a dirty word.|Nehru, India's Fabian Socialism-inspired first prime minister to industrialist [[J. R. D. Tata]], when Tata suggested state-owned companies should be profitable<ref name=gdas2002>{{cite book|title=India Unbound|first=Gurcharan|last=Das|publisher=Anchor Books|year=2002|isbn=978-0-385-72074-8|pages=167–174}}</ref>}} | ||
[[Jawaharlal Nehru]], the first [[prime minister of India]], along with the statistician [[Prasanta Chandra Mahalanobis]], formulated and oversaw economic policy during the initial years of the country's independence. They expected favourable outcomes from their strategy, involving the rapid development of [[heavy industry]] by both public and [[private sector]]s, and based on direct and indirect state intervention, rather than the more extreme [[Economy of the Soviet Union|Soviet-style]] central command system.<ref>{{Harvnb|Datt|Sundharam|2009|pp=185–187}}</ref><ref name="Cameron-1">{{Cite journal|author1=Cameron, John|author2=Ndhlovu, P Tidings|title=Cultural Influences on Economic Thought in India: Resistance to diffusion of neo-classical economics and the principles of Hinduism|journal=Economic Issues|volume=6|issue=2|date=September 2001|url=http://www.economicissues.org/archive/pdfs/5v6p2.PDF|archive-url=https://web.archive.org/web/20060823161225/http://www.economicissues.org/archive/pdfs/5v6p2.PDF|archive-date=23 August 2006|access-date=17 January 2011}}</ref> The policy of concentrating simultaneously on capital- and technology-intensive heavy industry and subsidising manual, low-skill [[cottage industries]] was criticised by economist [[Milton Friedman]], who thought it would waste capital and labour, and retard the development of small manufacturers.<ref name="milton-1">{{cite web|title=Milton Friedman on the Nehru/Mahalanobis Plan|url=http://www.indiapolicy.org/debate/Notes/fried_opinion.html|publisher=India Policy Institute|date=22 September 1998|first=Subroto|last=Roy| access-date = 16 July 2005}}</ref> | [[Jawaharlal Nehru]], the first [[prime minister of India]], along with the statistician [[Prasanta Chandra Mahalanobis]], formulated and oversaw economic policy during the initial years of the country's independence. They expected favourable outcomes from their strategy, involving the rapid development of [[heavy industry]] by both public and [[private sector]]s, and based on direct and indirect state intervention, rather than the more extreme [[Economy of the Soviet Union|Soviet-style]] central command system.<ref>{{Harvnb|Datt|Sundharam|2009|pp=185–187}}</ref><ref name="Cameron-1">{{Cite journal|author1=Cameron, John|author2=Ndhlovu, P Tidings|title=Cultural Influences on Economic Thought in India: Resistance to diffusion of neo-classical economics and the principles of Hinduism|journal=Economic Issues|volume=6|issue=2|date=September 2001|url=http://www.economicissues.org/archive/pdfs/5v6p2.PDF|archive-url=https://web.archive.org/web/20060823161225/http://www.economicissues.org/archive/pdfs/5v6p2.PDF|archive-date=23 August 2006|access-date=17 January 2011}}</ref> The policy of concentrating simultaneously on capital- and technology-intensive heavy industry and subsidising manual, low-skill [[cottage industries]] was criticised by economist [[Milton Friedman]], who thought it would waste capital and labour, and retard the development of small manufacturers.<ref name="milton-1">{{cite web|title=Milton Friedman on the Nehru/Mahalanobis Plan|url=http://www.indiapolicy.org/debate/Notes/fried_opinion.html|publisher=India Policy Institute|date=22 September 1998|first=Subroto|last=Roy|access-date=16 July 2005|archive-date=31 March 2016|archive-url=https://web.archive.org/web/20160331032602/http://indiapolicy.org/debate/Notes/fried_opinion.html|url-status=live}}</ref> | ||
{{Blockquote | I cannot decide how much to borrow, what shares to issue, at what price, what wages and bonus to pay, and what dividend to give. I even need the government's permission for the salary I pay to a senior executive.| [[J. R. D. Tata]], on the Indian regulatory system, 1969<ref name=gdas2002 />}} | {{Blockquote | I cannot decide how much to borrow, what shares to issue, at what price, what wages and bonus to pay, and what dividend to give. I even need the government's permission for the salary I pay to a senior executive.| [[J. R. D. Tata]], on the Indian regulatory system, 1969<ref name=gdas2002 />}} | ||
| Line 248: | Line 245: | ||
The collapse of the [[Soviet Union]], which was India's major trading partner, and the [[Gulf War]], which caused a spike in oil prices, resulted in a major balance-of-payments crisis for India, which found itself facing the prospect of defaulting on its loans.<ref name="Ghosh">{{cite web|last=Ghosh |first=Arunabha |title=India's pathway through economic crisis(which makes failer of mixed economy) |work=GEG Working Paper 2004/06 |publisher=Global Economic Governance Programme |date=1 June 2004 |url=http://www.globaleconomicgovernance.org/wp-content/uploads/Ghosh%20-%20India.pdf |access-date=12 December 2009 |url-status=dead |archive-url=https://web.archive.org/web/20111112080531/http://www.globaleconomicgovernance.org/wp-content/uploads/Ghosh%20-%20India.pdf |archive-date=12 November 2011 }}</ref> India asked for a $1.8 billion bailout loan from the [[International Monetary Fund]] (IMF), which in return demanded de-regulation.{{sfn|Task Force Report|2006|p=7}} | The collapse of the [[Soviet Union]], which was India's major trading partner, and the [[Gulf War]], which caused a spike in oil prices, resulted in a major balance-of-payments crisis for India, which found itself facing the prospect of defaulting on its loans.<ref name="Ghosh">{{cite web|last=Ghosh |first=Arunabha |title=India's pathway through economic crisis(which makes failer of mixed economy) |work=GEG Working Paper 2004/06 |publisher=Global Economic Governance Programme |date=1 June 2004 |url=http://www.globaleconomicgovernance.org/wp-content/uploads/Ghosh%20-%20India.pdf |access-date=12 December 2009 |url-status=dead |archive-url=https://web.archive.org/web/20111112080531/http://www.globaleconomicgovernance.org/wp-content/uploads/Ghosh%20-%20India.pdf |archive-date=12 November 2011 }}</ref> India asked for a $1.8 billion bailout loan from the [[International Monetary Fund]] (IMF), which in return demanded de-regulation.{{sfn|Task Force Report|2006|p=7}} | ||
In response, the [[P. V. Narasimha Rao|Narasimha Rao]] government, including Finance Minister [[Manmohan Singh]], initiated [[Economic liberalisation in India|economic reforms]] in 1991. The reforms did away with the [[Licence Raj]], reduced tariffs and interest rates and ended many public monopolies, allowing automatic approval of [[foreign direct investment]] in many sectors.{{sfn|Task Force Report|2006|pp=7–8}} Since then, the overall thrust of liberalisation has remained the same, although no government has tried to take on powerful lobbies such as trade unions and farmers, on contentious issues such as reforming labour laws and reducing [[agricultural subsidy|agricultural subsidies]].<ref name="Gandhi-1">{{cite news|title=That old Gandhi magic|date= 27 November 1997|newspaper=The Economist|url=http://www.economist.com/world/asia/displaystory.cfm?story_id=107076|access-date=17 January 2011}}</ref> This has been accompanied by increases in life expectancy, literacy rates, and food security, although urban residents have benefited more than rural residents.{{sfn|Task Force Report|2006|pp=17–20}} | In response, the [[P. V. Narasimha Rao|Narasimha Rao]] government, including Finance Minister [[Manmohan Singh]], initiated [[Economic liberalisation in India|economic reforms]] in 1991. The reforms did away with the [[Licence Raj]], reduced tariffs and interest rates and ended many public monopolies, allowing automatic approval of [[foreign direct investment]] in many sectors.{{sfn|Task Force Report|2006|pp=7–8}} Since then, the overall thrust of liberalisation has remained the same, although no government has tried to take on powerful lobbies such as trade unions and farmers, on contentious issues such as reforming labour laws and reducing [[agricultural subsidy|agricultural subsidies]].<ref name="Gandhi-1">{{cite news|title=That old Gandhi magic|date=27 November 1997|newspaper=The Economist|url=http://www.economist.com/world/asia/displaystory.cfm?story_id=107076|access-date=17 January 2011|archive-date=6 May 2009|archive-url=https://web.archive.org/web/20090506203934/http://www.economist.com/world/asia/displaystory.cfm?story_id=107076|url-status=live}}</ref> This has been accompanied by increases in life expectancy, literacy rates, and food security, although urban residents have benefited more than rural residents.{{sfn|Task Force Report|2006|pp=17–20}} | ||
[[File:India GDP without labels.PNG|thumb|upright=1.5|right|GDP grows exponentially, almost doubling every five years.]] | [[File:India GDP without labels.PNG|thumb|upright=1.5|right|GDP grows exponentially, almost doubling every five years.]] | ||
[[File:India Annual GDP Growth Rate - World Bank.png|thumb|upright=1.5|Indian GDP growth rate from 1985 to 2016 in red, compared to that of China in green]] | [[File:India Annual GDP Growth Rate - World Bank.png|thumb|upright=1.5|Indian GDP growth rate from 1985 to 2016 in red, compared to that of China in green]] | ||
From 2010, India has risen from ninth-largest to the fifth-largest economies in the world by nominal GDP in 2019 by surpassing UK, [[France]], [[Italy]] and [[Brazil]].<ref>{{cite web|title=Where does India stand in the list of world's largest economies?|website=[[Times Now]]|date=2 April 2020 |url=https://www.timesnownews.com/business-economy/economy/article/where-does-india-stand-in-the-list-of-world-s-largest-economies/573015|access-date=17 June 2022}}</ref> | From 2010, India has risen from ninth-largest to the fifth-largest economies in the world by nominal GDP in 2019 by surpassing UK, [[France]], [[Italy]] and [[Brazil]].<ref>{{cite web|title=Where does India stand in the list of world's largest economies?|website=[[Times Now]]|date=2 April 2020|url=https://www.timesnownews.com/business-economy/economy/article/where-does-india-stand-in-the-list-of-world-s-largest-economies/573015|access-date=17 June 2022|archive-date=17 June 2022|archive-url=https://web.archive.org/web/20220617052035/https://www.timesnownews.com/business-economy/economy/article/where-does-india-stand-in-the-list-of-world-s-largest-economies/573015|url-status=live}}</ref> | ||
India started recovery in 2013–14 when the GDP growth rate accelerated to 6.4% from the previous year's 5.5%. The acceleration continued through 2014–15 and 2015–16 with growth rates of 7.5% and 8.0% respectively. For the first time since 1990, India grew faster than China which registered 6.9% growth in 2015.{{update inline|date=June 2017}} However the growth rate subsequently decelerated, to 7.1% and 6.6% in 2016–17 and 2017–18 respectively,<ref>{{cite web|title=PRESS NOTE ON SECOND ADVANCE ESTIMATES OF NATIONAL INCOME 2017–18|url=http://mospi.nic.in/sites/default/files/press_release/nad_pr_2eni_28feb18_0.pdf|website=Ministry of Statistics and Programme Implementation|access-date=26 May 2018|ref=Mospi2018}}</ref> partly because of the disruptive effects of [[2016 Indian banknote demonetisation]] and the [[Goods and Services Tax (India)]].<ref>{{cite news|title=Demonetisation, GST impact: IMF lowers India's 2017 growth forecast to 6.7%|url=https://www.hindustantimes.com/business-news/demonetisation-gst-impact-imf-lowers-india-s-2017-growth-forecast-to-6-7/story-UeJfgfJKPJOvbzo5kRexDM.html|access-date=26 May 2018|work=Hindustan Times|date=10 October 2017|ref=HTgrowth}}</ref> | India started recovery in 2013–14 when the GDP growth rate accelerated to 6.4% from the previous year's 5.5%. The acceleration continued through 2014–15 and 2015–16 with growth rates of 7.5% and 8.0% respectively. For the first time since 1990, India grew faster than China which registered 6.9% growth in 2015.{{update inline|date=June 2017}} However the growth rate subsequently decelerated, to 7.1% and 6.6% in 2016–17 and 2017–18 respectively,<ref>{{cite web|title=PRESS NOTE ON SECOND ADVANCE ESTIMATES OF NATIONAL INCOME 2017–18|url=http://mospi.nic.in/sites/default/files/press_release/nad_pr_2eni_28feb18_0.pdf|website=Ministry of Statistics and Programme Implementation|access-date=26 May 2018|ref=Mospi2018|archive-date=16 May 2018|archive-url=https://web.archive.org/web/20180516211929/http://mospi.nic.in/sites/default/files/press_release/nad_pr_2eni_28feb18_0.pdf|url-status=live}}</ref> partly because of the disruptive effects of [[2016 Indian banknote demonetisation]] and the [[Goods and Services Tax (India)]].<ref>{{cite news|title=Demonetisation, GST impact: IMF lowers India's 2017 growth forecast to 6.7%|url=https://www.hindustantimes.com/business-news/demonetisation-gst-impact-imf-lowers-india-s-2017-growth-forecast-to-6-7/story-UeJfgfJKPJOvbzo5kRexDM.html|access-date=26 May 2018|work=Hindustan Times|date=10 October 2017|ref=HTgrowth|archive-date=26 May 2018|archive-url=https://web.archive.org/web/20180526191323/https://www.hindustantimes.com/business-news/demonetisation-gst-impact-imf-lowers-india-s-2017-growth-forecast-to-6-7/story-UeJfgfJKPJOvbzo5kRexDM.html|url-status=live}}</ref> | ||
India is ranked 63rd out of 190 countries in the World Bank's 2020 [[ease of doing business index]], up 14 points from the last year's 100 and up 37 points in just two years.<ref>[https://www.doingbusiness.org/content/dam/doingBusiness/country/i/india/IND.pdf Economy Profile India] Doing Business 2020</ref> In terms of dealing with construction permits and enforcing contracts, it is ranked among the 10 worst in the world, while it has a relatively favourable ranking when it comes to protecting minority investors or getting credit.<ref name="World Bank and International Financial Corporation">{{cite web|url=http://www.doingbusiness.org/en/rankings|website=DoingBusiness.org|title=Rankings & Ease of Doing Business Score|access-date=31 October 2018}}</ref> The strong efforts taken by the Department of Industrial Policy and Promotion (DIPP) to boost ease of doing business rankings at the state level is said to affect the overall rankings of India.<ref>{{cite web|title=Business Reforms Action Plan|url=http://eodb.dipp.gov.in/index.aspx|website=Business Reforms Action Plan|access-date=8 July 2016|archive-date=15 February 2017|archive-url=https://web.archive.org/web/20170215021233/http://eodb.dipp.gov.in/index.aspx|url-status=dead}}</ref> | India is ranked 63rd out of 190 countries in the World Bank's 2020 [[ease of doing business index]], up 14 points from the last year's 100 and up 37 points in just two years.<ref>[https://www.doingbusiness.org/content/dam/doingBusiness/country/i/india/IND.pdf Economy Profile India] {{Webarchive|url=https://web.archive.org/web/20200714013432/https://www.doingbusiness.org/content/dam/doingBusiness/country/i/india/IND.pdf |date=14 July 2020 }} Doing Business 2020</ref> In terms of dealing with construction permits and enforcing contracts, it is ranked among the 10 worst in the world, while it has a relatively favourable ranking when it comes to protecting minority investors or getting credit.<ref name="World Bank and International Financial Corporation">{{cite web|url=http://www.doingbusiness.org/en/rankings|website=DoingBusiness.org|title=Rankings & Ease of Doing Business Score|access-date=31 October 2018|archive-date=15 September 2018|archive-url=https://web.archive.org/web/20180915112537/http://www.doingbusiness.org/en/rankings|url-status=live}}</ref> The strong efforts taken by the Department of Industrial Policy and Promotion (DIPP) to boost ease of doing business rankings at the state level is said to affect the overall rankings of India.<ref>{{cite web|title=Business Reforms Action Plan|url=http://eodb.dipp.gov.in/index.aspx|website=Business Reforms Action Plan|access-date=8 July 2016|archive-date=15 February 2017|archive-url=https://web.archive.org/web/20170215021233/http://eodb.dipp.gov.in/index.aspx|url-status=dead}}</ref> | ||
=== COVID-19 pandemic and aftermath (2020–present) === | === COVID-19 pandemic and aftermath (2020–present) === | ||
{{Main|Economic impact of the COVID-19 pandemic in India}} | {{Main|Economic impact of the COVID-19 pandemic in India}} | ||
During the [[COVID-19 pandemic in India|COVID-19 pandemic]], numerous [[rating agencies]] downgraded India's GDP predictions for FY21 to negative figures,<ref name=":49">{{Cite news|date=21 May 2020|title=A Bigger Hit on the Economy?|page=1|work=The Economic Times (ET Graphics)|url=https://epaper.timesgroup.com/|url-access=subscription|access-date=21 May 2020}}</ref><ref>{{Cite news|last=Noronha|first=Gaurav|date=2 May 2020|title=India's GDP to see 5% contraction in FY21, says Icra|work=The Economic Times|url=https://economictimes.indiatimes.com/news/economy/indicators/indias-gdp-to-see-5-contraction-in-fy21-says-icra/articleshow/75847028.cms|access-date=21 May 2020}}</ref> signalling a recession in India, the most severe since 1979.<ref>{{cite web|title=Goldman Sachs: India's economy will shrink 45% this quarter and suffer a brutal recession this year|url=https://www.businessinsider.in/stock-market/news/goldman-sachs-indias-economy-will-shrink-45-this-quarter-and-suffer-a-brutal-recession-this-year/articleshow/75807045.cms|last=Nagarajan|first=Shalini|date=21 May 2020|website=Business Insider|access-date=21 May 2020}}</ref><ref>{{cite web|title=Goldman report most damning|url=https://www.telegraphindia.com/india/goldman-on-economic-package-for-coronavirus-lockdown-narendra-modis-steps-smaller-than-upas/cid/1774089|date=19 May 2020|website=The Daily Telegraph|language=en|access-date=21 May 2020}}</ref> The Indian Economy contracted by 6.6 percent which was lower than the estimated 7.3 percent decline.<ref>{{cite news |title=Indian economy contracts by 6.6 pc in 2020–21 |url=https://economictimes.indiatimes.com/news/economy/indicators/indian-economy-contracts-by-6-6-pc-in-2020-21/articleshow/89248879.cms |access-date=3 September 2022 |work=The Economic Times |agency=Press Trust of India |date=31 January 2021 |archive-url=https://web.archive.org/web/20220131130834/https://economictimes.indiatimes.com/news/economy/indicators/indian-economy-contracts-by-6-6-pc-in-2020-21/articleshow/89248879.cms |archive-date=31 January 2022}}</ref> In 2022, the ratings agency [[Fitch Ratings]] upgraded India's outlook to stable similar to [[S&P Global Ratings]] and [[Moody's Investors Service]]'s outlooks.<ref>{{cite news |last1=Dhasmana |first1=Indivjal |last2=Choudhury |first2=Shrimi |title=Moody's upgrades India's rating outlook to 'stable' from 'negative' |url=https://www.business-standard.com/article/economy-policy/moody-s-changes-india-s-rating-outlook-to-stable-from-negative-121100501141_1.html |access-date=3 September 2022 |work=Business Standard |date=6 October 2021 |archive-url=https://web.archive.org/web/20220816021754/https://www.business-standard.com/article/economy-policy/moody-s-changes-india-s-rating-outlook-to-stable-from-negative-121100501141_1.html |archive-date=16 August 2022}}</ref> In the first quarter of financial year 2022–2023, the Indian economy grew by 13.5%.<ref>{{cite news |last1=Dhoot |first1=Vikas |title=India's GDP grows at 13.5% in April–June quarter |url=https://www.thehindu.com/business/Economy/indias-gdp-grows-at-135-in-april-june-quarter/article65833826.ece |access-date=3 September 2022 |work=The Hindu |date=31 August 2022 |archive-url=https://web.archive.org/web/20220903054834/https://www.thehindu.com/business/Economy/indias-gdp-grows-at-135-in-april-june-quarter/article65833826.ece |archive-date=3 September 2022}}</ref> | During the [[COVID-19 pandemic in India|COVID-19 pandemic]], numerous [[rating agencies]] downgraded India's GDP predictions for FY21 to negative figures,<ref name=":49">{{Cite news|date=21 May 2020|title=A Bigger Hit on the Economy?|page=1|work=The Economic Times (ET Graphics)|url=https://epaper.timesgroup.com/|url-access=subscription|access-date=21 May 2020|archive-date=17 June 2020|archive-url=https://web.archive.org/web/20200617152043/https://epaper.timesgroup.com/TOI/TimesOfIndia/index.html?a=c%2F|url-status=live}}</ref><ref>{{Cite news|last=Noronha|first=Gaurav|date=2 May 2020|title=India's GDP to see 5% contraction in FY21, says Icra|work=The Economic Times|url=https://economictimes.indiatimes.com/news/economy/indicators/indias-gdp-to-see-5-contraction-in-fy21-says-icra/articleshow/75847028.cms|access-date=21 May 2020|archive-date=26 June 2020|archive-url=https://web.archive.org/web/20200626043921/https://economictimes.indiatimes.com/news/economy/indicators/indias-gdp-to-see-5-contraction-in-fy21-says-icra/articleshow/75847028.cms|url-status=live}}</ref> signalling a recession in India, the most severe since 1979.<ref>{{cite web|title=Goldman Sachs: India's economy will shrink 45% this quarter and suffer a brutal recession this year|url=https://www.businessinsider.in/stock-market/news/goldman-sachs-indias-economy-will-shrink-45-this-quarter-and-suffer-a-brutal-recession-this-year/articleshow/75807045.cms|last=Nagarajan|first=Shalini|date=21 May 2020|website=Business Insider|access-date=21 May 2020|archive-date=3 June 2020|archive-url=https://web.archive.org/web/20200603134823/https://www.businessinsider.in/stock-market/news/goldman-sachs-indias-economy-will-shrink-45-this-quarter-and-suffer-a-brutal-recession-this-year/articleshow/75807045.cms|url-status=live}}</ref><ref>{{cite web|title=Goldman report most damning|url=https://www.telegraphindia.com/india/goldman-on-economic-package-for-coronavirus-lockdown-narendra-modis-steps-smaller-than-upas/cid/1774089|date=19 May 2020|website=The Daily Telegraph|language=en|access-date=21 May 2020|archive-date=25 May 2020|archive-url=https://web.archive.org/web/20200525122406/https://www.telegraphindia.com/india/goldman-on-economic-package-for-coronavirus-lockdown-narendra-modis-steps-smaller-than-upas/cid/1774089|url-status=live}}</ref> The Indian Economy contracted by 6.6 percent which was lower than the estimated 7.3 percent decline.<ref>{{cite news |title=Indian economy contracts by 6.6 pc in 2020–21 |url=https://economictimes.indiatimes.com/news/economy/indicators/indian-economy-contracts-by-6-6-pc-in-2020-21/articleshow/89248879.cms |access-date=3 September 2022 |work=The Economic Times |agency=Press Trust of India |date=31 January 2021 |archive-url=https://web.archive.org/web/20220131130834/https://economictimes.indiatimes.com/news/economy/indicators/indian-economy-contracts-by-6-6-pc-in-2020-21/articleshow/89248879.cms |archive-date=31 January 2022}}</ref> In 2022, the ratings agency [[Fitch Ratings]] upgraded India's outlook to stable similar to [[S&P Global Ratings]] and [[Moody's Investors Service]]'s outlooks.<ref>{{cite news |last1=Dhasmana |first1=Indivjal |last2=Choudhury |first2=Shrimi |title=Moody's upgrades India's rating outlook to 'stable' from 'negative' |url=https://www.business-standard.com/article/economy-policy/moody-s-changes-india-s-rating-outlook-to-stable-from-negative-121100501141_1.html |access-date=3 September 2022 |work=Business Standard |date=6 October 2021 |archive-url=https://web.archive.org/web/20220816021754/https://www.business-standard.com/article/economy-policy/moody-s-changes-india-s-rating-outlook-to-stable-from-negative-121100501141_1.html |archive-date=16 August 2022}}</ref> In the first quarter of financial year 2022–2023, the Indian economy grew by 13.5%.<ref>{{cite news |last1=Dhoot |first1=Vikas |title=India's GDP grows at 13.5% in April–June quarter |url=https://www.thehindu.com/business/Economy/indias-gdp-grows-at-135-in-april-june-quarter/article65833826.ece |access-date=3 September 2022 |work=The Hindu |date=31 August 2022 |archive-url=https://web.archive.org/web/20220903054834/https://www.thehindu.com/business/Economy/indias-gdp-grows-at-135-in-april-june-quarter/article65833826.ece |archive-date=3 September 2022}}</ref> | ||
== Data == | == Data == | ||
The following table shows the main economic indicators in 1980–2022 (with IMF staff estimates in | {{Update|date=October 2023}} | ||
The following table shows the main economic indicators in 1980–2022 (with IMF staff estimates in 2023–2028). Inflation below 5% is in green.<ref>{{cite news | url=https://www.imf.org/en/Publications/WEO/weo-database/2023/October/weo-report?c=534,&s=NGDP_RPCH,NGDPD,PPPGDP,NGDPDPC,PPPPC,PCPIPCH,GGXWDG_NGDP,&sy=1980&ey=2028&ssm=0&scsm=1&scc=0&ssd=1&ssc=0&sic=0&sort=country&ds=.&br=1 | title=Report for Selected Countries and Subjects | newspaper=Imf | access-date=10 October 2023 | archive-date=13 October 2023 | archive-url=https://web.archive.org/web/20231013153206/https://www.imf.org/en/Publications/WEO/weo-database/2023/October/weo-report?c=534,&s=NGDP_RPCH,NGDPD,PPPGDP,NGDPDPC,PPPPC,PCPIPCH,GGXWDG_NGDP,&sy=1980&ey=2028&ssm=0&scsm=1&scc=0&ssd=1&ssc=0&sic=0&sort=country&ds=.&br=1 | url-status=live }}</ref> The annual unemployment rate is extracted from the [[World Bank]], although the [[International Monetary Fund]] finds them unreliable.<ref name=":5">{{Cite web |title=Unemployment, total (% of total labor force) (modeled ILO estimate) {{!}} Data |url=https://data.worldbank.org/indicator/SL.UEM.TOTL.ZS |access-date=2022-03-01 |website=data.worldbank.org |archive-date=12 June 2019 |archive-url=https://web.archive.org/web/20190612090355/https://data.worldbank.org/indicator/SL.UEM.TOTL.ZS |url-status=live }}</ref> | |||
{| class="wikitable" style="text-align:center;" | {| class="wikitable" style="text-align:center;" | ||
!Year | !Year | ||
| Line 282: | Line 280: | ||
|189.4 | |189.4 | ||
|271.0 | |271.0 | ||
|{{increase}} | |{{increase}}6.74% | ||
|{{IncreaseNegative}}11.3% | |{{IncreaseNegative}}11.3% | ||
|n/a | |n/a | ||
| Line 292: | Line 290: | ||
|{{increase}}196.5 | |{{increase}}196.5 | ||
|{{increase}}274.7 | |{{increase}}274.7 | ||
|{{increase}}6. | |{{increase}}6.01% | ||
|{{IncreaseNegative}}12.7% | |{{IncreaseNegative}}12.7% | ||
|n/a | |n/a | ||
| Line 323: | Line 321: | ||
|{{decrease}}281.1 | |{{decrease}}281.1 | ||
|{{increase}}3.8% | |{{increase}}3.8% | ||
|{{ | |{{DecreasePositive}}5.2% | ||
|n/a | |n/a | ||
|n/a | |n/a | ||
| Line 333: | Line 331: | ||
|{{increase}}302.9 | |{{increase}}302.9 | ||
|{{increase}}5.3% | |{{increase}}5.3% | ||
|{{ | |{{DecreasePositive}}5.56%<ref>{{Cite web |url=https://www.officialdata.org/india/inflation/1985 |title=Archived copy |access-date=16 October 2023 |archive-date=17 October 2023 |archive-url=https://web.archive.org/web/20231017175623/https://www.officialdata.org/india/inflation/1985 |url-status=live }}</ref> | ||
|n/a | |n/a | ||
|n/a | |n/a | ||
| Line 343: | Line 341: | ||
|{{increase}}315.2 | |{{increase}}315.2 | ||
|{{increase}}4.8% | |{{increase}}4.8% | ||
|{{IncreaseNegative}}8. | |{{IncreaseNegative}}7.8%<ref>{{Cite web |url=https://www.indiabudget.gov.in/budget_archive/es1986-87/1%20The%20Economic%20Situation%20in%201986-87.pdf |title=Archived copy |access-date=16 October 2023 |archive-date=15 August 2022 |archive-url=https://web.archive.org/web/20220815011409/https://www.indiabudget.gov.in/budget_archive/es1986-87/1%20The%20Economic%20Situation%20in%201986-87.pdf |url-status=live }}</ref> | ||
|n/a | |n/a | ||
|n/a | |n/a | ||
| Line 672: | Line 670: | ||
|{{increase}}2,835.6 | |{{increase}}2,835.6 | ||
|{{increase}}2,050.2 | |{{increase}}2,050.2 | ||
|{{increase}} | |{{increase}}4.2% | ||
|{{increase}}4.8% | |{{increase}}4.8% | ||
|{{DecreasePositive}}5.3% | |{{DecreasePositive}}5.3% | ||
| Line 773: | Line 771: | ||
{{update|date=June 2023}} | {{update|date=June 2023}} | ||
{{Main|Agriculture in India|Forestry in India|Animal husbandry in India|Fishing in India|Natural resources in India}} | {{Main|Agriculture in India|Forestry in India|Animal husbandry in India|Fishing in India|Natural resources in India}} | ||
Agriculture and allied sectors like forestry, logging and fishing accounted for 17% of the GDP, the sector employed 49% of its total workforce in 2014.<ref>{{cite web|title=Indian Economy At a Glance |url=https://principles-of-economics-and-business.blogspot.com/2015/09/indian-economy-at-glance.html|access-date=9 October 2015}}</ref> Agriculture accounted for 23% of GDP, and employed 59% of the country's total workforce in 2016.<ref name="WTTCBenchmark">{{cite web |title=BENCHMARK REPORT 2017 – INDI |url=https://www.wttc.org/-/media/files/reports/benchmark-reports/country-reports-2017/india.pdf |url-status=dead |archive-url=https://web.archive.org/web/20180412082953/https://www.wttc.org/-/media/files/reports/benchmark-reports/country-reports-2017/india.pdf |archive-date=12 April 2018 |access-date=11 April 2018 |website=World Travel and Tourism Council}}</ref> India ranks second globally in food and [[List of largest producing countries of agricultural commodities|agricultural production]], while agricultural exports were $35.09 billion.<ref name="bs_India" /><ref>{{cite news|url=https://www.ibef.org/industry/agriculture-india.aspx|website=ibef.org|title= Agriculture in India: Information About Indian Agriculture & Its Importance |access-date=22 June 2019}}</ref> As the Indian economy has diversified and grown, agriculture's contribution to GDP has steadily declined from 1951 to 2011, yet it is still the country's largest employment source and a significant piece of its overall socio-economic development.{{sfn|Economic Survey|2010|p=180}} Crop-yield-per-unit-area of all crops has grown since 1950, due to the special emphasis placed on agriculture in the five-year plans and steady improvements in irrigation, technology, application of modern agricultural practices and provision of agricultural credit and subsidies since the Green Revolution in India. However, international comparisons reveal the average yield in India is generally 30% to 50% of the highest average yield in the world.<ref name="Datt-5">{{Harvnb|Datt|Sundharam|2009|pp=499–501}}</ref> The states of [[Uttar Pradesh]], [[Punjab, India|Punjab]], Haryana, [[Madhya Pradesh]], Andhra Pradesh, [[Telangana]], Bihar, [[West Bengal]], Gujarat and [[Maharashtra]] are key contributors to Indian agriculture. | Agriculture and allied sectors like forestry, logging and fishing accounted for 17% of the GDP, the sector employed 49% of its total workforce in 2014.<ref>{{cite web|title=Indian Economy At a Glance|url=https://principles-of-economics-and-business.blogspot.com/2015/09/indian-economy-at-glance.html|access-date=9 October 2015|archive-date=15 May 2016|archive-url=https://web.archive.org/web/20160515154408/http://principles-of-economics-and-business.blogspot.com/2015/09/indian-economy-at-glance.html|url-status=live}}</ref> Agriculture accounted for 23% of GDP, and employed 59% of the country's total workforce in 2016.<ref name="WTTCBenchmark">{{cite web |title=BENCHMARK REPORT 2017 – INDI |url=https://www.wttc.org/-/media/files/reports/benchmark-reports/country-reports-2017/india.pdf |url-status=dead |archive-url=https://web.archive.org/web/20180412082953/https://www.wttc.org/-/media/files/reports/benchmark-reports/country-reports-2017/india.pdf |archive-date=12 April 2018 |access-date=11 April 2018 |website=World Travel and Tourism Council}}</ref> India ranks second globally in food and [[List of largest producing countries of agricultural commodities|agricultural production]], while agricultural exports were $35.09 billion.<ref name="bs_India" /><ref>{{cite news|url=https://www.ibef.org/industry/agriculture-india.aspx|website=ibef.org|title=Agriculture in India: Information About Indian Agriculture & Its Importance|access-date=22 June 2019|archive-date=6 March 2022|archive-url=https://web.archive.org/web/20220306143723/https://www.ibef.org/industry/agriculture-india.aspx|url-status=live}}</ref> As the Indian economy has diversified and grown, agriculture's contribution to GDP has steadily declined from 1951 to 2011, yet it is still the country's largest employment source and a significant piece of its overall socio-economic development.{{sfn|Economic Survey|2010|p=180}} Crop-yield-per-unit-area of all crops has grown since 1950, due to the special emphasis placed on agriculture in the five-year plans and steady improvements in irrigation, technology, application of modern agricultural practices and provision of agricultural credit and subsidies since the Green Revolution in India. However, international comparisons reveal the average yield in India is generally 30% to 50% of the highest average yield in the world.<ref name="Datt-5">{{Harvnb|Datt|Sundharam|2009|pp=499–501}}</ref> The states of [[Uttar Pradesh]], [[Punjab, India|Punjab]], Haryana, [[Madhya Pradesh]], Andhra Pradesh, [[Telangana]], Bihar, [[West Bengal]], Gujarat and [[Maharashtra]] are key contributors to Indian agriculture. | ||
{{multiple image | {{multiple image | ||
| Line 786: | Line 784: | ||
}} | }} | ||
India receives an average annual rainfall of {{convert|1208|mm|in}} and a total annual [[precipitation (meteorology)|precipitation]] of 4,000 billion cubic metres, with the total utilisable [[Water resources in India|water resources]], including surface and [[groundwater]], amounting to 1,123 billion cubic metres.<ref>{{cite web|url=http://cwc.gov.in/main/webpages/statistics.html#2|title=India – Land and Water Resources at a glance|publisher=Central Water Commission, Government of India|access-date=18 November 2010|archive-url=https://web.archive.org/web/20101119200518/http://cwc.gov.in/main/webpages/statistics.html#2|archive-date=19 November 2010|url-status=dead}}</ref> {{convert|546820|km2|mi2}} of the land area, or about 39% of the total cultivated area, is irrigated.<ref name="irrigation">{{cite web|url=http://mowr.gov.in/writereaddata/linkimages/statewiseirrigated2079753822.pdf |title=State-Wise Details of Net Irrigated Area (NIA), Net Sown Area (NSA) And Percentage of NIA To NSA |publisher=Ministry of Water Resources, Government of India |access-date=18 November 2010 |url-status=dead |archive-url=https://web.archive.org/web/20110721161906/http://mowr.gov.in/writereaddata/linkimages/statewiseirrigated2079753822.pdf |archive-date=21 July 2011 }}</ref> India's inland water resources and marine resources provide employment to nearly 6 million people in the fisheries sector. In 2010, India had the world's sixth-largest fishing industry.<ref>{{cite web|url=http://www.fisheries.is/economy/fisheries-impacts/global-comparison/ |title=Fishery – Global Comparison|access-date=9 October 2015}}</ref> | India receives an average annual rainfall of {{convert|1208|mm|in}} and a total annual [[precipitation (meteorology)|precipitation]] of 4,000 billion cubic metres, with the total utilisable [[Water resources in India|water resources]], including surface and [[groundwater]], amounting to 1,123 billion cubic metres.<ref>{{cite web|url=http://cwc.gov.in/main/webpages/statistics.html#2|title=India – Land and Water Resources at a glance|publisher=Central Water Commission, Government of India|access-date=18 November 2010|archive-url=https://web.archive.org/web/20101119200518/http://cwc.gov.in/main/webpages/statistics.html#2|archive-date=19 November 2010|url-status=dead}}</ref> {{convert|546820|km2|mi2}} of the land area, or about 39% of the total cultivated area, is irrigated.<ref name="irrigation">{{cite web|url=http://mowr.gov.in/writereaddata/linkimages/statewiseirrigated2079753822.pdf |title=State-Wise Details of Net Irrigated Area (NIA), Net Sown Area (NSA) And Percentage of NIA To NSA |publisher=Ministry of Water Resources, Government of India |access-date=18 November 2010 |url-status=dead |archive-url=https://web.archive.org/web/20110721161906/http://mowr.gov.in/writereaddata/linkimages/statewiseirrigated2079753822.pdf |archive-date=21 July 2011 }}</ref> India's inland water resources and marine resources provide employment to nearly 6 million people in the fisheries sector. In 2010, India had the world's sixth-largest fishing industry.<ref>{{cite web|url=http://www.fisheries.is/economy/fisheries-impacts/global-comparison/|title=Fishery – Global Comparison|access-date=9 October 2015|archive-date=14 September 2016|archive-url=https://web.archive.org/web/20160914081920/http://www.fisheries.is/economy/fisheries-impacts/global-comparison|url-status=dead}}</ref> | ||
[[File:Cashew nut packet.jpg|thumb|India exports more than {{convert|100,000|t}} of processed cashew kernels every year. There are more than 600 cashew processing units in [[Kollam]] alone.<ref name="auto1">{{cite news|url=http://www.qmak.in/mypics%5C91120154629572.pdf|title=Cashew industry : Challenges and Opportunities|access-date=22 March 2016}}</ref>]] | [[File:Cashew nut packet.jpg|thumb|India exports more than {{convert|100,000|t}} of processed cashew kernels every year. There are more than 600 cashew processing units in [[Kollam]] alone.<ref name="auto1">{{cite news|url=http://www.qmak.in/mypics%5C91120154629572.pdf|title=Cashew industry : Challenges and Opportunities|access-date=22 March 2016|archive-date=28 May 2016|archive-url=https://web.archive.org/web/20160528021450/http://qmak.in/mypics/91120154629572.pdf|url-status=live}}</ref>]] | ||
India is the largest producer of milk, jute and [[legume|pulses]], and has the world's second-largest cattle population with 170 million animals in 2011.<ref>{{cite news|url=https://www.economist.com/blogs/dailychart/2011/07/global-livestock-counts|title=Economist – Global livestock counts|access-date=9 October 2015}}</ref> It is the second-largest producer of rice, wheat, sugarcane, cotton and [[peanut|groundnuts]], as well as the second-largest fruit and vegetable producer, accounting for 10.9% and 8.6% of the world fruit and vegetable production, respectively. India is also the second-largest producer and the largest consumer of silk, producing {{convert|77000|t}} in 2005.<ref name="fao-silk">{{cite web|url=http://www.fao.org/es/ess/top/commodity.html?lang=en&item=1185&year=2005 |title=Major Food And Agricultural Commodities And Producers – Countries By Commodity |publisher=[[FAO]] |access-date=12 December 2009}}</ref> India is the largest exporter of cashew kernels and cashew nut shell liquid (CNSL). Foreign exchange earned by the country through the export of cashew kernels during 2011–12 reached {{INRConvert|43.9|b|lk=on|year=2012}} based on statistics from the [[Cashew Export Promotion Council of India]] (CEPCI). {{convert|131,000|t}} of kernels were exported during 2011–12.<ref>{{cite news|url=http://www.thehindu.com/news/national/kerala/rise-in-earnings-from-cashew-kernel-exports/article3893095.ece|title=Rise in earnings from cashew kernel exports – The Hindu|access-date=22 March 2016}}</ref> There are about 600 cashew processing units in [[Kollam]], Kerala.<ref name="auto1" /> | India is the largest producer of milk, jute and [[legume|pulses]], and has the world's second-largest cattle population with 170 million animals in 2011.<ref>{{cite news|url=https://www.economist.com/blogs/dailychart/2011/07/global-livestock-counts|title=Economist – Global livestock counts|access-date=9 October 2015|archive-date=15 July 2016|archive-url=https://web.archive.org/web/20160715181213/http://www.economist.com/blogs/dailychart/2011/07/global-livestock-counts|url-status=live}}</ref> It is the second-largest producer of rice, wheat, sugarcane, cotton and [[peanut|groundnuts]], as well as the second-largest fruit and vegetable producer, accounting for 10.9% and 8.6% of the world fruit and vegetable production, respectively. India is also the second-largest producer and the largest consumer of silk, producing {{convert|77000|t}} in 2005.<ref name="fao-silk">{{cite web |url=http://www.fao.org/es/ess/top/commodity.html?lang=en&item=1185&year=2005 |title=Major Food And Agricultural Commodities And Producers – Countries By Commodity |publisher=[[FAO]] |access-date=12 December 2009 |archive-date=28 March 2012 |archive-url=https://web.archive.org/web/20120328071129/http://www.fao.org/es/ess/top/commodity.html?lang=en&item=1185&year=2005 |url-status=live }}</ref> India is the largest exporter of cashew kernels and cashew nut shell liquid (CNSL). Foreign exchange earned by the country through the export of cashew kernels during 2011–12 reached {{INRConvert|43.9|b|lk=on|year=2012}} based on statistics from the [[Cashew Export Promotion Council of India]] (CEPCI). {{convert|131,000|t}} of kernels were exported during 2011–12.<ref>{{cite news|url=http://www.thehindu.com/news/national/kerala/rise-in-earnings-from-cashew-kernel-exports/article3893095.ece|title=Rise in earnings from cashew kernel exports – The Hindu|access-date=22 March 2016|archive-date=7 January 2020|archive-url=https://web.archive.org/web/20200107134050/https://www.thehindu.com/news/national/kerala/rise-in-earnings-from-cashew-kernel-exports/article3893095.ece|url-status=live}}</ref> There are about 600 cashew processing units in [[Kollam]], Kerala.<ref name="auto1" /> | ||
India's foodgrain production remained stagnant at approximately {{convert|252|Mt|e6LT e6ST|abbr=off}} during both the 2015–16 and 2014–15 crop years (July–June).<ref>{{cite news|url=http://www.businesstoday.in/sectors/agriculture/govt-eyes-bumper-agri-production-on-good-monsoon-hopes/story/233549.html|title=Govt eyes bumper agriculture production on good monsoon hopes|access-date=22 June 2016}}</ref> | [[File:Tea_plantation_in_Sonitpur_district_of_Assam,_India.jpg|thumb| [[Assam tea|Assam]] is largest tea producer in India]] | ||
[[File:Tadiandamol_Trek_Starting_point_near_resort.jpg|thumb|[[Kodagu district|Kodagu]] is the largest producer of Coffee and Pepper in India]] | |||
India's foodgrain production remained stagnant at approximately {{convert|252|Mt|e6LT e6ST|abbr=off}} during both the 2015–16 and 2014–15 crop years (July–June).<ref>{{cite news|url=http://www.businesstoday.in/sectors/agriculture/govt-eyes-bumper-agri-production-on-good-monsoon-hopes/story/233549.html|title=Govt eyes bumper agriculture production on good monsoon hopes|access-date=22 June 2016|archive-date=15 June 2016|archive-url=https://web.archive.org/web/20160615030615/http://www.businesstoday.in/sectors/agriculture/govt-eyes-bumper-agri-production-on-good-monsoon-hopes/story/233549.html|url-status=live}}</ref> | |||
India exports several agriculture products, such as Basmati rice, wheat, cereals, spices, fresh fruits, dry fruits, buffalo beef meat, cotton, tea, coffee and other cash crops particularly to the Middle East, Southeast and East Asian countries. About 10 percent of its export earnings come from this trade.<ref name=moci>[http://www.dgciskol.nic.in/ Foreign Trade Performance of India Annual Report] {{Webarchive|url=https://web.archive.org/web/20140726163416/http://www.dgciskol.nic.in/ |date=26 July 2014 }} Directorate General of Commercial Intelligence and Statistics, Ministry of Commerce and Industry, Government of India (2012)</ref> | India exports several agriculture products, such as Basmati rice, wheat, cereals, spices, fresh fruits, dry fruits, buffalo beef meat, cotton, tea, coffee and other cash crops particularly to the Middle East, Southeast and East Asian countries. About 10 percent of its export earnings come from this trade.<ref name=moci>[http://www.dgciskol.nic.in/ Foreign Trade Performance of India Annual Report] {{Webarchive|url=https://web.archive.org/web/20140726163416/http://www.dgciskol.nic.in/ |date=26 July 2014 }} Directorate General of Commercial Intelligence and Statistics, Ministry of Commerce and Industry, Government of India (2012)</ref> | ||
[[File:Sugarcane weighing at sugarmill.jpg|thumb|right|Sugarcane weighing at a [[Cooperative sugar factories in Maharashtra|Pravara Sahakari Sakhar Karkhana Ltd]] in Maharashtra]] | [[File:Sugarcane weighing at sugarmill.jpg|thumb|right|Sugarcane weighing at a [[Cooperative sugar factories in Maharashtra|Pravara Sahakari Sakhar Karkhana Ltd]] in Maharashtra]] | ||
At around {{convert|1530000|km2}}, India has the second-largest amount of arable land, after US, with 52% of total land under cultivation. Although the total land area of the country is only slightly more than one-third of China or US, India's arable land is marginally smaller than that of US, and marginally larger than that of China. However, agricultural output lags far behind its potential.<ref name="nytagriculture">{{cite news|url=https://www.nytimes.com/2008/06/22/business/22indiafood.html|title=The Food Chain in Fertile India, Growth Outstrips Agriculture|newspaper=The New York Times|date=22 June 2008|first=Somini|last=Sengupta|access-date=29 March 2010}}</ref> The low productivity in India is a result of several factors | At around {{convert|1530000|km2}}, India has the second-largest amount of arable land, after US, with 52% of total land under cultivation. Although the total land area of the country is only slightly more than one-third of China or US, India's arable land is marginally smaller than that of US, and marginally larger than that of China. However, agricultural output lags far behind its potential.<ref name="nytagriculture">{{cite news|url=https://www.nytimes.com/2008/06/22/business/22indiafood.html|title=The Food Chain in Fertile India, Growth Outstrips Agriculture|newspaper=The New York Times|date=22 June 2008|first=Somini|last=Sengupta|access-date=29 March 2010|archive-date=12 May 2011|archive-url=https://web.archive.org/web/20110512072651/http://www.nytimes.com/2008/06/22/business/22indiafood.html|url-status=live}}</ref> The low productivity in India is a result of several factors.Over-regulation of agriculture has increased costs, price risks and uncertainty, and governmental intervention in labour, land, and credit are hurting the market. Infrastructure such as rural roads, electricity, ports, food storage, retail markets and services remain inadequate.<ref name="agriculturepriorities">{{cite web|url=http://go.worldbank.org/8EFXZBL3Y0|title=India: Priorities for Agriculture and Rural Development|publisher=World Bank|access-date=8 January 2011}}</ref> The average size of land holdings is very small, with 70% of holdings being less than {{convert|1|ha|spell=in}} in size.<ref>{{Harvnb|Panagariya|2008|p=318}}</ref> Irrigation facilities are inadequate, as revealed by the fact that only 46% of the total cultivable land was irrigated {{as of|2016|lc=y|post=,}}<ref name="irrigation" /> resulting in farmers still being dependent on rainfall, specifically the [[Monsoon of India|monsoon season]], which is often inconsistent and unevenly distributed across the country.<ref>{{Harvnb|Datt|Sundharam|2009|p=502}}</ref> In an effort to bring an additional {{convert|20000000|ha}} of land under irrigation, various schemes have been attempted, including the Accelerated Irrigation Benefit Programme (AIBP) which was provided {{INRConvert|800|b|year=2016}} in the [[Union budget of India|Union Budget]].<ref>{{cite news|url=http://www.dnaindia.com/money/report-agriculture-production-to-double-with-rs-80000-crore-irrigation-scheme-others-nitin-gadkari-2223667|title=Agriculture production to double with Rs 80000 crore irrigation scheme, others: Nitin Gadkari|access-date=22 June 2016|newspaper=[[Daily News and Analysis]]|archive-date=7 May 2017|archive-url=https://web.archive.org/web/20170507141209/http://www.dnaindia.com/money/report-agriculture-production-to-double-with-rs-80000-crore-irrigation-scheme-others-nitin-gadkari-2223667|url-status=live}}</ref> Farming incomes are also hampered by lack of food storage and distribution infrastructure; a third of India's agricultural production is lost from spoilage.<ref name="India's Food Transportation Ordeal" /> | ||
=== Manufacturing and industry === | === Manufacturing and industry === | ||
{{update|date=June 2023}} | {{update|date=June 2023}} | ||
{{Further|List of industrial cities in India}} | {{Further|List of industrial cities in India}} | ||
Industry accounts for 26% of GDP and employs 22% of the total workforce, and [[Mumbai]] is generally considered the industrial capital.<ref name="quandl.com">{{cite web |url=http://www.quandl.com/economics/india-all-economic-indicators#Productive+Sectors |title=India – All Economic Indicators on Quandl |access-date=8 October 2013 |url-status=dead |archive-url=https://web.archive.org/web/20130107091035/http://www.quandl.com/economics/india-all-economic-indicators#Productive+Sectors |archive-date=7 January 2013 }}</ref> According to the World Bank, India's industrial manufacturing GDP output in 2015 was 6th largest in the world on current US dollar basis ($559 billion),<ref>[http://unstats.un.org/unsd/snaama/dnlList.asp GDP and its breakdown at current prices in US Dollars] United Nations Statistics Division (2013)</ref> and 9th largest on inflation-adjusted constant 2005 US dollar basis ($197.1 billion).<ref>[http://unstats.un.org/unsd/snaama/dnlList.asp GDP and its breakdown at constant 2005 prices in US Dollars] United Nations Statistics Division (2013)</ref> The industrial sector underwent significant changes due to the 1991 economic reforms, which removed import restrictions, brought in foreign competition, led to the privatisation of certain government-owned public-sector industries, liberalised the foreign direct investment (FDI) regime,<ref>{{Cite web|url=http://www.narendramodi.in/media-coverage/485523|title=FDI reforms to push India-US trade: USIBC|date=21 August 2016|archive-url=https://web.archive.org/web/20160821221011/http://www.narendramodi.in/media-coverage/485523 |archive-date=21 August 2016 }}</ref> improved infrastructure and led to an expansion in the production of [[fast-moving consumer goods]].{{sfn|Task Force Report|2006|pp=9–10}} Post-liberalisation, the Indian private sector was faced with increasing domestic and foreign competition, including the threat of cheaper Chinese imports. It has since handled the change by squeezing costs, revamping management, and relying on cheap labour and new technology. However, this has also reduced employment generation, even among smaller manufacturers who previously relied on labour-intensive processes.<ref>{{Harvnb|Kumar|2005|pp=1040–1041}}</ref> Manufacturing and tech industries are geographically located in industrial regions in India,<ref>{{Cite web |date=2018-11-28 |title=Industrial Regions in India |url=https://www.jagranjosh.com/general-knowledge/industrial-regions-in-india-1448686424-1 |access-date=2022-03-05 |website=Jagranjosh.com|df=dmy-all}}</ref> It is also the world's [[List of countries by coal production|second-largest]] coal producer, the second-largest agrochemical producer, the [[List of countries by cement production|second-largest]] cement producer, the [[List of countries by steel production|second-largest]] steel producer, and the [[List of countries by electricity production|third-largest]] electricity producer.<ref name="BP2019">{{cite web|url=https://www.bp.com/content/dam/bp/business-sites/en/global/corporate/pdfs/energy-economics/statistical-review/bp-stats-review-2019-full-report.pdf|title=BP Statistical Review of World Energy June 2019}}</ref><ref>{{cite web|url=https://www.worldsteel.org/en/dam/jcr:dcd93336-2756-486e-aa7f-64f6be8e6b1e/2018%2520global%2520crude%2520steel%2520production.pdf|title=World Crude Steel Production|date=2 January 2019|website=WorldSteel|access-date=1 February 2019}}</ref> | Industry accounts for 26% of GDP and employs 22% of the total workforce, and [[Mumbai]] is generally considered the industrial capital.<ref name="quandl.com">{{cite web |url=http://www.quandl.com/economics/india-all-economic-indicators#Productive+Sectors |title=India – All Economic Indicators on Quandl |access-date=8 October 2013 |url-status=dead |archive-url=https://web.archive.org/web/20130107091035/http://www.quandl.com/economics/india-all-economic-indicators#Productive+Sectors |archive-date=7 January 2013 }}</ref> According to the World Bank, India's industrial manufacturing GDP output in 2015 was 6th largest in the world on current US dollar basis ($559 billion),<ref>[http://unstats.un.org/unsd/snaama/dnlList.asp GDP and its breakdown at current prices in US Dollars] {{Webarchive|url=https://web.archive.org/web/20180121182318/https://unstats.un.org/unsd/snaama/dnlList.asp |date=21 January 2018 }} United Nations Statistics Division (2013)</ref> and 9th largest on inflation-adjusted constant 2005 US dollar basis ($197.1 billion).<ref>[http://unstats.un.org/unsd/snaama/dnlList.asp GDP and its breakdown at constant 2005 prices in US Dollars] {{Webarchive|url=https://web.archive.org/web/20180121182318/https://unstats.un.org/unsd/snaama/dnlList.asp |date=21 January 2018 }} United Nations Statistics Division (2013)</ref> The industrial sector underwent significant changes due to the 1991 economic reforms, which removed import restrictions, brought in foreign competition, led to the privatisation of certain government-owned public-sector industries, liberalised the foreign direct investment (FDI) regime,<ref>{{Cite web|url=http://www.narendramodi.in/media-coverage/485523|title=FDI reforms to push India-US trade: USIBC|date=21 August 2016|archive-url=https://web.archive.org/web/20160821221011/http://www.narendramodi.in/media-coverage/485523 |archive-date=21 August 2016 }}</ref> improved infrastructure and led to an expansion in the production of [[fast-moving consumer goods]].{{sfn|Task Force Report|2006|pp=9–10}} Post-liberalisation, the Indian private sector was faced with increasing domestic and foreign competition, including the threat of cheaper Chinese imports. It has since handled the change by squeezing costs, revamping management, and relying on cheap labour and new technology. However, this has also reduced employment generation, even among smaller manufacturers who previously relied on labour-intensive processes.<ref>{{Harvnb|Kumar|2005|pp=1040–1041}}</ref> Manufacturing and tech industries are geographically located in industrial regions in India,<ref>{{Cite web |date=2018-11-28 |title=Industrial Regions in India |url=https://www.jagranjosh.com/general-knowledge/industrial-regions-in-india-1448686424-1 |access-date=2022-03-05 |website=Jagranjosh.com |df=dmy-all |archive-date=26 February 2022 |archive-url=https://web.archive.org/web/20220226225509/https://www.jagranjosh.com/general-knowledge/industrial-regions-in-india-1448686424-1 |url-status=live }}</ref> It is also the world's [[List of countries by coal production|second-largest]] coal producer, the second-largest agrochemical producer, the [[List of countries by cement production|second-largest]] cement producer, the [[List of countries by steel production|second-largest]] steel producer, and the [[List of countries by electricity production|third-largest]] electricity producer.<ref name="BP2019">{{cite web|url=https://www.bp.com/content/dam/bp/business-sites/en/global/corporate/pdfs/energy-economics/statistical-review/bp-stats-review-2019-full-report.pdf|title=BP Statistical Review of World Energy June 2019|access-date=10 September 2019|archive-date=26 December 2019|archive-url=https://web.archive.org/web/20191226123745/https://www.bp.com/content/dam/bp/business-sites/en/global/corporate/pdfs/energy-economics/statistical-review/bp-stats-review-2019-full-report.pdf|url-status=live}}</ref><ref>{{cite web|url=https://www.worldsteel.org/en/dam/jcr:dcd93336-2756-486e-aa7f-64f6be8e6b1e/2018%2520global%2520crude%2520steel%2520production.pdf|title=World Crude Steel Production|date=2 January 2019|website=WorldSteel|access-date=1 February 2019|archive-date=2 February 2019|archive-url=https://web.archive.org/web/20190202042330/https://www.worldsteel.org/en/dam/jcr:dcd93336-2756-486e-aa7f-64f6be8e6b1e/2018%2520global%2520crude%2520steel%2520production.pdf|url-status=dead}}</ref> | ||
==== Agrochemicals and Fertilizers ==== | ==== Agrochemicals and Fertilizers ==== | ||
[[File:NFL Vijaipur Unit.jpg|thumb|[[National Fertilizers]] Vijapur Unit 2 as seen from prilling tower]] | [[File:NFL Vijaipur Unit.jpg|thumb|[[National Fertilizers]] Vijapur Unit 2 as seen from prilling tower]] | ||
At present, 57 large fertilizer units are manufacturing a wide number of nitrogen fertilizers. These include 29 urea-producing units and 9 ammonia sulfate-producing units as a by-product. Besides, there are 64 small-scale producing units of single super phosphate.<ref>{{Cite web|url=https://timesofagriculture.in/top-fertilizer-companies-in-india/|title=Top 15 Fertilizer Companies in India: Nurturing Agricultural Growth|date=8 June 2023}}</ref> | At present, 57 large fertilizer units are manufacturing a wide number of nitrogen fertilizers. These include 29 urea-producing units and 9 ammonia sulfate-producing units as a by-product. Besides, there are 64 small-scale producing units of single super phosphate.<ref>{{Cite web|url=https://timesofagriculture.in/top-fertilizer-companies-in-india/|title=Top 15 Fertilizer Companies in India: Nurturing Agricultural Growth|date=8 June 2023|access-date=17 August 2023|archive-date=17 August 2023|archive-url=https://web.archive.org/web/20230817065434/https://timesofagriculture.in/top-fertilizer-companies-in-india/|url-status=live}}</ref> | ||
According to the latest data released by the WTO, India has emerged as the second largest exporter of agrochemicals in the world. The rank was sixth, 10 years ago.The Indian agrochemical industry fetches valuable trade surplus every year. The trade surplus sharply increased from Rs. 8,030 crores in 2017–18 to Rs. 28,908 crores in the last fiscal. | According to the latest data released by the WTO, India has emerged as the second largest exporter of agrochemicals in the world. The rank was sixth, 10 years ago.The Indian agrochemical industry fetches valuable trade surplus every year. The trade surplus sharply increased from Rs. 8,030 crores in 2017–18 to Rs. 28,908 crores in the last fiscal. | ||
India's agrochemicals export has doubled in the last 6 years from $2.6 bn in 2017–18 to $5.4 bn in the last financial year according to the data recently released by Ministry of Commerce. It has grown at an impressive CAGR of 13% which is among the highest in the manufacturing sector.<ref>{{Cite news|url=https://sundayguardianlive.com/news/india-gains-global-prominence-in-agrochemicals-export|title=India gains global prominence in agrochemicals export|date=28 May 2023|website=sundayguardianlive.com}}</ref> | India's agrochemicals export has doubled in the last 6 years from $2.6 bn in 2017–18 to $5.4 bn in the last financial year according to the data recently released by Ministry of Commerce. It has grown at an impressive CAGR of 13% which is among the highest in the manufacturing sector.<ref>{{Cite news|url=https://sundayguardianlive.com/news/india-gains-global-prominence-in-agrochemicals-export|title=India gains global prominence in agrochemicals export|date=28 May 2023|website=sundayguardianlive.com|access-date=28 July 2023|archive-date=28 July 2023|archive-url=https://web.archive.org/web/20230728060720/https://sundayguardianlive.com/news/india-gains-global-prominence-in-agrochemicals-export|url-status=live}}</ref> | ||
Millions of farmers in over 130 countries trust Indian agrochemicals for their high quality and affordable prices, said an industry observer. With the global agrochemicals market estimated at $78 billion, predominantly comprising post-patent products, India is rapidly becoming a preferred global hub for sourcing such agrochemicals. To bolster domestic production and reduce imports, the Crop Care Federation of India (CCFI) has recommended specific measures to the Government of India.<ref>{{Cite news|url=https://krishijagran.com/news/india-emerges-as-global-powerhouse-in-agrochemical-exports-setting-new-industry-standards/|title=India Emerges as Global Powerhouse in Agrochemical Exports, Setting New Industry Standards|first=P.|last=S. Saini|website=krishijagran.com}}</ref> | Millions of farmers in over 130 countries trust Indian agrochemicals for their high quality and affordable prices, said an industry observer. With the global agrochemicals market estimated at $78 billion, predominantly comprising post-patent products, India is rapidly becoming a preferred global hub for sourcing such agrochemicals. To bolster domestic production and reduce imports, the Crop Care Federation of India (CCFI) has recommended specific measures to the Government of India.<ref>{{Cite news|url=https://krishijagran.com/news/india-emerges-as-global-powerhouse-in-agrochemical-exports-setting-new-industry-standards/|title=India Emerges as Global Powerhouse in Agrochemical Exports, Setting New Industry Standards|first=P.|last=S. Saini|website=krishijagran.com|access-date=28 July 2023|archive-date=28 July 2023|archive-url=https://web.archive.org/web/20230728055920/https://krishijagran.com/news/india-emerges-as-global-powerhouse-in-agrochemical-exports-setting-new-industry-standards/|url-status=live}}</ref> | ||
==== Defence sector ==== | ==== Defence sector ==== | ||
{{Main|Defence industry of India}} | {{Main|Defence industry of India}} | ||
[[File:Dhanush howitzer during Republic Day Parade 2017.jpg|thumb|[[Ashok Leyland FAT 6×6]] a defense truck for Indian Armed Force ]] | [[File:Dhanush howitzer during Republic Day Parade 2017.jpg|thumb|[[Ashok Leyland FAT 6×6]] a defense truck for Indian Armed Force ]] | ||
With strength of over 1.3 million active personnel, [[Indian Army]] is the [[List of countries by number of military and paramilitary personnel|third-largest military force and the largest volunteer army]]. Defence expenditure was pegged at US$70.12 billion for fiscal year 2022–23 and, increased 9.8% than previous fiscal year.<ref>{{cite web |url=https://www.indiabudget.gov.in/doc/eb/sumsbe.pdf|title=Ministry wise Summary of Budget Provisions, 2022–23|access-date=3 February 2022|website=Ministry of Finance, Government of India}}</ref> India is the world's second largest arms importer; between 2016 and 2020, it accounted for 9.5% of the total [[Arms industry|global arms imports]].<ref>{{cite web |last=Pandit |first=Rajat |date=16 March 2021 |title=India's weapon imports fell by 33% in last five years but remains world's second-largest arms importer |url=https://timesofindia.indiatimes.com/india/indias-weapon-imports-fell-by-33-in-last-five-years-but-remains-worlds-second-largest-arms-importer/articleshow/81516403.cms |access-date=2022-04-26 |website=The Times of India |language=en}}</ref> India exported military hardware worth {{INRConvert|159.2|b}} in the financial year 2022–23, the highest ever and a notable tenfold increase since 2016–17.<ref>{{cite web | url=https://www.hindustantimes.com/india-news/indias-defence-exports-hit-record-high-of-rs-15-920-crore-in-fy-2022-23-a-tenfold-increase-since-2016-17-thanks-to-make-in-india-reforms-101680344018909.html | title=India's defence exports reach ₹15,920 cr in 2022–23, tenfold jump in 6 years | date=April 2023 }}</ref> | With strength of over 1.3 million active personnel, [[Indian Army]] is the [[List of countries by number of military and paramilitary personnel|third-largest military force and the largest volunteer army]]. Defence expenditure was pegged at US$70.12 billion for fiscal year 2022–23 and, increased 9.8% than previous fiscal year.<ref>{{cite web|url=https://www.indiabudget.gov.in/doc/eb/sumsbe.pdf|title=Ministry wise Summary of Budget Provisions, 2022–23|access-date=3 February 2022|website=Ministry of Finance, Government of India|archive-date=2 February 2022|archive-url=https://web.archive.org/web/20220202221425/https://www.indiabudget.gov.in/doc/eb/sumsbe.pdf|url-status=live}}</ref> India is the world's second largest arms importer; between 2016 and 2020, it accounted for 9.5% of the total [[Arms industry|global arms imports]].<ref>{{cite web |last=Pandit |first=Rajat |date=16 March 2021 |title=India's weapon imports fell by 33% in last five years but remains world's second-largest arms importer |url=https://timesofindia.indiatimes.com/india/indias-weapon-imports-fell-by-33-in-last-five-years-but-remains-worlds-second-largest-arms-importer/articleshow/81516403.cms |access-date=2022-04-26 |website=The Times of India |language=en |archive-date=7 June 2023 |archive-url=https://web.archive.org/web/20230607130254/https://timesofindia.indiatimes.com/india/indias-weapon-imports-fell-by-33-in-last-five-years-but-remains-worlds-second-largest-arms-importer/articleshow/81516403.cms |url-status=live }}</ref> India exported military hardware worth {{INRConvert|159.2|b}} in the financial year 2022–23, the highest ever and a notable tenfold increase since 2016–17.<ref>{{cite web | url=https://www.hindustantimes.com/india-news/indias-defence-exports-hit-record-high-of-rs-15-920-crore-in-fy-2022-23-a-tenfold-increase-since-2016-17-thanks-to-make-in-india-reforms-101680344018909.html | title=India's defence exports reach ₹15,920 cr in 2022–23, tenfold jump in 6 years | date=April 2023 | access-date=13 April 2023 | archive-date=12 April 2023 | archive-url=https://web.archive.org/web/20230412145943/https://www.hindustantimes.com/india-news/indias-defence-exports-hit-record-high-of-rs-15-920-crore-in-fy-2022-23-a-tenfold-increase-since-2016-17-thanks-to-make-in-india-reforms-101680344018909.html | url-status=live }}</ref> | ||
==== | ==== Energy sector ==== | ||
{{Main|Electricity sector in India|Energy policy of India}} | {{Main|Electricity sector in India|Energy policy of India}} | ||
[[File:TPS_II,_Neyveli_NLCIL.jpg|thumb|an [[NLC India Limited|NLC India]] thermal power plant in [[Tamil Nadu]]]] | [[File:TPS_II,_Neyveli_NLCIL.jpg|thumb|an [[NLC India Limited|NLC India]] thermal power plant in [[Tamil Nadu]]]] | ||
[[File: | [[File:PHWR_under_Construction_at_Kakrapar_Gujarat_India.jpg|thumb|An [[IPHWR-700]] reactor undergoing construction in [[Kakrapar Atomic Power Station|Kakrapar Nuclear Plant]] started in 1984]] | ||
[[Primary energy]] consumption of India is the third-largest after China and US with 5.3% global share in the year 2015.<ref name="srwew">{{cite web|url=http://www.bp.com/content/dam/bp/pdf/energy-economics/statistical-review-2016/bp-statistical-review-of-world-energy-2016-india-insights.pdf|title=BP Statistical Review 2016|access-date=29 May 2016|archive-date=20 October 2016|archive-url=https://web.archive.org/web/20161020034026/http://www.bp.com/content/dam/bp/pdf/energy-economics/statistical-review-2016/bp-statistical-review-of-world-energy-2016-india-insights.pdf|url-status=dead}}</ref> Coal and crude oil together account for 85% of the primary energy consumption of India. India's [[oil reserves]] meet 25% of the country's domestic oil demand.<ref name="CIA">{{cite web| title=CIA – The World Factbook – India| publisher=CIA| date=20 September 2007| url =https://www.cia.gov/the-world-factbook/countries/india/| access-date =2 October 2007}}</ref><ref name="Datt-1">{{Harvnb|Datt|Sundharam|2009|p=104}}</ref> {{As of|2015|April|post=,}} India's total proven crude oil reserves are {{convert|763.476|Mt|e6LT e6ST|abbr=off}}, while gas reserves stood at {{convert|1490|e9m3|e12cuft|abbr=off}}.<ref name=png>{{cite web| title=Indian Petroleum & Natural Gas Statistics, 2014–15| url=http://petroleum.nic.in/docs/pngstat.pdf| access-date=19 January 2016| url-status=dead| archive-url=https://web.archive.org/web/20141205032742/http://petroleum.nic.in/docs/pngstat.pdf| archive-date=5 December 2014| df=dmy-all}}</ref> Oil and natural gas fields are located offshore at [[Ashoknagar Oil Field]], [[Bombay High]], [[Krishna Godavari Basin]], [[Mangala Area]] and the [[Cauvery Delta]], and onshore mainly in the states of [[West Bengal]], [[Assam]], Gujarat and [[Rajasthan]]. India is the fourth-largest consumer of oil and net oil imports were nearly {{INRConvert|8.2|t}} in 2014–15,<ref name=png /> which had an adverse effect on the country's [[current account deficit]]. The petroleum industry in India mostly consists of public sector companies such as [[Oil and Natural Gas Corporation]] (ONGC), [[Hindustan Petroleum Corporation Limited]] (HPCL), [[Bharat Petroleum Corporation Limited]] (BPCL) and Indian Oil Corporation Limited (IOCL). There are some major private Indian companies in the oil sector such as [[Reliance Industries Limited]] (RIL) which operates the world's largest oil refining complex.<ref>{{cite web|url=http://www.businessweek.com/news/2010-01-27/reliance-net-beats-estimate-after-boosting-natural-gas-sales.html |title=Reliance Net Beats Estimate After Boosting Natural Gas Sales |work=Bloomberg BusinessWeek |date=27 January 2010 |access-date=5 April 2010 |url-status=dead |archive-url=https://web.archive.org/web/20110915194809/http://www.businessweek.com/news/2010-01-27/reliance-net-beats-estimate-after-boosting-natural-gas-sales.html |archive-date=15 September 2011 }}</ref> | [[File:N.T.P.C_Simhadri_Super_Thermal_PowerPlant.jpg|thumb|[[BHEL]] designed [[Super thermal power station|super thermal power plant]] at [[Simhadri Super Thermal Power Station|Simhadri]] reduces carbon emission significantly]] | ||
[[Primary energy]] consumption of India is the third-largest after China and US with 5.3% global share in the year 2015.<ref name="srwew">{{cite web|url=http://www.bp.com/content/dam/bp/pdf/energy-economics/statistical-review-2016/bp-statistical-review-of-world-energy-2016-india-insights.pdf|title=BP Statistical Review 2016|access-date=29 May 2016|archive-date=20 October 2016|archive-url=https://web.archive.org/web/20161020034026/http://www.bp.com/content/dam/bp/pdf/energy-economics/statistical-review-2016/bp-statistical-review-of-world-energy-2016-india-insights.pdf|url-status=dead}}</ref> Coal and crude oil together account for 85% of the primary energy consumption of India. India's [[oil reserves]] meet 25% of the country's domestic oil demand.<ref name="CIA">{{cite web| title=CIA – The World Factbook – India| publisher=CIA| date=20 September 2007| url=https://www.cia.gov/the-world-factbook/countries/india/| access-date=2 October 2007| archive-date=18 March 2021| archive-url=https://web.archive.org/web/20210318202107/https://www.cia.gov/the-world-factbook/countries/india| url-status=live}}</ref><ref name="Datt-1">{{Harvnb|Datt|Sundharam|2009|p=104}}</ref> {{As of|2015|April|post=,}} India's total proven crude oil reserves are {{convert|763.476|Mt|e6LT e6ST|abbr=off}}, while gas reserves stood at {{convert|1490|e9m3|e12cuft|abbr=off}}.<ref name=png>{{cite web| title=Indian Petroleum & Natural Gas Statistics, 2014–15| url=http://petroleum.nic.in/docs/pngstat.pdf| access-date=19 January 2016| url-status=dead| archive-url=https://web.archive.org/web/20141205032742/http://petroleum.nic.in/docs/pngstat.pdf| archive-date=5 December 2014| df=dmy-all}}</ref> Oil and natural gas fields are located offshore at [[Ashoknagar Oil Field]], [[Bombay High]], [[Krishna Godavari Basin]], [[Mangala Area]] and the [[Cauvery Delta]], and onshore mainly in the states of [[West Bengal]], [[Assam]], Gujarat and [[Rajasthan]]. India is the fourth-largest consumer of oil and net oil imports were nearly {{INRConvert|8.2|t}} in 2014–15,<ref name=png /> which had an adverse effect on the country's [[current account deficit]]. The petroleum industry in India mostly consists of public sector companies such as [[Oil and Natural Gas Corporation]] (ONGC), [[Hindustan Petroleum Corporation Limited]] (HPCL), [[Bharat Petroleum Corporation Limited]] (BPCL) and Indian Oil Corporation Limited (IOCL). There are some major private Indian companies in the oil sector such as [[Reliance Industries Limited]] (RIL) which operates the world's largest oil refining complex.<ref>{{cite web|url=http://www.businessweek.com/news/2010-01-27/reliance-net-beats-estimate-after-boosting-natural-gas-sales.html |title=Reliance Net Beats Estimate After Boosting Natural Gas Sales |work=Bloomberg BusinessWeek |date=27 January 2010 |access-date=5 April 2010 |url-status=dead |archive-url=https://web.archive.org/web/20110915194809/http://www.businessweek.com/news/2010-01-27/reliance-net-beats-estimate-after-boosting-natural-gas-sales.html |archive-date=15 September 2011 }}</ref> | |||
India became the world's third-largest producer of electricity in 2013 with a 4.8% global share in electricity generation, surpassing Japan and Russia.<ref name="srwe">{{cite web | url=http://www.bp.com/content/dam/bp/pdf/energy-economics/statistical-review-2015/bp-statistical-review-of-world-energy-2015-electricity-section.pdf | title=BP Statistical Review of world electric energy, 2015 | access-date=17 June 2015 | url-status=dead | archive-url=https://web.archive.org/web/20150704145824/http://www.bp.com/content/dam/bp/pdf/Energy-economics/statistical-review-2015/bp-statistical-review-of-world-energy-2015-electricity-section.pdf | archive-date=4 July 2015 | df=dmy-all }}</ref> By the end of calendar year 2015, India had an electricity surplus with many power stations idling for want of demand.<ref>{{cite web |url=http://vidyutpravah.in/ |title=Vidyut Pravah – See FAQ section for more information |access-date=3 June 2016}}</ref> The utility electricity sector had an installed capacity of 303 [[Gigawatt|GW]] {{as of|2016|May|lc=y}} of which [[thermal power]] contributed 69.8%, [[hydroelectricity]] 15.2%, other sources of [[renewable energy]] 13.0%, and [[nuclear power]] 2.1%.<ref name="capacity">{{cite web | url=http://www.cea.nic.in/reports/monthly/installedcapacity/2016/installed_capacity-05.pdf | title=All India Installed Capacity (In MW) Of Power Stations | access-date=9 June 2016 | url-status=dead | archive-url=https://web.archive.org/web/20160705063841/http://www.cea.nic.in/reports/monthly/installedcapacity/2016/installed_capacity-05.pdf | archive-date=5 July 2016 | df=dmy-all }}</ref> India meets most of its domestic electricity demand through its {{convert|106|Gt|e9LT e9ST|abbr=off}} of proven coal reserves.<ref>{{cite web|url=http://www.coal.nic.in/reserve2.htm |title=Inventory of Coal Resources of India |publisher=Ministry of Coal, Government of India |access-date=18 November 2010 |url-status=dead |archive-url=https://web.archive.org/web/20100419020324/http://www.coal.nic.in/reserve2.htm |archive-date=19 April 2010 }}</ref> India is also rich in certain alternative [[Energy policy of India|sources of energy]] with significant future potential such as [[Solar power in India|solar]], [[Wind power in India|wind]] and [[Biofuel in India|biofuels]] ([[jatropha]], sugarcane). India's dwindling uranium reserves stagnated the growth of nuclear energy in the country for many years.<ref>{{cite news|url=http://www.livemint.com/2008/06/30222448/Uranium-shortage-holding-back.html |title=Uranium shortage holding back India's nuclear power drive |newspaper=Mint |date=30 June 2008 |access-date=5 April 2010}}</ref> Recent discoveries in the [[Tummalapalle uranium mine|Tummalapalle]] belt may be among the top 20 natural uranium reserves worldwide,<ref>{{cite news| url=http://www.thehindu.com/news/states/andhra-pradesh/article1554078.ece| location=Chennai, India| work=The Hindu| first=T. S.| last=Subramanian| title=Massive uranium deposits found in Andhra Pradesh| date=20 March 2011| access-date=19 February 2014| archive-url=https://web.archive.org/web/20121024220949/http://www.thehindu.com/news/states/andhra-pradesh/article1554078.ece| archive-date=24 October 2012| url-status=dead}}</ref><ref>{{cite news| url=http://www.ibtimes.com/massive-uranium-deposit-found-andhra-pradesh-india-299977| location=US| work=International Business Times| first=Monami| last=Thakur| title=Massive uranium deposits found in Andhra Pradesh| date=19 July 2011}}</ref><ref>{{cite news| url=https://www.telegraph.co.uk/news/worldnews/asia/india/8647745/Largest-uranium-reserves-found-in-India.html |archive-url=https://ghostarchive.org/archive/20220110/https://www.telegraph.co.uk/news/worldnews/asia/india/8647745/Largest-uranium-reserves-found-in-India.html |archive-date=10 January 2022 |url-access=subscription |url-status=live| location=New Delhi, India| work=The Telegraph| first=Rahul| last=Bedi| title=Largest uranium reserves found in India| date=19 July 2011}}{{cbignore}}</ref>{{update inline|date=June 2017|reason=2011 speculative data, should have better information by now}} and an estimated reserve of {{convert|846477|t}} of [[thorium]]<ref name=pib>{{cite news|title=Availability of Thorium |url=http://pib.nic.in/newsite/erelease.aspx?relid=74293|publisher=Press Information Bureau, Government of India|access-date=27 March 2012|date=10 August 2011}}</ref> – about 25% of world's reserves – are expected to fuel the country's ambitious [[nuclear power in India|nuclear energy program]] in the long-run. The [[India–United States Civil Nuclear Agreement|Indo-US nuclear deal]] has also paved the way for India to import uranium from other countries.<ref>{{cite news|url=http://www.livemint.com/2008/10/09005930/Bush-signs-IndiaUS-nuclear-de.html|title=Bush signs India-US nuclear deal into law |newspaper=Mint |date=9 October 2008 |access-date=5 April 2010}}</ref> | India became the world's third-largest producer of electricity in 2013 with a 4.8% global share in electricity generation, surpassing Japan and Russia.<ref name="srwe">{{cite web | url=http://www.bp.com/content/dam/bp/pdf/energy-economics/statistical-review-2015/bp-statistical-review-of-world-energy-2015-electricity-section.pdf | title=BP Statistical Review of world electric energy, 2015 | access-date=17 June 2015 | url-status=dead | archive-url=https://web.archive.org/web/20150704145824/http://www.bp.com/content/dam/bp/pdf/Energy-economics/statistical-review-2015/bp-statistical-review-of-world-energy-2015-electricity-section.pdf | archive-date=4 July 2015 | df=dmy-all }}</ref> By the end of calendar year 2015, India had an electricity surplus with many power stations idling for want of demand.<ref>{{cite web |url=http://vidyutpravah.in/ |title=Vidyut Pravah – See FAQ section for more information |access-date=3 June 2016 |archive-date=13 October 2016 |archive-url=https://web.archive.org/web/20161013060025/http://www.vidyutpravah.in/ |url-status=dead }}</ref> The utility electricity sector had an installed capacity of 303 [[Gigawatt|GW]] {{as of|2016|May|lc=y}} of which [[thermal power]] contributed 69.8%, [[hydroelectricity]] 15.2%, other sources of [[renewable energy]] 13.0%, and [[nuclear power]] 2.1%.<ref name="capacity">{{cite web | url=http://www.cea.nic.in/reports/monthly/installedcapacity/2016/installed_capacity-05.pdf | title=All India Installed Capacity (In MW) Of Power Stations | access-date=9 June 2016 | url-status=dead | archive-url=https://web.archive.org/web/20160705063841/http://www.cea.nic.in/reports/monthly/installedcapacity/2016/installed_capacity-05.pdf | archive-date=5 July 2016 | df=dmy-all }}</ref> India meets most of its domestic electricity demand through its {{convert|106|Gt|e9LT e9ST|abbr=off}} of proven coal reserves.<ref>{{cite web|url=http://www.coal.nic.in/reserve2.htm |title=Inventory of Coal Resources of India |publisher=Ministry of Coal, Government of India |access-date=18 November 2010 |url-status=dead |archive-url=https://web.archive.org/web/20100419020324/http://www.coal.nic.in/reserve2.htm |archive-date=19 April 2010 }}</ref> India is also rich in certain alternative [[Energy policy of India|sources of energy]] with significant future potential such as [[Solar power in India|solar]], [[Wind power in India|wind]] and [[Biofuel in India|biofuels]] ([[jatropha]], sugarcane). India's dwindling uranium reserves stagnated the growth of nuclear energy in the country for many years.<ref>{{cite news |url=http://www.livemint.com/2008/06/30222448/Uranium-shortage-holding-back.html |title=Uranium shortage holding back India's nuclear power drive |newspaper=Mint |date=30 June 2008 |access-date=5 April 2010 |archive-date=3 December 2010 |archive-url=https://web.archive.org/web/20101203021707/http://www.livemint.com/2008/06/30222448/Uranium-shortage-holding-back.html |url-status=live }}</ref> Recent discoveries in the [[Tummalapalle uranium mine|Tummalapalle]] belt may be among the top 20 natural uranium reserves worldwide,<ref>{{cite news| url=http://www.thehindu.com/news/states/andhra-pradesh/article1554078.ece| location=Chennai, India| work=The Hindu| first=T. S.| last=Subramanian| title=Massive uranium deposits found in Andhra Pradesh| date=20 March 2011| access-date=19 February 2014| archive-url=https://web.archive.org/web/20121024220949/http://www.thehindu.com/news/states/andhra-pradesh/article1554078.ece| archive-date=24 October 2012| url-status=dead}}</ref><ref>{{cite news| url=http://www.ibtimes.com/massive-uranium-deposit-found-andhra-pradesh-india-299977| location=US| work=International Business Times| first=Monami| last=Thakur| title=Massive uranium deposits found in Andhra Pradesh| date=19 July 2011| access-date=19 February 2014| archive-date=18 October 2017| archive-url=https://web.archive.org/web/20171018072600/http://www.ibtimes.com/massive-uranium-deposit-found-andhra-pradesh-india-299977| url-status=live}}</ref><ref>{{cite news| url=https://www.telegraph.co.uk/news/worldnews/asia/india/8647745/Largest-uranium-reserves-found-in-India.html |archive-url=https://ghostarchive.org/archive/20220110/https://www.telegraph.co.uk/news/worldnews/asia/india/8647745/Largest-uranium-reserves-found-in-India.html |archive-date=10 January 2022 |url-access=subscription |url-status=live| location=New Delhi, India| work=The Telegraph| first=Rahul| last=Bedi| title=Largest uranium reserves found in India| date=19 July 2011}}{{cbignore}}</ref>{{update inline|date=June 2017|reason=2011 speculative data, should have better information by now}} and an estimated reserve of {{convert|846477|t}} of [[thorium]]<ref name=pib>{{cite news|title=Availability of Thorium|url=http://pib.nic.in/newsite/erelease.aspx?relid=74293|publisher=Press Information Bureau, Government of India|access-date=27 March 2012|date=10 August 2011|archive-date=10 September 2012|archive-url=https://web.archive.org/web/20120910065608/http://pib.nic.in/newsite/erelease.aspx?relid=74293|url-status=live}}</ref> – about 25% of world's reserves – are expected to fuel the country's ambitious [[nuclear power in India|nuclear energy program]] in the long-run. The [[India–United States Civil Nuclear Agreement|Indo-US nuclear deal]] has also paved the way for India to import uranium from other countries.<ref>{{cite news |url=http://www.livemint.com/2008/10/09005930/Bush-signs-IndiaUS-nuclear-de.html |title=Bush signs India-US nuclear deal into law |newspaper=Mint |date=9 October 2008 |access-date=5 April 2010 |archive-date=20 July 2020 |archive-url=https://web.archive.org/web/20200720040118/https://www.livemint.com/2008/10/09005930/bush-signs-indiaus-nuclear-de.html |url-status=live }}</ref> | ||
==== Transport sector ==== | ==== Transport sector ==== | ||
{{See also|Indian Railways|Multiple units of India|Vande Bharat Express}} | {{See also|Indian Railways|Multiple units of India|Vande Bharat Express}} | ||
[[File: | [[File:Vizag-Secunderabad_Vande_Bharat_Express.jpg|thumb| [[Vande Bharat Express]] train ]] | ||
[[File:EqajJS VEAAuOzX.jpg|thumb|[[Dedicated Freight Corridor Corporation of India|DFCCIL]] maintains [[Dedicated freight corridors in India|Dedicated freight corridors]] rail tracks]] | [[File:EqajJS VEAAuOzX.jpg|thumb|[[Dedicated Freight Corridor Corporation of India|DFCCIL]] maintains [[Dedicated freight corridors in India|Dedicated freight corridors]] rail tracks]] | ||
[[File: | [[File:Navi-Mumbai-Metro1.jpg|thumb|[[Navi Mumbai Metro]]]] | ||
[[File:Namo_Bharat_Trains_together.jpg|thumb|[[RapidX]] trains at depot]] | |||
Indian Railways | The [[Indian Railways]] contributes to ~3% of the country's gross domestic product (GDP) and has social obligations pegged at $5.3 Billion annually. Indian Railways revenue has grown at 5% CAGR in the past 5 years but profitability has reduced drastically in the past 4 years, due to growing infrastructure and modernization expenses. With a workforce of 1.31 million people, the IR is also one of the country's largest employers. The railways is a major contributor to jobs, GDP, and mobility. | ||
Indian Railways has decided to revise its 2022–23 rolling stock production plan upwards. The Ministry's new plan targets the production of 8,429 units for the coming financial year. Production for 2022–23 has been raised by 878 units from the earlier planned 7,551, according to the revised targets.<ref>{{Cite web |last=News Desk |first=RailPost |date=22 February 2022 |title=Indian Railways Revises FY23 Rolling Stock Production Plan, Will Boost Output To 8,000+ Coaches |url=https://www.railpost.in/indian-railways-revises-fy23-rolling-stock-production-plan-will-boost-output-to-8000-coaches/ |access-date=11 July 2023 |website=RailPost.in |archive-date=11 July 2023 |archive-url=https://web.archive.org/web/20230711073050/https://www.railpost.in/indian-railways-revises-fy23-rolling-stock-production-plan-will-boost-output-to-8000-coaches/ |url-status=live }}</ref> Indian Railways has targeted to manufacture 475 new [[Vande Bharat (trainset)|Vande Bharat]] trainsets for the next four years as a part of its modernization plan.<ref>{{cite web | url=https://www.fortuneindia.com/long-reads/race-on-to-meet-vande-bharat-targets/111842 | title=Race on to Meet Vande Bharat Targets | date=10 March 2023 | access-date=23 June 2023 | archive-date=23 June 2023 | archive-url=https://web.archive.org/web/20230623081959/https://www.fortuneindia.com/long-reads/race-on-to-meet-vande-bharat-targets/111842 | url-status=live }}</ref> It is about Rs 40,000 crore(5 billion $) business opportunity that would also create 15,000 jobs and several spin -off benefits.<ref>{{Cite web |url=https://economictimes.indiatimes.com/industry/transportation/railways/400-vande-bharat-trains-rs-40000-crore-business-opportunity-and-jobs/articleshow/89318126.cms?from=mdr |title=Archived copy |access-date=25 September 2023 |archive-date=29 September 2023 |archive-url=https://web.archive.org/web/20230929003107/https://economictimes.indiatimes.com/industry/transportation/railways/400-vande-bharat-trains-rs-40000-crore-business-opportunity-and-jobs/articleshow/89318126.cms?from=mdr |url-status=live }}</ref> [[Central Organisation for Railway Electrification|Indian Railway's CORE]] aims to electrify all of its broad gauge network by 31 March 2024.<ref>{{Cite news |title=Mission Electrification to save railways power bill by Rs 10K crore |url=http://www.newindianexpress.com/nation/2016/nov/04/mission-electrification-to-save-railways-power-bill-by-rs-10k-crore-1534699.html |publisher=[[The New Indian Express]] |date=2016-11-04 |access-date=2023-04-18 |archive-date=11 April 2023 |archive-url=https://web.archive.org/web/20230411114300/https://www.newindianexpress.com/nation/2016/nov/04/mission-electrification-to-save-railways-power-bill-by-rs-10k-crore-1534699.html |url-status=live }}</ref> The entire electrified mainline rail network in India uses [[25 kV AC railway electrification|25 kV AC]]; DC is used only for [[Urban rail transit in India|metros]].As of July 2023, India currently has 90% of total train tracks fully electrified.<ref>{{cite web | url=https://www.livemint.com/news/india/railways-on-track-to-meet-target-of-100-electrification-by-dec-11690543908598.html | title=Railways on track to meet target of 100% electrification by Dec | access-date=4 October 2023 | archive-date=6 October 2023 | archive-url=https://web.archive.org/web/20231006060956/https://www.livemint.com/news/india/railways-on-track-to-meet-target-of-100-electrification-by-dec-11690543908598.html | url-status=live }}</ref> | |||
India is developing modern [[public transport|mass rapid transit]] systems to meet present and future urban requirements. A modern metro rail system is already in place in the cities of [[Delhi Metro|Delhi]], [[Mumbai Metro|Mumbai]], [[Bangalore Metro|Bangalore]], [[Kolkata Metro|Kolkata]], [[Hyderabad Metro|Hyderabad]], [[Kochi Metro|Kochi]], [[Rapid Metro Gurgaon|Gurgaon]], [[Jaipur Metro|Jaipur]], [[Noida Metro|Noida]], [[Pune Metro|Pune]], [[Nagpur Metro|Nagpur]], [[Kanpur Metro|Kanpur]], [[Ahmedabad Metro|Ahmedabad]] and [[Lucknow Metro|Lucknow]]. Similar mass transit systems are intended for [[Agra]], [[Bhopal]], [[ | Under the eleventh Five Year Plan of India (2007–12), the [[Ministry of Railways (India)|Ministry of Railways]] started constructing a new [[Dedicated freight corridors in India|Dedicated Freight Corridor]] (DFC) in two long routes, namely the [[Eastern Dedicated Freight Corridor|Eastern]] and [[Western Dedicated Freight Corridor|Western]] freight corridors.<ref>{{cite web|title=DFC – as revolutionary as the Golden Quadrilateral|url=http://www.indianrailways.gov.in/Railways%20report%20-%208%20Jan%202016.pdf|website=Indian Railways|access-date=13 September 2016|archive-date=6 March 2016|archive-url=https://web.archive.org/web/20160306090559/http://www.indianrailways.gov.in/Railways%20report%20-%208%20Jan%202016.pdf|url-status=live}}</ref> The two routes cover a total length of {{Convert|3260|km|mi}}, with the ''Eastern Dedicated Freight Corridor'' stretching from [[Ludhiana]] in [[Punjab, India|Punjab]] to [[Dankuni railway station|Dankuni]] in [[West Bengal]] and the ''Western Dedicated Freight Corridor'' from [[Jawaharlal Nehru Port]] in [[Mumbai]] ([[Maharashtra]]) to [[Dadri]] in [[Uttar Pradesh]].<ref name="dfc">{{cite web|title=Dedicated Freight Corridors: Paradigm Shift Coming in Indian Railways' Freight Operations|url=http://pib.nic.in/newsite/efeatures.aspx?relid=134359|website=Press Information Bureau|access-date=13 September 2016|archive-date=3 January 2017|archive-url=https://web.archive.org/web/20170103085626/http://pib.nic.in/newsite/efeatures.aspx?relid=134359|url-status=live}}</ref> The DFC will generate around 42,000 jobs and provide long term employment to many people in public sector and private sector. | ||
Former Prime Minister [[Atal Bihari Vajpayee]] has been credited with success of the metro systems in India and every metro has followed [[Delhi Metro]] model generating lot of real estate wealth in India specially in smaller cities like [[Gurgaon]] and [[Noida]].For Elevated corridor, there is no need for land acquisition as pillars are built above [[Median strip]] of a road.<ref>{{Cite web|url=https://www.factchecker.in/fact-check/did-atal-bihari-vajpayee-first-launch-the-delhi-metro--708421|title=Did Atal Bihari Vajpayee First Launch The Delhi Metro ?|first=Nidhi|last=Jacob|date=31 December 2020|website=factchecker.in}}</ref> Land prices in tier-II cities such as Lucknow, Patna, Jaipur, Ahmedabad, Pune, Kochi, and Coimbatore have gone up by almost 8-10 percent following the introduction of a metro corridor in these cities, an assessment by JLL has said.<ref>{{cite web | url=https://www.moneycontrol.com/news/business/real-estate/metro-corridors-in-tier-ii-cities-led-to-8-10-increase-in-land-prices-jll-8745311.html | title=Metro corridors in tier-II cities led to 8-10% increase in land prices: JLL | date=27 June 2022 }}</ref> | |||
India is developing modern [[public transport|mass rapid transit]] systems to meet present and future urban requirements. A modern metro rail system is already in place in the cities of [[Delhi Metro|Delhi]], [[Mumbai Metro|Mumbai]], [[Bangalore Metro|Bangalore]], [[Kolkata Metro|Kolkata]], [[Hyderabad Metro|Hyderabad]], [[Kochi Metro|Kochi]], [[Rapid Metro Gurgaon|Gurgaon]], [[Jaipur Metro|Jaipur]], [[Noida Metro|Noida]], [[Pune Metro|Pune]], [[Nagpur Metro|Nagpur]], [[Kanpur Metro|Kanpur]], [[Ahmedabad Metro|Ahmedabad]] and [[Lucknow Metro|Lucknow]]. Similar mass transit systems are intended for [[Agra]], [[Bhopal]], [[Indore]], [[Surat]], [[Patna]], [[Bhubaneswar|Bhubaneswar Tri-city]] , [[Chandigarh|Chandigarh Tri-city]], [[Greater Gwalior Metro|Gwalior]], [[Mysore]], [[Nashik Metro|Nashik]], [[Allahabad Metro|Prayagraj]], [[Varanasi Metro|Varanasi]], [[Ranchi]], [[Thane]], [[Trivandrum]] and [[Navi Mumbai]]. | |||
Former Prime Minister [[Atal Bihari Vajpayee]] has been credited with success of the metro systems in India and every metro has followed [[Delhi Metro]] model generating lot of real estate wealth in India specially in smaller cities like [[Gurgaon]] and [[Noida]]. For Elevated corridor, there is no need for land acquisition as pillars are built above [[Median strip]] of a road.<ref>{{Cite web|url=https://www.factchecker.in/fact-check/did-atal-bihari-vajpayee-first-launch-the-delhi-metro--708421|title=Did Atal Bihari Vajpayee First Launch The Delhi Metro ?|first=Nidhi|last=Jacob|date=31 December 2020|website=factchecker.in|access-date=3 July 2023|archive-date=3 July 2023|archive-url=https://web.archive.org/web/20230703161535/https://www.factchecker.in/fact-check/did-atal-bihari-vajpayee-first-launch-the-delhi-metro--708421|url-status=live}}</ref> Land prices in tier-II cities such as Lucknow, Patna, Jaipur, Ahmedabad, Pune, Kochi, and Coimbatore have gone up by almost 8-10 percent following the introduction of a metro corridor in these cities, an assessment by JLL has said.<ref>{{cite web | url=https://www.moneycontrol.com/news/business/real-estate/metro-corridors-in-tier-ii-cities-led-to-8-10-increase-in-land-prices-jll-8745311.html | title=Metro corridors in tier-II cities led to 8-10% increase in land prices: JLL | date=27 June 2022 | access-date=23 June 2023 | archive-date=16 April 2023 | archive-url=https://web.archive.org/web/20230416110559/https://www.moneycontrol.com/news/business/real-estate/metro-corridors-in-tier-ii-cities-led-to-8-10-increase-in-land-prices-jll-8745311.html | url-status=live }}</ref> | |||
India is also developing modern [[Delhi–Meerut Regional Rapid Transit System|RRTS]] system to replace the old [[Chennai Mass Rapid Transit System|MRTS]] system which will provide connectivity in [[National Capital Region (India)|Delhi Metropolitan Area]] and [[Mumbai Metropolitan Region]] which will serve the suburbs of these big cities at 80–100 km of distance from city center. | India is also developing modern [[Delhi–Meerut Regional Rapid Transit System|RRTS]] system to replace the old [[Chennai Mass Rapid Transit System|MRTS]] system which will provide connectivity in [[National Capital Region (India)|Delhi Metropolitan Area]] and [[Mumbai Metropolitan Region]] which will serve the suburbs of these big cities at 80–100 km of distance from city center. | ||
[[File:WAG-11.jpg|thumb|Indigenously developed 12,000 hp electric [[Indian locomotive class WAG-11|WAG-11]] locomotive by [[RDSO]] ]] | |||
==== Engineering ==== | ==== Engineering ==== | ||
{{See also|Automotive industry in India|Electronics and semiconductor manufacturing industry in India}} | {{See also|Automotive industry in India|Electronics and semiconductor manufacturing industry in India}} | ||
[[File:2020 Tata Nexon EV (India) front view.png|left | [[File:2020 Tata Nexon EV (India) front view.png|left|thumb|[[Tata Nexon]] EV is made in India]] | ||
[[File:MakeInIndia-BEML-205-Dumper.jpg|right | [[File:MakeInIndia-BEML-205-Dumper.jpg|right|thumb|Electric dump truck under Make in India]] | ||
Engineering is the largest sub-sector of India's industrial sector, by GDP, and the third-largest by exports.<ref>[http://www.ibef.org/industry/engineering-india.aspx Engineering industry of India] IBEF, Ministry of Commerce and Industry, Government of India (April 2014)</ref> It includes transport equipment, machine tools, capital goods, transformers, switchgear, furnaces, and cast and forged parts for turbines, automobiles, and railways. The industry employs about 4 million workers. On a value-added basis, India's engineering subsector exported $67 billion worth of engineering goods in the 2013–14 fiscal year, and served part of the domestic demand for engineering goods.<ref>{{cite news|url=http://www.financialexpress.com/news/making-a-case-for-higher-engineering-exports/1273068|title=Making a case for higher engineering exports|work=The Financial Express|date=24 July 2014}}</ref> | Engineering is the largest sub-sector of India's industrial sector, by GDP, and the third-largest by exports.<ref>[http://www.ibef.org/industry/engineering-india.aspx Engineering industry of India] {{Webarchive|url=https://web.archive.org/web/20140715121032/http://www.ibef.org/industry/engineering-india.aspx |date=15 July 2014 }} IBEF, Ministry of Commerce and Industry, Government of India (April 2014)</ref> It includes transport equipment, machine tools, capital goods, transformers, switchgear, furnaces, and cast and forged parts for turbines, automobiles, and railways. The industry employs about 4 million workers. On a value-added basis, India's engineering subsector exported $67 billion worth of engineering goods in the 2013–14 fiscal year, and served part of the domestic demand for engineering goods.<ref>{{cite news|url=http://www.financialexpress.com/news/making-a-case-for-higher-engineering-exports/1273068|title=Making a case for higher engineering exports|work=The Financial Express|date=24 July 2014|access-date=25 July 2014|archive-date=6 August 2014|archive-url=https://archive.today/20140806061701/http://www.financialexpress.com/news/making-a-case-for-higher-engineering-exports/1273068|url-status=live}}</ref> | ||
As of 2023, India is the ''3rd largest [[Automotive industry in India|automotive]] market'' in the world in terms of sales.<ref>{{Cite web |last=www.ETAuto.com |title=India surpasses Japan to become 3rd largest auto market globally, Auto News, ET Auto |url=https://auto.economictimes.indiatimes.com/news/industry/india-surpasses-japan-to-become-3rd-largest-auto-market-globally/96786895 |access-date=2023-01-11 |website=ETAuto.com |language=en}}</ref> | As of 2023, India is the ''3rd largest [[Automotive industry in India|automotive]] market'' in the world in terms of sales.<ref>{{Cite web |last=www.ETAuto.com |title=India surpasses Japan to become 3rd largest auto market globally, Auto News, ET Auto |url=https://auto.economictimes.indiatimes.com/news/industry/india-surpasses-japan-to-become-3rd-largest-auto-market-globally/96786895 |access-date=2023-01-11 |website=ETAuto.com |language=en |archive-date=29 May 2023 |archive-url=https://web.archive.org/web/20230529014040/https://auto.economictimes.indiatimes.com/news/industry/india-surpasses-japan-to-become-3rd-largest-auto-market-globally/96786895 |url-status=live }}</ref> | ||
The Indian automobile industry is the world's [[List of countries by motor vehicle production|fourth-largest by production]].<ref>[http://www.oica.net/category/production-statistics/2018-statistics/ 2018 Production Statistics], Organisation Internationale des Constructeurs d'Automobiles</ref><ref>{{cite web|url=https://www.ibef.org/industry/india-automobiles.aspx|title=Automobile Industry in India, Indian Automobile Industry, Sector, Trends, Statistics|website=www.ibef.org}}</ref> | The Indian automobile industry is the world's [[List of countries by motor vehicle production|fourth-largest by production]].<ref>[http://www.oica.net/category/production-statistics/2018-statistics/ 2018 Production Statistics] {{Webarchive|url=https://web.archive.org/web/20201202155703/http://www.oica.net/category/production-statistics/2018-statistics/ |date=2 December 2020 }}, Organisation Internationale des Constructeurs d'Automobiles</ref><ref>{{cite web|url=https://www.ibef.org/industry/india-automobiles.aspx|title=Automobile Industry in India, Indian Automobile Industry, Sector, Trends, Statistics|website=www.ibef.org|access-date=30 August 2019|archive-date=24 February 2021|archive-url=https://web.archive.org/web/20210224174120/https://www.ibef.org/industry/india-automobiles.aspx|url-status=live}}</ref> | ||
[[File:Mumbai Metro at Gundavali Station.jpg|thumb|right|[[BEML]] rolling stock for [[Line 2 (Mumbai Metro)|Mumbai Yellow Line]]]] | [[File:Mumbai Metro at Gundavali Station.jpg|thumb|right|[[BEML]] rolling stock for [[Line 2 (Mumbai Metro)|Mumbai Yellow Line]]]] | ||
The engineering industry of India includes its growing car, trainsets, rail wagons, motorcycle and scooters industry, and productivity machinery such as [[steel mill|steel equipment]], [[nuclear power|nuclear equipment]], [[Power shovel|shovel]], [[dump trucks]], [[tractor]]s. India manufactured and assembled about 18 million passenger and utility vehicles in 2011, of which 2.3 million were exported.<ref name=itengg /> Indian Railways has made a new record of manufacturing 10,000 coaches for both domestic and export purposes.<ref>{{cite web | url=https://www.etnownews.com/companies/indian-railways-modern-rail-coach-factory-raebareli-sets-record-of-manufacturing-10000-coaches-pm-modi-lauds-milestone-article-100012654 | title=Indian Railways' MCF, Raebareli sets record of manufacturing 10,000 coaches; PM Modi lauds milestone | date=5 May 2023 }}</ref> India is the largest producer and the largest market for tractors, accounting for 29% of global tractor production in 2013.<ref name=itengg>[http://www.ct.camcom.gov.it/documenti/internazionalizzazione/consorzio/ENGINEERING_INDUSTRY_IN_INDIA.pdf Engineering industry of India] {{Webarchive|url=https://web.archive.org/web/20140728035535/http://www.ct.camcom.gov.it/documenti/internazionalizzazione/consorzio/ENGINEERING_INDUSTRY_IN_INDIA.pdf |date=28 July 2014 }} MECCANICA AND BENI STRUMENTALI, Government of Italy (2013)</ref><ref>[http://www.aem.org/News/Advisors/AEM/?HL=Global_Tractor_Market_Analysis_Available_to_AEM_Members_from_Agrievolution_Alliance&A=1292 Global Tractor Market Analysis Available to AEM Members from Agrievolution Alliance] Association of Equipment Manufacturers, Milwaukee, Wisconsin, US (2014)</ref> India is the 12th-largest producer and 7th-largest consumer of machine tools.<ref name=itengg /> | The engineering industry of India includes its growing car, trainsets, rail wagons, motorcycle and scooters industry, and productivity machinery such as [[steel mill|steel equipment]], [[nuclear power|nuclear equipment]], [[Power shovel|shovel]], [[dump trucks]], [[tractor]]s. India manufactured and assembled about 18 million passenger and utility vehicles in 2011, of which 2.3 million were exported.<ref name=itengg /> Indian Railways has made a new record of manufacturing 10,000 coaches for both domestic and export purposes.<ref>{{cite web | url=https://www.etnownews.com/companies/indian-railways-modern-rail-coach-factory-raebareli-sets-record-of-manufacturing-10000-coaches-pm-modi-lauds-milestone-article-100012654 | title=Indian Railways' MCF, Raebareli sets record of manufacturing 10,000 coaches; PM Modi lauds milestone | date=5 May 2023 | access-date=23 June 2023 | archive-date=23 June 2023 | archive-url=https://web.archive.org/web/20230623091151/https://www.etnownews.com/companies/indian-railways-modern-rail-coach-factory-raebareli-sets-record-of-manufacturing-10000-coaches-pm-modi-lauds-milestone-article-100012654 | url-status=live }}</ref> India is the largest producer and the largest market for tractors, accounting for 29% of global tractor production in 2013.<ref name=itengg>[http://www.ct.camcom.gov.it/documenti/internazionalizzazione/consorzio/ENGINEERING_INDUSTRY_IN_INDIA.pdf Engineering industry of India] {{Webarchive|url=https://web.archive.org/web/20140728035535/http://www.ct.camcom.gov.it/documenti/internazionalizzazione/consorzio/ENGINEERING_INDUSTRY_IN_INDIA.pdf |date=28 July 2014 }} MECCANICA AND BENI STRUMENTALI, Government of Italy (2013)</ref><ref>[http://www.aem.org/News/Advisors/AEM/?HL=Global_Tractor_Market_Analysis_Available_to_AEM_Members_from_Agrievolution_Alliance&A=1292 Global Tractor Market Analysis Available to AEM Members from Agrievolution Alliance] {{Webarchive|url=https://web.archive.org/web/20151208233236/http://www.aem.org/News/Advisors/AEM/?HL=Global_Tractor_Market_Analysis_Available_to_AEM_Members_from_Agrievolution_Alliance&A=1292 |date=8 December 2015 }} Association of Equipment Manufacturers, Milwaukee, Wisconsin, US (2014)</ref> India is the 12th-largest producer and 7th-largest consumer of machine tools.<ref name=itengg /> | ||
The rolling stock market in India will be worth 4 billion $ approx. in 2023 will reach 5 billion $ in 2025.The automotive manufacturing industry contributed $79 billion (4% of GDP) and employed 6.76 million people (2% of the workforce) in 2016.<ref name="WTTCBenchmark" /> | The rolling stock market in India will be worth 4 billion $ approx. in 2023 will reach 5 billion $ in 2025.The automotive manufacturing industry contributed $79 billion (4% of GDP) and employed 6.76 million people (2% of the workforce) in 2016.<ref name="WTTCBenchmark" /> | ||
| Line 853: | Line 857: | ||
==== Iron and steel ==== | ==== Iron and steel ==== | ||
{{Main|Iron and steel industry in India}} | {{Main|Iron and steel industry in India}} | ||
[[File:Steel Plant, Bokaro Steel City.jpg|right|thumb|[[Bokaro Steel Plant]](BSL) alone contributes 45% of [[Steel Authority of India|SAIL]]'s profit and it produces highly diversified steel portfolio]] | [[File:Steel Plant, Bokaro Steel City.jpg|right|thumb|[[Bokaro Steel Plant]] (BSL) alone contributes 45% of [[Steel Authority of India|SAIL]]'s profit and it produces highly diversified steel portfolio]] | ||
[[File:MSTC HQ NewTown Kolkata.jpg|thumb|[[MSTC Limited]] Kolkata HQ, a Metal trading e-commerce company]] | [[File:MSTC HQ NewTown Kolkata.jpg|thumb|[[MSTC Limited]] Kolkata HQ, a Metal trading e-commerce company]] | ||
India surpassed Japan as the second largest steel producer in January 2019.<ref>{{cite web | url=https://auto.economictimes.indiatimes.com/news/auto-components/india-replaces-japan-as-second-top-steel-producer-worldsteel/67725232 | title=India replaces Japan as second top steel producer: Worldsteel – ET Auto }}</ref> As per worldsteel, India's crude steel production in 2018 was at {{convert|106.5|t}}, 4.9% increase from {{convert|101.5|t}} in 2017, which means that India overtook Japan as the world's second largest steel production country. | India surpassed Japan as the second largest steel producer in January 2019.<ref>{{cite web | url=https://auto.economictimes.indiatimes.com/news/auto-components/india-replaces-japan-as-second-top-steel-producer-worldsteel/67725232 | title=India replaces Japan as second top steel producer: Worldsteel – ET Auto | access-date=13 April 2023 | archive-date=11 April 2023 | archive-url=https://web.archive.org/web/20230411131644/https://auto.economictimes.indiatimes.com/news/auto-components/india-replaces-japan-as-second-top-steel-producer-worldsteel/67725232 | url-status=live }}</ref> As per worldsteel, India's crude steel production in 2018 was at {{convert|106.5|t}}, 4.9% increase from {{convert|101.5|t}} in 2017, which means that India overtook Japan as the world's second largest steel production country. | ||
According to data presented by PIB(FY2021-22), there are more than 900 steel plants in India that produce crude steel. These are owned by PSUs, large-scale companies as well as small and medium enterprises (SMEs). In the year 2021-22, the total capacity of these plants stood at 154.06 million tonnes.<ref>{{Cite web |url=https://pib.gov.in/PressReleaseIframePage.aspx?PRID=1907151 |title=Archived copy |access-date=16 October 2023 |archive-date=1 June 2023 |archive-url=https://web.archive.org/web/20230601212943/https://pib.gov.in/PressReleaseIframePage.aspx?PRID=1907151 |url-status=live }}</ref> | |||
Steel | India plans to build 12 new steel plants with a capacity of {{convert|60|Mt|e6LT e6ST|abbr=off}} per year. Indian Ministry of Steel instructed [[public sector]] integrated steel plants to increase capacity by at least 80%, to {{convert|45|Mt|e6LT e6ST|abbr=off}} per year by 2030. The current capacity is {{convert|25|Mt|e6LT e6ST|abbr=off}} per year.<ref>{{cite web | url=https://gmk.center/en/news/india-plans-to-build-12-steel-plants-with-a-capacity-of-60-million-tons-per-year/ | title=India wants to build 12 new steel plants — News — GMK Center | access-date=13 April 2023 | archive-date=12 April 2023 | archive-url=https://web.archive.org/web/20230412075941/https://gmk.center/en/news/india-plans-to-build-12-steel-plants-with-a-capacity-of-60-million-tons-per-year/ | url-status=live }}</ref> | ||
The total market value of the Indian steel sector stood at US$57.8 billion in 2011 and is predicted to touch US$95.3 billion by 2016.Growth of crude steel production in India has not kept pace with the growth in capacity of production, according to the report. As per this report, steel sector contributes 2 per cent to India's GDP and employs half a million people directly and 2 million people indirectly. The | Steel products produced by large and well established companies such as [[JSW Group]], [[Jindal Steel and Power]], [[Tata Steel]], [[Rashtriya Ispat Nigam|RINL]] and [[Steel Authority of India|SAIL]] have extremely diversified steel product lines such as TMT Bars, steel pipes, railway tracks, rail wheels etc. | ||
The total market value of the Indian steel sector stood at US$57.8 billion in 2011 and is predicted to touch US$95.3 billion by 2016.Growth of crude steel production in India has not kept pace with the growth in capacity of production, according to the report. As per this report, steel sector contributes 2 per cent to India's GDP and employs half a million people directly and 2 million people indirectly. The Indian steel sector has been vibrant, growing at a compounded rate of 6% year-on-year.<ref>{{cite web|url=https://www.businesstoday.in/latest/economy/story/steel-industry-can-steer-india-towards-5-tn-economy-by-2025-ey-cii-report-314240-2021-12-02|title=Steel industry can steer India towards $5 tn economy by 2025: EY-CII report|first=Mehak|last=Agarwal|website=businesstoday.in|access-date=6 July 2023|archive-date=7 July 2023|archive-url=https://web.archive.org/web/20230707162504/https://www.businesstoday.in/latest/economy/story/steel-industry-can-steer-india-towards-5-tn-economy-by-2025-ey-cii-report-314240-2021-12-02|url-status=live}}</ref> | |||
==== Business-to-Business commerce ==== | ==== Business-to-Business commerce ==== | ||
[[Business-to-business|Business-to-Business (B2B)]] marketplaces are likely to hit gross merchandise value (GMV) of $125 billion in the next five years, growing at a compound annual growth rate (CAGR) of 45%, according to a report by Avendus Capital. | [[Business-to-business|Business-to-Business (B2B)]] marketplaces are likely to hit gross merchandise value (GMV) of $125 billion in the next five years, growing at a compound annual growth rate (CAGR) of 45%, according to a report by Avendus Capital. | ||
<ref>{{cite web | url=https://www.livemint.com/news/india/b2b-commerce-gmv-to-hit-125-billion-by-2027-avendus-11681239398380.html | title=B2B commerce GMV to hit $125 billion by 2027: Avendus | date=12 April 2023 }}</ref> | <ref>{{cite web | url=https://www.livemint.com/news/india/b2b-commerce-gmv-to-hit-125-billion-by-2027-avendus-11681239398380.html | title=B2B commerce GMV to hit $125 billion by 2027: Avendus | date=12 April 2023 | access-date=5 July 2023 | archive-date=6 May 2023 | archive-url=https://web.archive.org/web/20230506233853/https://www.livemint.com/news/india/b2b-commerce-gmv-to-hit-125-billion-by-2027-avendus-11681239398380.html | url-status=live }}</ref> | ||
India's B2B e-commerce startups sees 3-6x growth, India's B2B (business-to-business) market is twice the size of B2C (business-to-consumer) and contributes roughly two-thirds to India $3 trillion economy.India has seen the rise of several B2B unicorns too and, they are going after what's potentially a $2 trillion opportunity.These companies are fuelling the engines of Indian economy — the micro-, small- and medium-sized enterprises (MSMEs). The addressable market is big with over 65 million MSMEs all ready to go digital, but only about six to 10 million of them actively buy and sell online.<ref>{{cite web | url=https://www.cnbctv18.com/startup/unicorn-health-check--indias-b2b-e-commerce-startups-sees-3-6x-growth-16292201.htm | title=Unicorn Health Check {{pipe}} India's B2B e-commerce startups sees 3-6x growth | date=29 March 2023 }}</ref> | India's B2B e-commerce startups sees 3-6x growth, India's B2B (business-to-business) market is twice the size of B2C (business-to-consumer) and contributes roughly two-thirds to India $3 trillion economy.India has seen the rise of several B2B unicorns too and, they are going after what's potentially a $2 trillion opportunity.These companies are fuelling the engines of Indian economy — the micro-, small- and medium-sized enterprises (MSMEs). The addressable market is big with over 65 million MSMEs all ready to go digital, but only about six to 10 million of them actively buy and sell online.<ref>{{cite web | url=https://www.cnbctv18.com/startup/unicorn-health-check--indias-b2b-e-commerce-startups-sees-3-6x-growth-16292201.htm | title=Unicorn Health Check {{pipe}} India's B2B e-commerce startups sees 3-6x growth | date=29 March 2023 | access-date=5 July 2023 | archive-date=17 April 2023 | archive-url=https://web.archive.org/web/20230417110715/https://www.cnbctv18.com/startup/unicorn-health-check--indias-b2b-e-commerce-startups-sees-3-6x-growth-16292201.htm | url-status=live }}</ref> | ||
As per Airtel, [[5G]] will make more B2B Revenues than B2C.<ref>{{cite web | url=https://telecomtalk.info/airtel-executive-says-5g-will-make-more/693921/ | title=Airtel Executive Says 5G will Make More B2B Revenues than B2C Soon }}</ref> | As per Airtel, [[5G]] will make more B2B Revenues than B2C.<ref>{{cite web | url=https://telecomtalk.info/airtel-executive-says-5g-will-make-more/693921/ | title=Airtel Executive Says 5G will Make More B2B Revenues than B2C Soon | access-date=5 July 2023 | archive-date=11 June 2023 | archive-url=https://web.archive.org/web/20230611011724/https://telecomtalk.info/airtel-executive-says-5g-will-make-more/693921/ | url-status=live }}</ref> | ||
[[Government e Marketplace]] is an online platform for public procurement within Government departments/organizations in India under Government of India also knows as G2G commerce, The initiative was launched on August 9, 2016, by the Ministry of Commerce and Industry. | [[Government e Marketplace]] is an online platform for public procurement within Government departments/organizations in India under Government of India also knows as G2G commerce, The initiative was launched on August 9, 2016, by the Ministry of Commerce and Industry. | ||
[[Government e Marketplace|GeM]]'s B2B procurement crosses Rs 2 lakh-crore mark($30.76 Billion).The business through GeM has grown from around Rs 35,000 crore two years ago and tripled last year to Rs 1 lakh 6 thousand crores.<ref>{{cite web | url=https://www.deccanherald.com/business/economy-business/government-e-marketplace-procurement-crosses-rs-2-lakh-crore-mark-1205907.html | title=Government e Marketplace procurement crosses Rs 2 lakh-crore mark | date=2 April 2023 }}</ref> | [[Government e Marketplace|GeM]]'s B2B procurement crosses Rs 2 lakh-crore mark($30.76 Billion).The business through GeM has grown from around Rs 35,000 crore two years ago and tripled last year to Rs 1 lakh 6 thousand crores.<ref>{{cite web | url=https://www.deccanherald.com/business/economy-business/government-e-marketplace-procurement-crosses-rs-2-lakh-crore-mark-1205907.html | title=Government e Marketplace procurement crosses Rs 2 lakh-crore mark | date=2 April 2023 | access-date=5 July 2023 | archive-date=12 April 2023 | archive-url=https://web.archive.org/web/20230412082610/https://www.deccanherald.com/business/economy-business/government-e-marketplace-procurement-crosses-rs-2-lakh-crore-mark-1205907.html | url-status=live }}</ref> | ||
==== Gems and jewellery ==== | ==== Gems and jewellery ==== | ||
[[File:Surat Diamond Bourse Aerial View.jpg|thumb|Surat Diamond Bourse the biggest diamond exchange in India]] | [[File:Surat Diamond Bourse Aerial View.jpg|thumb|[[Surat Diamond Bourse]] the biggest diamond exchange in India]] | ||
India is one of the largest centres for polishing diamonds and gems and manufacturing jewellery; it is also one of the two largest [[The Gold (Control) Act, 1968|consumers of gold]].<ref name=dnbgems>[https://www.dnb.co.in/IndianGemsandJewellerySector/Overview.asp India's gem and Jewellery Sector] {{webarchive|url=https://web.archive.org/web/20130828063635/http://www.dnb.co.in/IndianGemsandJewellerySector/Overview.asp |date=28 August 2013 }} Dun and Bradstreet (2012)</ref><ref>[http://www.gold.org/news-and-events/press-releases/consumer-demand-gold-53-q2-2013-led-strong-growth-china-and-india Consumer demand for gold up 53% in Q2 2013 led by strong growth in China and India] World Gold Council (August 2013)</ref> After crude oil and petroleum products, the export and import of gold, precious metals, precious stones, gems and jewellery accounts for the largest portion of India's global trade. The industry contributes about 7% of India's GDP, employs hundreds of thousands, and is a major source of its foreign-exchange earnings.<ref>[http://www.ibef.org/industry/gems-jewellery-india.aspx Gems and Jewellery Industry in India] IBEF, Ministry of Commerce and Industry, Government of India (2013)</ref> The gems and jewellery industry created $80.84 billion in economic output on value-added basis in 2023.<ref>{{cite web |last1=Khanna |first1=Pankaj |title=How Gems & Jewellery Sector Plays A Significant Role In The Indian Economy |url=http://www.businessworld.in/article/How-Gems-Jewellery-Sector-Plays-A-Significant-Role-In-The-Indian-Economy/02-06-2018-150508/ |website=BW Businessworld |access-date=26 November 2018 |language=en}}</ref> | India is one of the largest centres for polishing diamonds and gems and manufacturing jewellery; it is also one of the two largest [[The Gold (Control) Act, 1968|consumers of gold]].<ref name=dnbgems>[https://www.dnb.co.in/IndianGemsandJewellerySector/Overview.asp India's gem and Jewellery Sector] {{webarchive|url=https://web.archive.org/web/20130828063635/http://www.dnb.co.in/IndianGemsandJewellerySector/Overview.asp |date=28 August 2013 }} Dun and Bradstreet (2012)</ref><ref>[http://www.gold.org/news-and-events/press-releases/consumer-demand-gold-53-q2-2013-led-strong-growth-china-and-india Consumer demand for gold up 53% in Q2 2013 led by strong growth in China and India] {{Webarchive|url=https://web.archive.org/web/20150402132657/http://www.gold.org/news-and-events/press-releases/consumer-demand-gold-53-q2-2013-led-strong-growth-china-and-india |date=2 April 2015 }} World Gold Council (August 2013)</ref> After crude oil and petroleum products, the export and import of gold, precious metals, precious stones, gems and jewellery accounts for the largest portion of India's global trade. The industry contributes about 7% of India's GDP, employs hundreds of thousands, and is a major source of its foreign-exchange earnings.<ref>[http://www.ibef.org/industry/gems-jewellery-india.aspx Gems and Jewellery Industry in India] {{Webarchive|url=https://web.archive.org/web/20130808144528/http://www.ibef.org/industry/gems-jewellery-india.aspx |date=8 August 2013 }} IBEF, Ministry of Commerce and Industry, Government of India (2013)</ref> The gems and jewellery industry created $80.84 billion in economic output on value-added basis in 2023.<ref>{{cite web |last1=Khanna |first1=Pankaj |title=How Gems & Jewellery Sector Plays A Significant Role In The Indian Economy |url=http://www.businessworld.in/article/How-Gems-Jewellery-Sector-Plays-A-Significant-Role-In-The-Indian-Economy/02-06-2018-150508/ |website=BW Businessworld |access-date=26 November 2018 |language=en |archive-date=26 November 2018 |archive-url=https://web.archive.org/web/20181126092755/http://www.businessworld.in/article/How-Gems-Jewellery-Sector-Plays-A-Significant-Role-In-The-Indian-Economy/02-06-2018-150508/ |url-status=live }}</ref> | ||
The gems and jewellery industry has been economically active in India for several thousand years.<ref>Oppi Untracht (1997), Traditional jewellery of India, {{ISBN|978-0810938861}}, pp 1–23</ref> Until the 18th century, India was the only major reliable source of diamonds.<ref name=dnbgems /> Now, South Africa and Australia are the major sources of diamonds and precious metals, but along with [[Antwerp]], New York City, and [[Ramat Gan]], Indian cities such as [[Surat]] and [[Mumbai]] are the hubs of world's jewellery polishing, cutting, precision finishing, supply and trade. Unlike other centres, the gems and jewellery industry in India is primarily artisan-driven; the sector is manual, highly fragmented, and almost entirely served by family-owned operations. | The gems and jewellery industry has been economically active in India for several thousand years.<ref>Oppi Untracht (1997), Traditional jewellery of India, {{ISBN|978-0810938861}}, pp 1–23</ref> Until the 18th century, India was the only major reliable source of diamonds.<ref name=dnbgems /> Now, South Africa and Australia are the major sources of diamonds and precious metals, but along with [[Antwerp]], New York City, and [[Ramat Gan]], Indian cities such as [[Surat]] and [[Mumbai]] are the hubs of world's jewellery polishing, cutting, precision finishing, supply and trade. Unlike other centres, the gems and jewellery industry in India is primarily artisan-driven; the sector is manual, highly fragmented, and almost entirely served by family-owned operations. | ||
The particular strength of this sub-sector is in precision cutting, polishing and processing small diamonds (below one carat).<ref name=dnbgems /> India is also a hub for processing of larger diamonds, pearls, and other precious stones. Statistically, 11 out of 12 diamonds set in any jewellery in the world are cut and polished in India.<ref>[http://www.rough-polished.com/en/analytics/77889.html Indian diamond cutting and polishing sector] Rough and Polished (6 March 2013)</ref> | The particular strength of this sub-sector is in precision cutting, polishing and processing small diamonds (below one carat).<ref name=dnbgems /> India is also a hub for processing of larger diamonds, pearls, and other precious stones. Statistically, 11 out of 12 diamonds set in any jewellery in the world are cut and polished in India.<ref>[http://www.rough-polished.com/en/analytics/77889.html Indian diamond cutting and polishing sector] {{Webarchive|url=https://web.archive.org/web/20150203230427/http://www.rough-polished.com/en/analytics/77889.html |date=3 February 2015 }} Rough and Polished (6 March 2013)</ref> | ||
==== Infrastructure ==== | ==== Infrastructure ==== | ||
{{Update|date=June 2023}} | {{Update|date=June 2023}} | ||
{{Main|Roads in India|Indian Railways|Ports in India|Transport in India}} | {{Main|Roads in India|Indian Railways|Ports in India|Transport in India}} | ||
[[File:Paradip Port.jpg|left|thumb | [[File:Paradip Port.jpg|left|thumb|[[Paradip Port Authority|Paradeep Port]] the third largest port in India after [[Mundra Port]] and [[Kandla Port]] with 135MMTA capacity]] | ||
India's infrastructure and transport sector contributes about 5% of its GDP. India has a [[road network]] of over {{convert|5472144|km|mi}} {{as of|2015|March|31|lc=y|post=,}} the [[List of countries by road network size|second-largest road network]] in the world only behind United States. At 1.66 km of roads per square kilometre of land (2.68 miles per square mile), the quantitative density of India's road network is higher than that of Japan (0.91) and United States (0.67), and far higher than that of China (0.46), Brazil (0.18) or Russia (0.08).<ref name="Statistics">{{cite web|url=http://morth.nic.in/showfile.asp?lid=2445|title=Basic Road Statistics of India 2013–14 and 2014–15|website=Ministry of Road Transport & Highways|access-date=12 November 2016}}</ref> Qualitatively, India's roads are a mix of modern highways and narrow, unpaved roads, and are being improved.<ref name="wbtransport">{{cite web|url=http://web.worldbank.org/WBSITE/EXTERNAL/COUNTRIES/SOUTHASIAEXT/EXTSARREGTOPTRANSPORT/0,,contentMDK:20703625~menuPK:868822~pagePK:34004173~piPK:34003707~theSitePK:579598,00.html|title=India Transport Sector|publisher=World Bank}}</ref> {{As of|2015|March|31|post=,}} 87.05% of Indian roads were paved.<ref name="Statistics" /> | India's infrastructure and transport sector contributes about 5% of its GDP. India has a [[road network]] of over {{convert|5472144|km|mi}} {{as of|2015|March|31|lc=y|post=,}} the [[List of countries by road network size|second-largest road network]] in the world only behind United States. At 1.66 km of roads per square kilometre of land (2.68 miles per square mile), the quantitative density of India's road network is higher than that of Japan (0.91) and United States (0.67), and far higher than that of China (0.46), Brazil (0.18) or Russia (0.08).<ref name="Statistics">{{cite web|url=http://morth.nic.in/showfile.asp?lid=2445|title=Basic Road Statistics of India 2013–14 and 2014–15|website=Ministry of Road Transport & Highways|access-date=12 November 2016|archive-date=11 February 2018|archive-url=https://web.archive.org/web/20180211014330/http://morth.nic.in/showfile.asp?lid=2445|url-status=live}}</ref> Qualitatively, India's roads are a mix of modern highways and narrow, unpaved roads, and are being improved.<ref name="wbtransport">{{cite web|url=http://web.worldbank.org/WBSITE/EXTERNAL/COUNTRIES/SOUTHASIAEXT/EXTSARREGTOPTRANSPORT/0,,contentMDK:20703625~menuPK:868822~pagePK:34004173~piPK:34003707~theSitePK:579598,00.html|title=India Transport Sector|publisher=World Bank|access-date=29 November 2016|archive-date=19 November 2015|archive-url=https://web.archive.org/web/20151119002640/http://web.worldbank.org/WBSITE/EXTERNAL/COUNTRIES/SOUTHASIAEXT/EXTSARREGTOPTRANSPORT/0,,contentMDK:20703625~menuPK:868822~pagePK:34004173~piPK:34003707~theSitePK:579598,00.html|url-status=live}}</ref> {{As of|2015|March|31|post=,}} 87.05% of Indian roads were paved.<ref name="Statistics" /> It is upgrading its infrastructure. {{As of|2014|May|post=,}} India had completed over {{convert|22600|km}} of 4- or 6-lane highways, connecting most of its major manufacturing, commercial and cultural centres.<ref name=nhdp2011>{{cite web|title=National Highway Development Project (NHDP)|publisher=NHAI, Ministry of Roads Transport, Govt of India|date=July 2014|url=http://www.nhai.org/WHATITIS.asp|archive-url=http://arquivo.pt/wayback/20160515151253/http://www.nhai.org/WHATITIS.asp|url-status=dead|archive-date=15 May 2016}}</ref> India's road infrastructure carries 60% of freight and 87% of passenger traffic.<ref name="Road annual report">{{cite web|url=http://morth.nic.in/showfile.asp?lid=414|title=Annual report 2010–2011|publisher=Ministry of Road transport and highways|access-date=7 February 2012|archive-date=24 January 2012|archive-url=https://web.archive.org/web/20120124154837/http://www.morth.nic.in/showfile.asp?lid=414|url-status=live}}</ref> | ||
[[File:Jawaharlal Nehru Port (JNPT).jpg|right|thumb | [[File:Jawaharlal Nehru Port (JNPT).jpg|right|thumb|[[Jawaharlal Nehru Port|Nhava Sheva Port]] is the second largest Container port and fourth largest port in India]] | ||
India has a coastline of {{convert|7500|km}} with 13 major ports, 15 big private ports and 60 operational non-major ports, which together handle 95% of the country's external trade by volume and 70% by value (most of the remainder handled by air).<ref>[http://www.ey.com/Publication/vwLUAssets/FICCI_Infra_report_final/$FILE/FICCI_Infra_report_final.pdf India Infrastructure Summit 2012] Ernst & Young (2013), pp 4 {{webarchive|url=https://web.archive.org/web/20140727183953/http://www.ey.com/Publication/vwLUAssets/FICCI_Infra_report_final/%24FILE/FICCI_Infra_report_final.pdf |date=27 July 2014 }}</ref> [[Kandla Port]], [[Kandla|New Kandla]] is the largest public port established in early 1960's, while [[Adani Ports & SEZ Limited|Mundra]] is the largest private sea port.<ref>[http://business.gov.in/infrastructure/ports.php Ports] {{webarchive|url=https://web.archive.org/web/20140821185951/http://business.gov.in/infrastructure/ports.php |date=21 August 2014 }} Business Resources, Govt of India (2013)</ref> The airport infrastructure of India includes 125 airports,<ref>[http://www.aai.aero/allAirports/airports.jsp Airports] {{webarchive|url=https://web.archive.org/web/20140618154837/http://www.aai.aero/allAirports/airports.jsp |date=18 June 2014 }} AAI, Govt of India (2013)</ref> of which 66 airports are licensed to handle both passengers and cargo.<ref>[http://dgca.nic.in/aerodrome/aero_list.pdf LIST OF LICENSED AERODROME] {{Webarchive|url=https://web.archive.org/web/20190926172324/http://dgca.nic.in/aerodrome/aero_list.pdf |date=26 September 2019 }} Directorate General of Commercial Aviation, Govt of India (May 2014)</ref> | India has a coastline of {{convert|7500|km}} with 13 major ports, 15 big private ports and 60 operational non-major ports, which together handle 95% of the country's external trade by volume and 70% by value (most of the remainder handled by air).<ref>[http://www.ey.com/Publication/vwLUAssets/FICCI_Infra_report_final/$FILE/FICCI_Infra_report_final.pdf India Infrastructure Summit 2012] Ernst & Young (2013), pp 4 {{webarchive|url=https://web.archive.org/web/20140727183953/http://www.ey.com/Publication/vwLUAssets/FICCI_Infra_report_final/%24FILE/FICCI_Infra_report_final.pdf |date=27 July 2014 }}</ref> [[Kandla Port]], [[Kandla|New Kandla]] is the largest public port established in early 1960's, while [[Adani Ports & SEZ Limited|Mundra]] is the largest private sea port.<ref>[http://business.gov.in/infrastructure/ports.php Ports] {{webarchive|url=https://web.archive.org/web/20140821185951/http://business.gov.in/infrastructure/ports.php |date=21 August 2014 }} Business Resources, Govt of India (2013)</ref> The airport infrastructure of India includes 125 airports,<ref>[http://www.aai.aero/allAirports/airports.jsp Airports] {{webarchive|url=https://web.archive.org/web/20140618154837/http://www.aai.aero/allAirports/airports.jsp |date=18 June 2014 }} AAI, Govt of India (2013)</ref> of which 66 airports are licensed to handle both passengers and cargo.<ref>[http://dgca.nic.in/aerodrome/aero_list.pdf LIST OF LICENSED AERODROME] {{Webarchive|url=https://web.archive.org/web/20190926172324/http://dgca.nic.in/aerodrome/aero_list.pdf |date=26 September 2019 }} Directorate General of Commercial Aviation, Govt of India (May 2014)</ref> | ||
| Line 894: | Line 900: | ||
{{Main|Oil and gas industry in India}} | {{Main|Oil and gas industry in India}} | ||
[[File:HaldiaPetro HaldiaPlant.jpg|thumb|[[Haldia Petrochemicals]] in [[Haldia]] industrial city]] | [[File:HaldiaPetro HaldiaPlant.jpg|thumb|[[Haldia Petrochemicals]] in [[Haldia]] industrial city]] | ||
Petroleum products and chemicals are a major contributor to India's industrial GDP, and together they contribute over 34% of its export earnings. India hosts [[List of oil refineries in India|many oil refinery]] and petrochemical operations developed with help of [[Soviet Union|Soviet]] technology such as [[Barauni Refinery]] and [[Gujarat Refinery]] , it also includes the world's largest refinery complex in [[Jamnagar]] that processes 1.24 million barrels of crude per day.<ref>[http://www.hydrocarbons-technology.com/features/feature-top-ten-largest-oil-refineries-world/ Top ten large oil refineries] Hydrocarbon Technologies (September 2013)</ref> By volume, the Indian chemical industry was the third-largest producer in Asia, and contributed 5% of the country's GDP. India is one of the five-largest producers of agrochemicals, polymers and plastics, dyes and various organic and inorganic chemicals.<ref>[http://www.ibef.org/download/Chemicals-March-220313.pdf Indian Chemical Industry] IBEF, Ministry of Commerce and Industry, Government of India (March 2014)</ref> Despite being a large producer and exporter, India is a net importer of chemicals due to domestic demands.<ref>[http://www.ibef.org/download/chemicals-august-2013.pdf Indian Chemical Industry] IBEF, Ministry of Commerce and Industry, Government of India (August 2013)</ref> India's [[Chemical industry in India|chemical industry]] is extremely diversified and estimated at $178 billion.<ref>{{cite news|url=https://www.ibef.org/industry/chemical-industry-india.aspx|website=ibef.org|title= Chemicals Industry and Exports|access-date=22 June 2020}}</ref> | [[File:MRPL_Refinery.jpg|thumb|[[Mangalore Refinery and Petrochemicals Limited|MRPL Refinery]] in [[Mangalore]]]] | ||
Petroleum products and chemicals are a major contributor to India's industrial GDP, and together they contribute over 34% of its export earnings. India hosts [[List of oil refineries in India|many oil refinery]] and petrochemical operations developed with help of [[Soviet Union|Soviet]] technology such as [[Barauni Refinery]] and [[Gujarat Refinery]] , it also includes the world's largest refinery complex in [[Jamnagar]] that processes 1.24 million barrels of crude per day.<ref>[http://www.hydrocarbons-technology.com/features/feature-top-ten-largest-oil-refineries-world/ Top ten large oil refineries] {{Webarchive|url=https://web.archive.org/web/20140711121138/http://www.hydrocarbons-technology.com/features/feature-top-ten-largest-oil-refineries-world |date=11 July 2014 }} Hydrocarbon Technologies (September 2013)</ref> By volume, the Indian chemical industry was the third-largest producer in Asia, and contributed 5% of the country's GDP. India is one of the five-largest producers of agrochemicals, polymers and plastics, dyes and various organic and inorganic chemicals.<ref>[http://www.ibef.org/download/Chemicals-March-220313.pdf Indian Chemical Industry] {{Webarchive|url=https://web.archive.org/web/20140727012832/http://www.ibef.org/download/Chemicals-March-220313.pdf |date=27 July 2014 }} IBEF, Ministry of Commerce and Industry, Government of India (March 2014)</ref> Despite being a large producer and exporter, India is a net importer of chemicals due to domestic demands.<ref>[http://www.ibef.org/download/chemicals-august-2013.pdf Indian Chemical Industry] {{Webarchive|url=https://web.archive.org/web/20131102061430/http://www.ibef.org/download/chemicals-august-2013.pdf |date=2 November 2013 }} IBEF, Ministry of Commerce and Industry, Government of India (August 2013)</ref> India's [[Chemical industry in India|chemical industry]] is extremely diversified and estimated at $178 billion.<ref>{{cite news|url=https://www.ibef.org/industry/chemical-industry-india.aspx|website=ibef.org|title=Chemicals Industry and Exports|access-date=22 June 2020|archive-date=13 January 2021|archive-url=https://web.archive.org/web/20210113142222/https://www.ibef.org/industry/chemical-industry-india.aspx|url-status=live}}</ref> | |||
The chemical industry contributed $163 billion to the economy in FY18 and is expected to reach $300–400 billion by 2025.<ref>{{cite web |title=Pro-growth environment pays off for Indian chemical companies {{!}} KPMG Belgium |url=https://home.kpmg/be/en/home/insights/2018/02/pro-growth-environment-pays-off-for-indian-chemical-companies.html |publisher=KPMG |access-date=15 August 2019 |date=13 March 2018 |archive-date=15 August 2019 |archive-url=https://web.archive.org/web/20190815070003/https://home.kpmg/be/en/home/insights/2018/02/pro-growth-environment-pays-off-for-indian-chemical-companies.html |url-status=dead }}</ref><ref>{{cite news |title=Chemical industry may reach USD 304 billion by FY25: Report |url=https://economictimes.indiatimes.com/industry/indl-goods/svs/chem-/-fertilisers/chemical-industry-may-reach-usd-304-billion-by-fy25-report/articleshow/66106551.cms |website=The Economic Times |access-date=15 August 2019 |date=7 October 2018}}</ref> The industry employed 17.33 million people (4% of the workforce) in 2016.<ref name="WTTCBenchmark" /> | The chemical industry contributed $163 billion to the economy in FY18 and is expected to reach $300–400 billion by 2025.<ref>{{cite web |title=Pro-growth environment pays off for Indian chemical companies {{!}} KPMG Belgium |url=https://home.kpmg/be/en/home/insights/2018/02/pro-growth-environment-pays-off-for-indian-chemical-companies.html |publisher=KPMG |access-date=15 August 2019 |date=13 March 2018 |archive-date=15 August 2019 |archive-url=https://web.archive.org/web/20190815070003/https://home.kpmg/be/en/home/insights/2018/02/pro-growth-environment-pays-off-for-indian-chemical-companies.html |url-status=dead }}</ref><ref>{{cite news |title=Chemical industry may reach USD 304 billion by FY25: Report |url=https://economictimes.indiatimes.com/industry/indl-goods/svs/chem-/-fertilisers/chemical-industry-may-reach-usd-304-billion-by-fy25-report/articleshow/66106551.cms |website=The Economic Times |access-date=15 August 2019 |date=7 October 2018 |archive-date=15 August 2019 |archive-url=https://web.archive.org/web/20190815070003/https://economictimes.indiatimes.com/industry/indl-goods/svs/chem-/-fertilisers/chemical-industry-may-reach-usd-304-billion-by-fy25-report/articleshow/66106551.cms |url-status=live }}</ref> The industry employed 17.33 million people (4% of the workforce) in 2016.<ref name="WTTCBenchmark" /> | ||
[[Engineers India]], a consulting firm which designs refinery and other petrochemical complex is currently executing the construction of [[Barmer Refinery]] to be completed by 2024. | [[Engineers India]], a consulting firm which designs refinery and other petrochemical complex is currently executing the construction of [[Barmer Refinery]] to be completed by 2024. | ||
| Line 902: | Line 909: | ||
==== Pharmaceuticals ==== | ==== Pharmaceuticals ==== | ||
{{Main|Pharmaceutical industry in India}} | {{Main|Pharmaceutical industry in India}} | ||
The Indian pharmaceutical industry has grown in recent years to become a major manufacturer of health care products for the world. India holds a 20% market share in the global supply of generics by volume.<ref name=":0">{{Cite web|url=https://www.ibef.org/download/pharmaceuticals-jan-2019.pdf|title=Pharmaceuticals|author=[[India Brand Equity Foundation]]}}<br /></ref> The Indian pharmaceutical sector also supplies over 62% of the global demand for various vaccines.<ref>{{cite web|title=Pharmaceuticals|url=https://www.investindia.gov.in/sector/pharmaceuticals|website=investindia.gov.in|language=en|access-date=29 May 2020}}</ref> India's pharmaceutical exports stood at $17.27 billion in 2017–18 and are expected to reach $20 billion by 2020.<ref name=":0" /> The industry grew from $6 billion in 2005 to $36.7 billion in 2016, a [[compound annual growth rate]] (CAGR) of 17.46%. It is expected to grow at a CAGR of 15.92% to reach $55 billion in 2020. India is expected to become the sixth-largest pharmaceutical market in the world by 2020.<ref name="healthDNA">{{cite web|title=Medical tourism to keep pharma industry in good health: Study|url=http://www.dnaindia.com/academy/report-medical-tourism-to-keep-pharma-industry-in-good-health-study-2329151|website=dna|access-date=20 February 2017|date=20 February 2017}}</ref> India is the world's largest manufacturer of [[generic drugs]], and its [[Pharmaceutical industry in India|pharmaceutical sector]] fulfills over 50% of the global demand for [[vaccines]].<ref>{{cite news|url=https://www.ibef.org/industry/pharmaceutical-india.aspx|website=ibef.org|title= Indian Pharmaceutical Industry |access-date=22 June 2019}}</ref> It is one of the fastest-growing industrial sub-sectors and a significant contributor to India's export earnings. The state of Gujarat has become a hub for the manufacture and export of pharmaceuticals and [[active pharmaceutical ingredient]]s (APIs).<ref>[http://www.in.kpmg.com/pdf/gujarat-pharma08.pdf Gujarat Pharma Industry] KPMG (2010)</ref> | The Indian pharmaceutical industry has grown in recent years to become a major manufacturer of health care products for the world. India holds a 20% market share in the global supply of generics by volume.<ref name=":0">{{Cite web|url=https://www.ibef.org/download/pharmaceuticals-jan-2019.pdf|title=Pharmaceuticals|author=[[India Brand Equity Foundation]]|access-date=29 May 2020|archive-date=19 April 2020|archive-url=https://web.archive.org/web/20200419165026/https://www.ibef.org/download/pharmaceuticals-jan-2019.pdf|url-status=live}}<br /></ref> The Indian pharmaceutical sector also supplies over 62% of the global demand for various vaccines.<ref>{{cite web|title=Pharmaceuticals|url=https://www.investindia.gov.in/sector/pharmaceuticals|website=investindia.gov.in|language=en|access-date=29 May 2020|archive-date=16 June 2020|archive-url=https://web.archive.org/web/20200616204243/https://www.investindia.gov.in/sector/pharmaceuticals|url-status=live}}</ref> India's pharmaceutical exports stood at $17.27 billion in 2017–18 and are expected to reach $20 billion by 2020.<ref name=":0" /> The industry grew from $6 billion in 2005 to $36.7 billion in 2016, a [[compound annual growth rate]] (CAGR) of 17.46%. It is expected to grow at a CAGR of 15.92% to reach $55 billion in 2020. India is expected to become the sixth-largest pharmaceutical market in the world by 2020.<ref name="healthDNA">{{cite web|title=Medical tourism to keep pharma industry in good health: Study|url=http://www.dnaindia.com/academy/report-medical-tourism-to-keep-pharma-industry-in-good-health-study-2329151|website=dna|access-date=20 February 2017|date=20 February 2017|archive-date=21 February 2017|archive-url=https://web.archive.org/web/20170221112643/http://www.dnaindia.com/academy/report-medical-tourism-to-keep-pharma-industry-in-good-health-study-2329151|url-status=live}}</ref> India is the world's largest manufacturer of [[generic drugs]], and its [[Pharmaceutical industry in India|pharmaceutical sector]] fulfills over 50% of the global demand for [[vaccines]].<ref>{{cite news|url=https://www.ibef.org/industry/pharmaceutical-india.aspx|website=ibef.org|title=Indian Pharmaceutical Industry|access-date=22 June 2019|archive-date=11 April 2020|archive-url=https://web.archive.org/web/20200411072103/https://www.ibef.org/industry/pharmaceutical-india.aspx|url-status=live}}</ref> It is one of the fastest-growing industrial sub-sectors and a significant contributor to India's export earnings. The state of Gujarat has become a hub for the manufacture and export of pharmaceuticals and [[active pharmaceutical ingredient]]s (APIs).<ref>[http://www.in.kpmg.com/pdf/gujarat-pharma08.pdf Gujarat Pharma Industry] {{Webarchive|url=https://web.archive.org/web/20150421102004/http://www.in.kpmg.com/pdf/gujarat-pharma08.pdf |date=21 April 2015 }} KPMG (2010)</ref> | ||
==== Textile ==== | ==== Textile ==== | ||
{{Main|Textile industry in India}} | {{Main|Textile industry in India}} | ||
The textile and apparel market in India was estimated to be $108.5 billion in 2015. It is expected to reach a size of $226 billion by 2023. The industry employees over 35 million people. By value, the textile industry accounts for 7% of India's industrial, 2% of GDP and 15% of the country's export earnings. India exported $39.2 billion worth of textiles in the 2017–18 fiscal year.<ref>{{cite web | title=Textile Industry in India: Latest facts, figures and government schemes |url=https://www.indiatoday.in/education-today/gk-current-affairs/story/textile-industry-in-india-latest-facts-figures-government-schemes-1353406-2018-10-01 |website=India Today |access-date=27 January 2019 |language=en}}</ref> The Indian [[Textile industry in India|textiles industry]] is estimated at $100 billion and contributes 13% of industrial output and 2.3% of India's GDP while employs over 45 million people directly.<ref>{{cite news|url=https://www.ibef.org/industry/textiles.aspx|website=ibef.org|title=Textile Industry & Market Growth in India |access-date=22 June 2019}}</ref> | The textile and apparel market in India was estimated to be $108.5 billion in 2015. It is expected to reach a size of $226 billion by 2023. The industry employees over 35 million people. By value, the textile industry accounts for 7% of India's industrial, 2% of GDP and 15% of the country's export earnings. India exported $39.2 billion worth of textiles in the 2017–18 fiscal year.<ref>{{cite web |title=Textile Industry in India: Latest facts, figures and government schemes |url=https://www.indiatoday.in/education-today/gk-current-affairs/story/textile-industry-in-india-latest-facts-figures-government-schemes-1353406-2018-10-01 |website=India Today |access-date=27 January 2019 |language=en |archive-date=27 January 2019 |archive-url=https://web.archive.org/web/20190127205723/https://www.indiatoday.in/education-today/gk-current-affairs/story/textile-industry-in-india-latest-facts-figures-government-schemes-1353406-2018-10-01 |url-status=live }}</ref> The Indian [[Textile industry in India|textiles industry]] is estimated at $100 billion and contributes 13% of industrial output and 2.3% of India's GDP while employs over 45 million people directly.<ref>{{cite news|url=https://www.ibef.org/industry/textiles.aspx|website=ibef.org|title=Textile Industry & Market Growth in India|access-date=22 June 2019|archive-date=7 May 2019|archive-url=https://web.archive.org/web/20190507133158/https://www.ibef.org/industry/textiles.aspx|url-status=live}}</ref> | ||
India's textile industry has transformed in recent years from a declining sector to a rapidly developing one. After freeing the industry in 2004–2005 from a number of limitations, primarily financial, the government permitted massive investment inflows, both domestic and foreign. From 2004 to 2008, total investment into the textile sector increased by $27 billion. [[Ludhiana]] produces 90% of woollens in India and is known as the Manchester of India. [[Tirupur]] has gained universal recognition as the leading source of hosiery, knitted garments, casual wear, and sportswear. Expanding textile centres such as [[Ichalkaranji]] enjoy one of the highest per-capita incomes in the country.<ref>{{cite news|url=http://www.hindu.com/2007/06/11/stories/2007061110090500.htm|archive-url=https://web.archive.org/web/20071128012707/http://www.hindu.com/2007/06/11/stories/2007061110090500.htm|url-status=dead|archive-date=28 November 2007|title=Helping Tirupur emerge as a leader in knitwear exports in India|location=Chennai|date=11 June 2007|newspaper=[[The Hindu]]|access-date=17 January 2011}}</ref> India's cotton farms, fibre and textile industry provides employment to 45 million people in India,<ref name="ibeftex">{{cite web|url=http://www.ibef.org/industry/textiles.aspx|title=Textile Industry in India, Indian Textile Industry, Garment Industry|publisher=IBEF, Govt of India|access-date=12 April 2014}}</ref> including some [[child labour]] (1%). The sector is estimated to employ around 400,000 [[child labour|children]] under the age of 18.<ref>{{cite web |url=https://www.bbc.co.uk/news/business-26294513 |title=The task of protecting India's child cotton pickers |last1=Neal |first1=John |date=23 February 2014 |publisher=BBC |access-date=23 February 2014}}</ref> | India's textile industry has transformed in recent years from a declining sector to a rapidly developing one. After freeing the industry in 2004–2005 from a number of limitations, primarily financial, the government permitted massive investment inflows, both domestic and foreign. From 2004 to 2008, total investment into the textile sector increased by $27 billion. [[Ludhiana]] produces 90% of woollens in India and is known as the Manchester of India. [[Tirupur]] has gained universal recognition as the leading source of hosiery, knitted garments, casual wear, and sportswear. Expanding textile centres such as [[Ichalkaranji]] enjoy one of the highest per-capita incomes in the country.<ref>{{cite news|url=http://www.hindu.com/2007/06/11/stories/2007061110090500.htm|archive-url=https://web.archive.org/web/20071128012707/http://www.hindu.com/2007/06/11/stories/2007061110090500.htm|url-status=dead|archive-date=28 November 2007|title=Helping Tirupur emerge as a leader in knitwear exports in India|location=Chennai|date=11 June 2007|newspaper=[[The Hindu]]|access-date=17 January 2011}}</ref> India's cotton farms, fibre and textile industry provides employment to 45 million people in India,<ref name="ibeftex">{{cite web|url=http://www.ibef.org/industry/textiles.aspx|title=Textile Industry in India, Indian Textile Industry, Garment Industry|publisher=IBEF, Govt of India|access-date=12 April 2014|archive-date=2 October 2016|archive-url=https://web.archive.org/web/20161002132723/http://www.ibef.org/industry/textiles.aspx|url-status=live}}</ref> including some [[child labour]] (1%). The sector is estimated to employ around 400,000 [[child labour|children]] under the age of 18.<ref>{{cite web |url=https://www.bbc.co.uk/news/business-26294513 |title=The task of protecting India's child cotton pickers |last1=Neal |first1=John |date=23 February 2014 |publisher=BBC |access-date=23 February 2014 |archive-date=24 February 2014 |archive-url=https://web.archive.org/web/20140224110801/http://www.bbc.co.uk/news/business-26294513 |url-status=live }}</ref> | ||
==== Pulp and paper ==== | ==== Pulp and paper ==== | ||
{{Main|Pulp and paper industry in India}} | {{Main|Pulp and paper industry in India}} | ||
The [[pulp and paper industry]] in India is one of the major producers of paper in the world and has adopted new manufacturing technology.<ref>{{cite web|url=http://papermart.in/2010/05/31/top-paper-companies-in-india/|title=Top Paper Companies in India|date=31 May 2010|publisher=papermart.in|access-date=8 August 2018|archive-date=12 February 2019|archive-url=https://web.archive.org/web/20190212204455/http://papermart.in/2010/05/31/top-paper-companies-in-india/|url-status=dead}}</ref> The paper market in India was estimated to be worth {{INRConvert|600|b}} in 2017–18 recording a CAGR of 6–7%. Domestic demand for paper almost doubled from around {{convert|9|Mt|e6LT e6ST|abbr=off}} in the 2007–08 fiscal to over {{convert|17|Mt|e6LT e6ST|abbr=off}} in 2017–18. The per capita consumption of paper in India is around 13–14 kg annually, lower than the global average of 57 kg.<ref>{{cite web |title=India beats China in paper market growth despite dumping fears |url=https://www.financialexpress.com/industry/india-outstrips-china-in-paper-market-growth-despite-dumping-fears/1443807/ |website=The Financial Express |access-date=27 January 2019 |date=15 January 2019}}</ref> | The [[pulp and paper industry]] in India is one of the major producers of paper in the world and has adopted new manufacturing technology.<ref>{{cite web|url=http://papermart.in/2010/05/31/top-paper-companies-in-india/|title=Top Paper Companies in India|date=31 May 2010|publisher=papermart.in|access-date=8 August 2018|archive-date=12 February 2019|archive-url=https://web.archive.org/web/20190212204455/http://papermart.in/2010/05/31/top-paper-companies-in-india/|url-status=dead}}</ref> The paper market in India was estimated to be worth {{INRConvert|600|b}} in 2017–18 recording a CAGR of 6–7%. Domestic demand for paper almost doubled from around {{convert|9|Mt|e6LT e6ST|abbr=off}} in the 2007–08 fiscal to over {{convert|17|Mt|e6LT e6ST|abbr=off}} in 2017–18. The per capita consumption of paper in India is around 13–14 kg annually, lower than the global average of 57 kg.<ref>{{cite web |title=India beats China in paper market growth despite dumping fears |url=https://www.financialexpress.com/industry/india-outstrips-china-in-paper-market-growth-despite-dumping-fears/1443807/ |website=The Financial Express |access-date=27 January 2019 |date=15 January 2019 |archive-date=27 January 2019 |archive-url=https://web.archive.org/web/20190127152912/https://www.financialexpress.com/industry/india-outstrips-china-in-paper-market-growth-despite-dumping-fears/1443807/ |url-status=live }}</ref> | ||
==== Mining ==== | ==== Mining ==== | ||
{{Main|Mining in India}} | {{Main|Mining in India}} | ||
[[File:Mine_II,_Neyveli_NLCIL.jpg|thumb|an [[NLC India Limited|NLC India]] mine]] | [[File:Mine_II,_Neyveli_NLCIL.jpg|thumb|an [[NLC India Limited|NLC India]] mine]] | ||
Mining contributed $63 billion (3% of GDP) and employed 20.14 million people (5% of the workforce) in 2016.<ref name="WTTCBenchmark" /> India's mining industry was the fourth-largest producer of minerals in the world by volume, and eighth-largest producer by value in 2009.<ref name="mospimines">[http://mospi.nic.in/Mospi_New/upload/SYB2014/CH-15-MINING/Mining.pdf Mining] {{webarchive|url=https://web.archive.org/web/20140809003924/http://mospi.nic.in/Mospi_New/upload/SYB2014/CH-15-MINING/Mining.pdf|date=9 August 2014}} Chapter 15, Ministry of Statistics and Programme Implementation, Govt of India (2011)</ref> In 2013, it mined and processed 89 minerals, of which four were fuel, three were atomic energy minerals, and 80 non-fuel.<ref>[http://www.ey.com/IN/en/Industries/Mining---Metals/EY-emerging-economies-and-Indias-mining-industry Emerging economies and India's mining industry] Ernst & Young (2014)</ref> The | Mining contributed $63 billion (3% of GDP) and employed 20.14 million people (5% of the workforce) in 2016.<ref name="WTTCBenchmark" /> India's mining industry was the fourth-largest producer of minerals in the world by volume, and eighth-largest producer by value in 2009.<ref name="mospimines">[http://mospi.nic.in/Mospi_New/upload/SYB2014/CH-15-MINING/Mining.pdf Mining] {{webarchive|url=https://web.archive.org/web/20140809003924/http://mospi.nic.in/Mospi_New/upload/SYB2014/CH-15-MINING/Mining.pdf|date=9 August 2014}} Chapter 15, Ministry of Statistics and Programme Implementation, Govt of India (2011)</ref> In 2013, it mined and processed 89 minerals, of which four were fuel, three were atomic energy minerals, and 80 non-fuel.<ref>[http://www.ey.com/IN/en/Industries/Mining---Metals/EY-emerging-economies-and-Indias-mining-industry Emerging economies and India's mining industry] {{Webarchive|url=https://web.archive.org/web/20140727161413/http://www.ey.com/IN/en/Industries/Mining---Metals/EY-emerging-economies-and-Indias-mining-industry |date=27 July 2014 }} Ernst & Young (2014)</ref> The public sector accounted for 68% of mineral production by volume in 2011–12.<ref name="ficcimine">[http://www.ficci.com/spdocument/20317/Mining-Industry.pdf Development of Indian Mining Industry] {{Webarchive|url=https://web.archive.org/web/20140701051056/http://www.ficci.com/spdocument/20317/Mining-Industry.pdf |date=1 July 2014 }} FICCI (2012), pp 12–14</ref> India has the world's fourth-largest [[Natural resources of India|natural resources]], with the [[Mining in India|mining sector]] contributing 11% of the country's industrial GDP and 2.5% of total GDP. | ||
Nearly 50% of India's mining industry, by output value, is concentrated in eight states: [[Odisha]], Rajasthan, [[Chhattisgarh]], Andhra Pradesh, [[Telangana]], Jharkhand, [[Madhya Pradesh]] and [[Karnataka]]. Another 25% of the output by value comes from offshore oil and gas resources.<ref name="ficcimine" /> India operated about 3,000 mines in 2010, half of which were coal, limestone and iron ore.<ref>[http://mospi.nic.in/Mospi_New/upload/SYB2014/CH-15-MINING/Mining.pdf Mining] {{webarchive|url=https://web.archive.org/web/20140809003924/http://mospi.nic.in/Mospi_New/upload/SYB2014/CH-15-MINING/Mining.pdf|date=9 August 2014}} Chapter 15, Ministry of Statistics and Programme Implementation, Govt of India (2011), pp 205</ref> On output-value basis, India was one of the five largest producers of mica, chromite, coal, lignite, iron ore, bauxite, barite, zinc and manganese; while being one of the ten largest global producers of many other minerals.<ref name="mospimines" /><ref name="ficcimine" /> India was the fourth-largest producer of steel in 2013,<ref>[https://www.worldsteel.org/dms/internetDocumentList/bookshop/Word-Steel-in-Figures-2013/document/World%20Steel%20in%20Figures%202013.pdf World Steel Figures in 2013] {{webarchive|url=https://web.archive.org/web/20131101150040/http://www.worldsteel.org/dms/internetDocumentList/bookshop/Word-Steel-in-Figures-2013/document/World%20Steel%20in%20Figures%202013.pdf|date=1 November 2013}} World Steel Association (2014), pp 9</ref> and the seventh-largest producer of aluminium.<ref>[http://minerals.usgs.gov/minerals/pubs/commodity/aluminum/mcs-2014-alumi.pdf Aluminum] USGS, U.S. Government (2014)</ref> | Nearly 50% of India's mining industry, by output value, is concentrated in eight states: [[Odisha]], Rajasthan, [[Chhattisgarh]], Andhra Pradesh, [[Telangana]], Jharkhand, [[Madhya Pradesh]] and [[Karnataka]]. Another 25% of the output by value comes from offshore oil and gas resources.<ref name="ficcimine" /> India operated about 3,000 mines in 2010, half of which were coal, limestone and iron ore.<ref>[http://mospi.nic.in/Mospi_New/upload/SYB2014/CH-15-MINING/Mining.pdf Mining] {{webarchive|url=https://web.archive.org/web/20140809003924/http://mospi.nic.in/Mospi_New/upload/SYB2014/CH-15-MINING/Mining.pdf|date=9 August 2014}} Chapter 15, Ministry of Statistics and Programme Implementation, Govt of India (2011), pp 205</ref> On output-value basis, India was one of the five largest producers of mica, chromite, coal, lignite, iron ore, bauxite, barite, zinc and manganese; while being one of the ten largest global producers of many other minerals.<ref name="mospimines" /><ref name="ficcimine" /> India was the fourth-largest producer of steel in 2013,<ref>[https://www.worldsteel.org/dms/internetDocumentList/bookshop/Word-Steel-in-Figures-2013/document/World%20Steel%20in%20Figures%202013.pdf World Steel Figures in 2013] {{webarchive|url=https://web.archive.org/web/20131101150040/http://www.worldsteel.org/dms/internetDocumentList/bookshop/Word-Steel-in-Figures-2013/document/World%20Steel%20in%20Figures%202013.pdf|date=1 November 2013}} World Steel Association (2014), pp 9</ref> and the seventh-largest producer of aluminium.<ref>[http://minerals.usgs.gov/minerals/pubs/commodity/aluminum/mcs-2014-alumi.pdf Aluminum] {{Webarchive|url=https://web.archive.org/web/20170427004808/https://minerals.usgs.gov/minerals/pubs/commodity/aluminum/mcs-2014-alumi.pdf |date=27 April 2017 }} USGS, U.S. Government (2014)</ref> | ||
India's mineral resources are vast.<ref>[http://business.gov.in/Industry_services/mines.php Mines] {{webarchive|url=https://web.archive.org/web/20140213140237/http://business.gov.in/Industry_services/mines.php|date=13 February 2014}} Business Knowledge Resources, Government of India (2013)</ref> However, its mining industry has declined – contributing 2.3% of its GDP in 2010 compared to 3% in 2000, and employed 2.9 million people – a decreasing percentage of its total labour. India is a net importer of many minerals including coal. India's mining sector decline is because of complex permit, regulatory and administrative procedures, inadequate infrastructure, shortage of capital resources, and slow adoption of environmentally sustainable technologies.<ref name="ficcimine" /><ref>[http://mines.nic.in/writereaddata%5CContentlinks%5C9eeb6e3b6113423586029ee88e1f4b36.pdf Unlocking the Potential of the Indian Minerals Sector] {{webarchive|url=https://web.archive.org/web/20140418144441/http://mines.nic.in/writereaddata/Contentlinks/9eeb6e3b6113423586029ee88e1f4b36.pdf|date=18 April 2014}} Ministry of Mines, Govt of India (November 2011)</ref> | India's mineral resources are vast.<ref>[http://business.gov.in/Industry_services/mines.php Mines] {{webarchive|url=https://web.archive.org/web/20140213140237/http://business.gov.in/Industry_services/mines.php|date=13 February 2014}} Business Knowledge Resources, Government of India (2013)</ref> However, its mining industry has declined – contributing 2.3% of its GDP in 2010 compared to 3% in 2000, and employed 2.9 million people – a decreasing percentage of its total labour. India is a net importer of many minerals including coal. India's mining sector decline is because of complex permit, regulatory and administrative procedures, inadequate infrastructure, shortage of capital resources, and slow adoption of environmentally sustainable technologies.<ref name="ficcimine" /><ref>[http://mines.nic.in/writereaddata%5CContentlinks%5C9eeb6e3b6113423586029ee88e1f4b36.pdf Unlocking the Potential of the Indian Minerals Sector] {{webarchive|url=https://web.archive.org/web/20140418144441/http://mines.nic.in/writereaddata/Contentlinks/9eeb6e3b6113423586029ee88e1f4b36.pdf|date=18 April 2014}} Ministry of Mines, Govt of India (November 2011)</ref> | ||
| Line 925: | Line 932: | ||
==== Construction ==== | ==== Construction ==== | ||
{{Main|Construction industry of India}} | {{Main|Construction industry of India}} | ||
The construction industry contributed $288 billion (13% of GDP) and employed 60.42 million people (14% of the workforce) in 2016.<ref name="WTTCBenchmark" /> The [[Construction industry of India|construction]] and real estate sector ranks third among the 14 major sectors in terms of direct, indirect, and induced effects in all sectors of the economy.<ref>{{cite news|url=https://www.ibef.org/industry/real-estate-india.aspx|website=ibef.org|title= Indian Real Estate Industry |access-date=22 June 2019}}</ref> | The construction industry contributed $288 billion (13% of GDP) and employed 60.42 million people (14% of the workforce) in 2016.<ref name="WTTCBenchmark" /> The [[Construction industry of India|construction]] and real estate sector ranks third among the 14 major sectors in terms of direct, indirect, and induced effects in all sectors of the economy.<ref>{{cite news|url=https://www.ibef.org/industry/real-estate-india.aspx|website=ibef.org|title=Indian Real Estate Industry|access-date=22 June 2019|archive-date=15 March 2022|archive-url=https://web.archive.org/web/20220315184209/https://www.ibef.org/industry/real-estate-india.aspx|url-status=live}}</ref> | ||
[[File:INDIABULLS BLUE (TOWER-A,B,C).jpg|thumb|Indiabulls Blu skyscraper]] | [[File:INDIABULLS BLUE (TOWER-A,B,C).jpg|thumb|Indiabulls Blu skyscraper]] | ||
The real estate sector will provide huge business opportunities, employment and big avenues for startup ecosystem. | The real estate sector will provide huge business opportunities, employment and big avenues for startup ecosystem. The [[2023 Union budget of India]] also focused significantly on infrastructure with nearly ₹10 trillion direct investment of central government.<ref>{{cite web|url=https://www.livemint.com/economy/india-to-become-3rd-largest-construction-market-in-3-years-11681575402097.html|title='India to become 3rd largest construction market in 3 years'|date=15 April 2023|website=livemint.com|access-date=3 July 2023|archive-date=3 July 2023|archive-url=https://web.archive.org/web/20230703104042/https://www.livemint.com/economy/india-to-become-3rd-largest-construction-market-in-3-years-11681575402097.html|url-status=live}}</ref> | ||
=== Services === | ==== Services and Consulting industry ==== | ||
[[File:Deloitte office, Hyderabad.jpg|thumb| | [[File:Deloitte office, Hyderabad.jpg|thumb|[[Hyderabad]] is a major consultancy & services centre, where services such as accountancy, auditing, tax related services are popular.]] | ||
The services sector has the largest share of India's GDP, accounting for 57% in 2012, up from 15% in 1950.<ref name="quandl.com" /> It is the [[List of countries by GDP sector composition#Nominal GDP sector composition|seventh-largest services sector]] by nominal GDP, and [[List of countries by GDP sector composition#PPP GDP sector composition|third largest]] when purchasing power is taken into account. The services sector provides employment to 27% of the workforce. Information technology and [[business process outsourcing]] are among the fastest-growing sectors, having a cumulative growth rate of revenue 33.6% between fiscal years 1997–98 and 2002–03, and contributing to 25% of the country's total exports in {{nowrap|2007–08}}.<ref>{{Harvnb|Datt|Sundharam|2009|pp=668–669}}</ref>{{update inline|date=June 2017}} | The services sector has the largest share of India's GDP, accounting for 57% in 2012, up from 15% in 1950.<ref name="quandl.com" /> It is the [[List of countries by GDP sector composition#Nominal GDP sector composition|seventh-largest services sector]] by nominal GDP, and [[List of countries by GDP sector composition#PPP GDP sector composition|third largest]] when purchasing power is taken into account. The services sector provides employment to 27% of the workforce. Information technology and [[business process outsourcing]] are among the fastest-growing sectors, having a cumulative growth rate of revenue 33.6% between fiscal years 1997–98 and 2002–03, and contributing to 25% of the country's total exports in {{nowrap|2007–08}}.<ref>{{Harvnb|Datt|Sundharam|2009|pp=668–669}}</ref>{{update inline|date=June 2017}} | ||
==== Aviation ==== | ==== Aviation ==== | ||
{{Main|Aviation in India|Civil aviation in India}} | {{Main|Aviation in India|Civil aviation in India}} | ||
[[File:VT-CID - Airbus A320-251N - Air India - 7475 - VGHS.jpg|thumb | [[File:VT-CID - Airbus A320-251N - Air India - 7475 - VGHS.jpg|thumb|[[Air India]] became the first Asian carrier to induct a jet aircraft, with the [[Boeing 707]]–420]] | ||
India is the fourth-largest civil aviation market in the world recording an air traffic of 158 million passengers in 2017.<ref>{{cite web|title=India becomes fourth largest aviation market in the world|url=https://mediaindia.eu/news-aibm/india-becomes-fourth-largest-aviation-market-in-the-world/|website=Media India Group|access-date=14 October 2017|date=21 April 2017}}</ref><ref name="IATA">{{cite web |title=Potential and Challenges of Indian Aviation |url=https://www.iata.org/pressroom/pr/Pages/2018-09-04-02.aspx |website=IATA |access-date=26 November 2018}}</ref> The market is estimated to have 800 aircraft by 2020, which would account for 4.3% of global volumes,<ref>{{citation|title=Aviation|url=http://www.makeinindia.com/sector/aviation|publisher=[[Make in India]]}}</ref> and is expected to record annual passenger traffic of 520 million by 2037.<ref name="IATA" /> [[IATA]] estimated that aviation contributed $30 billion to India's GDP in 2017, and supported 7.5 million jobs – 390,000 directly, 570,000 in the value chain, and 6.2 million through tourism.<ref name="IATA" /> | India is the fourth-largest civil aviation market in the world recording an air traffic of 158 million passengers in 2017.<ref>{{cite web|title=India becomes fourth largest aviation market in the world|url=https://mediaindia.eu/news-aibm/india-becomes-fourth-largest-aviation-market-in-the-world/|website=Media India Group|access-date=14 October 2017|date=21 April 2017|archive-date=15 October 2017|archive-url=https://web.archive.org/web/20171015044733/https://mediaindia.eu/news-aibm/india-becomes-fourth-largest-aviation-market-in-the-world/|url-status=live}}</ref><ref name="IATA">{{cite web |title=Potential and Challenges of Indian Aviation |url=https://www.iata.org/pressroom/pr/Pages/2018-09-04-02.aspx |website=IATA |access-date=26 November 2018 |archive-date=26 November 2018 |archive-url=https://web.archive.org/web/20181126134816/https://www.iata.org/pressroom/pr/Pages/2018-09-04-02.aspx |url-status=dead }}</ref> The market is estimated to have 800 aircraft by 2020, which would account for 4.3% of global volumes,<ref>{{citation|title=Aviation|url=http://www.makeinindia.com/sector/aviation|publisher=[[Make in India]]|access-date=18 November 2016|archive-date=1 November 2015|archive-url=https://web.archive.org/web/20151101015320/http://www.makeinindia.com/sector/aviation|url-status=live}}</ref> and is expected to record annual passenger traffic of 520 million by 2037.<ref name="IATA" /> [[IATA]] estimated that aviation contributed $30 billion to India's GDP in 2017, and supported 7.5 million jobs – 390,000 directly, 570,000 in the value chain, and 6.2 million through tourism.<ref name="IATA" /> | ||
Civil aviation in India traces its beginnings to 18 February 1911, when [[Henri Pequet]], a French aviator, carried 6,500 pieces of mail on a [[Humber-Sommer biplane|Humber biplane]] from Allahabad (present-day [[Prayagraj]]) to [[Naini]].<ref name="PIB"> | Civil aviation in India traces its beginnings to 18 February 1911, when [[Henri Pequet]], a French aviator, carried 6,500 pieces of mail on a [[Humber-Sommer biplane|Humber biplane]] from Allahabad (present-day [[Prayagraj]]) to [[Naini]].<ref name="PIB">{{Cite web |url=http://pib.nic.in/newsite/efeatures.aspx?relid=69345 |title=100 Years of Civil Aviation in India – Milestones |access-date=18 November 2016 |archive-date=7 July 2017 |archive-url=https://web.archive.org/web/20170707095705/http://pib.nic.in/newsite/efeatures.aspx?relid=69345 |url-status=live }}</ref> Later on 15 October 1932, [[J.R.D. Tata]] flew a consignment of mail from Karachi to [[Juhu Airport]]. His airline later became [[Air India]] and was the first Asian airline to cross the Atlantic Ocean as well as first Asian airline to fly jets.<ref name="BR">{{Cite web|url=http://www.bharat-rakshak.com/IAF/History/Aircraft/AviationIndia.pdf|archiveurl=https://web.archive.org/web/20120227142219/http://www.bharat-rakshak.com/IAF/History/Aircraft/AviationIndia.pdf|url-status=dead|title=Beginning of Aviation in India – Bharat Rakshak|archivedate=27 February 2012}}</ref> | ||
===== Nationalisation ===== | ===== Nationalisation ===== | ||
| Line 946: | Line 953: | ||
The government de-regularised the civil aviation sector in 1991 when the government allowed private airlines to operate charter and non-scheduled services under the 'Air Taxi' Scheme until 1994, when the Air Corporation Act was repealed and private airlines could now operate scheduled services. Private airlines including [[Jet Airways]], [[Air Sahara]], [[Modiluft]], [[Damania Airways]] and [[NEPC Airlines]] commenced domestic operations during this period.<ref name="PIB" /> | The government de-regularised the civil aviation sector in 1991 when the government allowed private airlines to operate charter and non-scheduled services under the 'Air Taxi' Scheme until 1994, when the Air Corporation Act was repealed and private airlines could now operate scheduled services. Private airlines including [[Jet Airways]], [[Air Sahara]], [[Modiluft]], [[Damania Airways]] and [[NEPC Airlines]] commenced domestic operations during this period.<ref name="PIB" /> | ||
The aviation industry experienced a rapid transformation following deregulation. Several [[low-cost carrier]]s entered the Indian market in 2004–05. Major new entrants included [[Air Deccan]], [[Air Sahara]], [[Kingfisher Airlines]], [[SpiceJet]], [[GoAir]], [[Paramount Airways]] and [[IndiGo]]. Kingfisher Airlines became the first Indian air carrier on 15 June 2005 to order [[Airbus A380]] aircraft worth {{USD}}3 billion.<ref name="KingfisherA380">{{cite web|url=http://www.financialexpress.com/old/latest_full_story.php?content_id=93786 |work=Online edition of the [[The Financial Express (India)|Financial Express]]|date=14 June 2005|title=Kingfisher Air nets monster jumbo |access-date=11 June 2009 |url-status=dead |archive-url=https://web.archive.org/web/20130514232154/http://www.financialexpress.com/old/latest_full_story.php?content_id=93786 |archive-date=14 May 2013 }}</ref><ref name="Kingfisher3bn">{{cite web|url=http://www.flightglobal.com/articles/2005/06/16/199660/high-fives-with-3bn-kingfisher-order.html |title=High fives with $3bn Kingfisher order |work=Flightglobal |date=16 June 2005 |access-date=11 June 2009 |url-status=dead |archive-url=https://web.archive.org/web/20121105064926/http://www.flightglobal.com/news/articles/high-fives-with-3bn-kingfisher-order-199660/ |archive-date=5 November 2012 }}</ref> However, Indian aviation would struggle due to an economic slowdown and rising fuel and operation costs. This led to consolidation, buyouts and discontinuations. In 2007, Air Sahara and Air Deccan were acquired by Jet Airways and Kingfisher Airlines respectively. Paramount Airways ceased operations in 2010 and Kingfisher shut down in 2012. [[Etihad Airways]] agreed to acquire a 24% stake in Jet Airways in 2013. [[AirAsia India]], a low-cost carrier operating as a joint venture between [[Air Asia]] and [[Tata Sons]] launched in 2014. {{as of|2013}}–14, only IndiGo and GoAir were generating profits.<ref>{{cite web|url=http://www.thehindubusinessline.com/companies/goair-sees-profit-for-second-year-in-a-row/article6037650.ece|title=GoAir sees profit for second year in a row|author=Our Bureau|work=Business Line|date=22 May 2014 }}</ref>{{update inline|date=June 2017}} The average domestic passenger air fare dropped by 70% between 2005 and 2017, after adjusting for inflation.<ref name="IATA" /> | The aviation industry experienced a rapid transformation following deregulation. Several [[low-cost carrier]]s entered the Indian market in 2004–05. Major new entrants included [[Air Deccan]], [[Air Sahara]], [[Kingfisher Airlines]], [[SpiceJet]], [[GoAir]], [[Paramount Airways]] and [[IndiGo]]. Kingfisher Airlines became the first Indian air carrier on 15 June 2005 to order [[Airbus A380]] aircraft worth {{USD}}3 billion.<ref name="KingfisherA380">{{cite web|url=http://www.financialexpress.com/old/latest_full_story.php?content_id=93786 |work=Online edition of the [[The Financial Express (India)|Financial Express]]|date=14 June 2005|title=Kingfisher Air nets monster jumbo |access-date=11 June 2009 |url-status=dead |archive-url=https://web.archive.org/web/20130514232154/http://www.financialexpress.com/old/latest_full_story.php?content_id=93786 |archive-date=14 May 2013 }}</ref><ref name="Kingfisher3bn">{{cite web|url=http://www.flightglobal.com/articles/2005/06/16/199660/high-fives-with-3bn-kingfisher-order.html |title=High fives with $3bn Kingfisher order |work=Flightglobal |date=16 June 2005 |access-date=11 June 2009 |url-status=dead |archive-url=https://web.archive.org/web/20121105064926/http://www.flightglobal.com/news/articles/high-fives-with-3bn-kingfisher-order-199660/ |archive-date=5 November 2012 }}</ref> However, Indian aviation would struggle due to an economic slowdown and rising fuel and operation costs. This led to consolidation, buyouts and discontinuations. In 2007, Air Sahara and Air Deccan were acquired by Jet Airways and Kingfisher Airlines respectively. Paramount Airways ceased operations in 2010 and Kingfisher shut down in 2012. [[Etihad Airways]] agreed to acquire a 24% stake in Jet Airways in 2013. [[AirAsia India]], a low-cost carrier operating as a joint venture between [[Air Asia]] and [[Tata Sons]] launched in 2014. {{as of|2013}}–14, only IndiGo and GoAir were generating profits.<ref>{{cite web|url=http://www.thehindubusinessline.com/companies/goair-sees-profit-for-second-year-in-a-row/article6037650.ece|title=GoAir sees profit for second year in a row|author=Our Bureau|work=Business Line|date=22 May 2014|access-date=18 November 2016|archive-date=1 January 2016|archive-url=https://web.archive.org/web/20160101034339/http://www.thehindubusinessline.com/companies/goair-sees-profit-for-second-year-in-a-row/article6037650.ece|url-status=live}}</ref>{{update inline|date=June 2017}} The average domestic passenger air fare dropped by 70% between 2005 and 2017, after adjusting for inflation.<ref name="IATA" /> | ||
==== Banking and financial services ==== | ==== Banking and financial services ==== | ||
{{Main|Banking in India|Finance in India}} | {{Main|Banking in India|Finance in India}} | ||
[[File:BKC - panoramio.jpg|thumb | [[File:BKC - panoramio.jpg|thumb|[[Bank of India]] HQ in [[Bandra Kurla Complex|BKC]]]] | ||
[[File:India bonds.webp|thumb | [[File:India bonds.webp|thumb|India bonds | ||
{{legend-line|#FF9933 solid 3px|30 year }} | {{legend-line|#FF9933 solid 3px|30 year }} | ||
{{legend-line|#138808 solid 3px|10 year }} | {{legend-line|#138808 solid 3px|10 year }} | ||
| Line 962: | Line 969: | ||
Prime Minister [[Indira Gandhi]] nationalised 14 banks in 1969, followed by six others in 1980, and made it mandatory for banks to provide 40% of their net credit to priority sectors including agriculture, small-scale industry, retail trade and small business, to ensure that the banks fulfilled their social and developmental goals. Since then, the number of bank branches has increased from 8,260 in 1969 to 72,170 in 2007 and the population covered by a branch decreased from 63,800 to 15,000 during the same period. The total [[bank deposit]]s increased from {{INRConvert|59.1|b|year=1971}} in 1970–71 to {{INRConvert|38.31|t|year=2009}} in 2008–09. Despite an increase of rural branches – from 1,860 or 22% of the total in 1969 to 30,590 or 42% in 2007 – only 32,270 of 500,000 villages are served by a scheduled bank.<ref name="ghosh">{{cite web|title=Bank Nationalisation: The Record |work=Macroscan |url=http://www.macroscan.com/cur/jul05/cur210705Bank_Nationalisation.htm |publisher=Economic Research Foundation |date=21 July 2005 |first=Jayati |last=Ghosh |access-date=11 January 2011 |url-status=dead |archive-url=https://web.archive.org/web/20051023070928/http://www.macroscan.com/cur/jul05/cur210705Bank_Nationalisation.htm |archive-date=23 October 2005 }}</ref><ref name="Datt-7">{{Harvnb|Datt|Sundharam|2009|pp=839–842}}</ref> | Prime Minister [[Indira Gandhi]] nationalised 14 banks in 1969, followed by six others in 1980, and made it mandatory for banks to provide 40% of their net credit to priority sectors including agriculture, small-scale industry, retail trade and small business, to ensure that the banks fulfilled their social and developmental goals. Since then, the number of bank branches has increased from 8,260 in 1969 to 72,170 in 2007 and the population covered by a branch decreased from 63,800 to 15,000 during the same period. The total [[bank deposit]]s increased from {{INRConvert|59.1|b|year=1971}} in 1970–71 to {{INRConvert|38.31|t|year=2009}} in 2008–09. Despite an increase of rural branches – from 1,860 or 22% of the total in 1969 to 30,590 or 42% in 2007 – only 32,270 of 500,000 villages are served by a scheduled bank.<ref name="ghosh">{{cite web|title=Bank Nationalisation: The Record |work=Macroscan |url=http://www.macroscan.com/cur/jul05/cur210705Bank_Nationalisation.htm |publisher=Economic Research Foundation |date=21 July 2005 |first=Jayati |last=Ghosh |access-date=11 January 2011 |url-status=dead |archive-url=https://web.archive.org/web/20051023070928/http://www.macroscan.com/cur/jul05/cur210705Bank_Nationalisation.htm |archive-date=23 October 2005 }}</ref><ref name="Datt-7">{{Harvnb|Datt|Sundharam|2009|pp=839–842}}</ref> | ||
India's gross domestic [[saving]]s in 2006–07 as a percentage of GDP stood at a high 32.8%.<ref>{{Harvnb|Datt|Sundharam|2009|pp=334–335}}</ref> More than half of personal savings are invested in physical assets such as land, houses, cattle, and gold.<ref>{{cite web|url=http://unpan1.un.org/intradoc/groups/public/documents/APCITY/UNPAN028982.pdf|title=Reforming India's Financial System|first=Diana|last=Farrell|author2=Susan Lund|publisher=United Nations Public Administration Network|access-date=11 January 2011|archive-date=3 March 2016|archive-url=https://web.archive.org/web/20160303223047/http://unpan1.un.org/intradoc/groups/public/documents/APCITY/UNPAN028982.pdf|url-status=dead}}</ref> The government-owned public-sector banks hold over 75% of total assets of the banking industry, with the private and foreign banks holding 18.2% and 6.5% respectively.<ref name="factual">{{cite news|url=http://www.livemint.com/2007/09/01001100/India-growth-story-is-attracti.html|title= India growth story is attracting talent from govt establishments|newspaper=Mint|date=1 September 2007|first=Jeetha|last=D'Silva|access-date=11 January 2011}}</ref> Since liberalisation, the government has approved significant banking reforms. While some of these relate to nationalised banks – such as reforms encouraging mergers, reducing government interference and increasing profitability and competitiveness – other reforms have opened the banking and insurance sectors to private and foreign companies.<ref name="CIA" /><ref name="Datt-8">{{Harvnb|Datt|Sundharam|2009|pp=854–855}}</ref> | India's gross domestic [[saving]]s in 2006–07 as a percentage of GDP stood at a high 32.8%.<ref>{{Harvnb|Datt|Sundharam|2009|pp=334–335}}</ref> More than half of personal savings are invested in physical assets such as land, houses, cattle, and gold.<ref>{{cite web|url=http://unpan1.un.org/intradoc/groups/public/documents/APCITY/UNPAN028982.pdf|title=Reforming India's Financial System|first=Diana|last=Farrell|author2=Susan Lund|publisher=United Nations Public Administration Network|access-date=11 January 2011|archive-date=3 March 2016|archive-url=https://web.archive.org/web/20160303223047/http://unpan1.un.org/intradoc/groups/public/documents/APCITY/UNPAN028982.pdf|url-status=dead}}</ref> The government-owned public-sector banks hold over 75% of total assets of the banking industry, with the private and foreign banks holding 18.2% and 6.5% respectively.<ref name="factual">{{cite news|url=http://www.livemint.com/2007/09/01001100/India-growth-story-is-attracti.html|title=India growth story is attracting talent from govt establishments|newspaper=Mint|date=1 September 2007|first=Jeetha|last=D'Silva|access-date=11 January 2011|archive-date=28 December 2010|archive-url=https://web.archive.org/web/20101228082124/http://www.livemint.com/2007/09/01001100/India-growth-story-is-attracti.html|url-status=live}}</ref> Since liberalisation, the government has approved significant banking reforms. While some of these relate to nationalised banks – such as reforms encouraging mergers, reducing government interference and increasing profitability and competitiveness – other reforms have opened the banking and insurance sectors to private and foreign companies.<ref name="CIA" /><ref name="Datt-8">{{Harvnb|Datt|Sundharam|2009|pp=854–855}}</ref> | ||
==== Financial technology ==== | ==== Financial technology ==== | ||
{{Main|FinTech in India}} | {{Main|FinTech in India}} | ||
According to the report of The National Association of Software and Services Companies ([[NASSCOM]]), India has a presence of around 400 companies in the fintech space, with an investment of about $420 million in 2015.<ref name="FE">{{cite news | url=http://www.financialexpress.com/article/industry/companies/towards-a-fintech-revolution/262870/ | title=Fintech revolution in India: Tech-finance collaboration has fired up entrepreneurs | newspaper=[[The Financial Express (India)|The Financial Express]] | date=23 May 2016 | access-date=23 May 2016 | url-status=dead | archive-url=https://web.archive.org/web/20160526084504/http://www.financialexpress.com/article/industry/companies/towards-a-fintech-revolution/262870/ | archive-date=26 May 2016 | df=dmy-all }}</ref> The Indian fintech landscape is segmented as follows – 34% in payment processing, followed by 32% in banking and 12% in the trading, public and private markets.<ref>{{cite news | url=http://www.zdnet.com/article/india-emerging-as-fastest-growing-market-for-fintech-software-products/ | title=India emerging as fastest-growing market for fintech software products | publisher=[[ZDNet]] | date=3 May 2016 | access-date=22 May 2016}}</ref> | According to the report of The National Association of Software and Services Companies ([[NASSCOM]]), India has a presence of around 400 companies in the fintech space, with an investment of about $420 million in 2015.<ref name="FE">{{cite news | url=http://www.financialexpress.com/article/industry/companies/towards-a-fintech-revolution/262870/ | title=Fintech revolution in India: Tech-finance collaboration has fired up entrepreneurs | newspaper=[[The Financial Express (India)|The Financial Express]] | date=23 May 2016 | access-date=23 May 2016 | url-status=dead | archive-url=https://web.archive.org/web/20160526084504/http://www.financialexpress.com/article/industry/companies/towards-a-fintech-revolution/262870/ | archive-date=26 May 2016 | df=dmy-all }}</ref> The Indian fintech landscape is segmented as follows – 34% in payment processing, followed by 32% in banking and 12% in the trading, public and private markets.<ref>{{cite news | url=http://www.zdnet.com/article/india-emerging-as-fastest-growing-market-for-fintech-software-products/ | title=India emerging as fastest-growing market for fintech software products | publisher=[[ZDNet]] | date=3 May 2016 | access-date=22 May 2016 | archive-date=27 May 2016 | archive-url=https://web.archive.org/web/20160527170128/http://www.zdnet.com/article/india-emerging-as-fastest-growing-market-for-fintech-software-products/ | url-status=live }}</ref> | ||
The Fintech growing at a compound annual growth rate (CAGR) of 22 percent during 2022 and 2030. The overall fintech market in estimated to grow to about 2.1 trillion dollars. | The Fintech growing at a compound annual growth rate (CAGR) of 22 percent during 2022 and 2030. The overall fintech market in estimated to grow to about 2.1 trillion dollars. | ||
==== Information technology ==== | ==== Information technology ==== | ||
{{Main||Information technology in India|Business process outsourcing in India}} | {{Main|AI Companies of India|Information technology in India|Business process outsourcing in India}} | ||
[[File:Cyber City View.jpg|thumb | [[File:Cyber City View.jpg|thumb|[[DLF (company)|DLF]] [[Cyber City, Gurgaon]] houses multiple Fortune 500 companies in [[Gurgaon]] ]] | ||
[[File:Magarpatta- city-pune.jpg|thumb | [[File:Magarpatta- city-pune.jpg|thumb|[[Magarpatta|Cyber City, Pune]], biggest IT township in India]] | ||
The information technology (IT) industry in India consists of two major components: [[IT Services]] and [[business process outsourcing]] (BPO). The sector has increased its contribution to India's GDP from 1.2% in 1998 to 7.5% in 2012.<ref name="nasscom">{{cite web | url = http://www.nasscom.in/indian-itbpo-industry | title = Indian IT-BPO Industry | work = [[NASSCOM]] | access-date = 15 December 2012 | url-status=dead | archive-url = https://web.archive.org/web/20121220032358/http://www.nasscom.in/indian-itbpo-industry | archive-date = 20 December 2012 | df = dmy-all }}</ref> According to [[NASSCOM]], the sector aggregated revenues of {{USD}}147 billion in 2015, where export revenue stood at {{USD}}99 billion and domestic at {{USD}}48 billion, growing by over 13%.<ref name="nasscom" /> The [[Information technology in India|Indian IT industry]] is a major exporter of [[IT services]] with $227 billion in revenue and employs over 5 million people.<ref>{{cite web|title=indian iT and BPM Industry Analysis Presentation Industry Report|url=https://www.ibef.org/industry/indian-it-and-ites-industry-analysis-presentation|access-date=17 June 2022}}</ref> | The information technology (IT) industry in India consists of two major components: [[IT Services]] and [[business process outsourcing]] (BPO). The sector has increased its contribution to India's GDP from 1.2% in 1998 to 7.5% in 2012.<ref name="nasscom">{{cite web | url = http://www.nasscom.in/indian-itbpo-industry | title = Indian IT-BPO Industry | work = [[NASSCOM]] | access-date = 15 December 2012 | url-status=dead | archive-url = https://web.archive.org/web/20121220032358/http://www.nasscom.in/indian-itbpo-industry | archive-date = 20 December 2012 | df = dmy-all }}</ref> According to [[NASSCOM]], the sector aggregated revenues of {{USD}}147 billion in 2015, where export revenue stood at {{USD}}99 billion and domestic at {{USD}}48 billion, growing by over 13%.<ref name="nasscom" /> The [[Information technology in India|Indian IT industry]] is a major exporter of [[IT services]] with $227 billion in revenue and employs over 5 million people.<ref>{{cite web|title=indian iT and BPM Industry Analysis Presentation Industry Report|url=https://www.ibef.org/industry/indian-it-and-ites-industry-analysis-presentation|access-date=17 June 2022|archive-date=2 July 2022|archive-url=https://web.archive.org/web/20220702011719/https://www.ibef.org/industry/indian-it-and-ites-industry-analysis-presentation|url-status=live}}</ref> | ||
The growth in the IT sector is attributed to increased specialisation, and an availability of a large pool of low-cost, highly skilled, fluent English-speaking workers – matched by increased demand from foreign consumers interested in India's service exports, or looking to [[outsourcing|outsource]] their operations. The share of the [[Indian IT industry]] in the country's GDP increased from 4.8% in 2005–06 to 7% in 2008.<ref name="Indian IT">{{cite news|title=The Coming Death of Indian Outsourcing|work=Forbes| url=https://www.forbes.com/home/enterprisetech/2008/02/29/mitra-india-outsourcing-tech-enter-cx_sm_0229outsource.html| archive-url=https://web.archive.org/web/20080303000859/http://www.forbes.com/home/enterprisetech/2008/02/29/mitra-india-outsourcing-tech-enter-cx_sm_0229outsource.html| url-status=dead| archive-date=3 March 2008|date=29 February 2008|first=Sramana|last=Mitra|access-date=10 January 2010}}</ref> In 2009, seven Indian firms were listed among the top 15 technology outsourcing companies in the world.<ref>{{cite news|first=Niraj|last=Sheth|url=https://www.wsj.com/articles/SB124344190542659025#project%3DOUTSOURCING09%26articleTabs%3Dinteractive |title=Outlook for Outsourcing |newspaper=[[The Wall Street Journal]] |date=28 May 2009 |access-date=5 April 2010}}</ref> | The growth in the IT sector is attributed to increased specialisation, and an availability of a large pool of low-cost, highly skilled, fluent English-speaking workers – matched by increased demand from foreign consumers interested in India's service exports, or looking to [[outsourcing|outsource]] their operations. The share of the [[Indian IT industry]] in the country's GDP increased from 4.8% in 2005–06 to 7% in 2008.<ref name="Indian IT">{{cite news|title=The Coming Death of Indian Outsourcing|work=Forbes| url=https://www.forbes.com/home/enterprisetech/2008/02/29/mitra-india-outsourcing-tech-enter-cx_sm_0229outsource.html| archive-url=https://web.archive.org/web/20080303000859/http://www.forbes.com/home/enterprisetech/2008/02/29/mitra-india-outsourcing-tech-enter-cx_sm_0229outsource.html| url-status=dead| archive-date=3 March 2008|date=29 February 2008|first=Sramana|last=Mitra|access-date=10 January 2010}}</ref> In 2009, seven Indian firms were listed among the top 15 technology outsourcing companies in the world.<ref>{{cite news |first=Niraj |last=Sheth |url=https://www.wsj.com/articles/SB124344190542659025#project%3DOUTSOURCING09%26articleTabs%3Dinteractive |title=Outlook for Outsourcing |newspaper=[[The Wall Street Journal]] |date=28 May 2009 |access-date=5 April 2010 |archive-date=24 March 2021 |archive-url=https://web.archive.org/web/20210324131237/https://www.wsj.com/articles/SB124344190542659025#project%3DOUTSOURCING09%26articleTabs%3Dinteractive |url-status=live }}</ref> | ||
The [[business process outsourcing]] services in the outsourcing industry in India caters mainly to Western operations of [[multinational corporation]]s. {{As of|2012|post=,}} around 2.8 million people work in the outsourcing sector.<ref name="feout" /> Annual revenues are around $11 billion,<ref name="feout">{{cite news|url=http://www.financialexpress.com/news/indias-outsourcing-revenue-to-hit-50-bn/266661/|title=India's outsourcing revenue to hit $50 bn|newspaper=The Financial Express|year=2008}}</ref> around 1% of GDP. Around 2.5 million people graduate in India every year. Wages are rising by 10–15 percent as a result of skill shortages.<ref name="feout" /> | The [[business process outsourcing]] services in the outsourcing industry in India caters mainly to Western operations of [[multinational corporation]]s. {{As of|2012|post=,}} around 2.8 million people work in the outsourcing sector.<ref name="feout" /> Annual revenues are around $11 billion,<ref name="feout">{{cite news|url=http://www.financialexpress.com/news/indias-outsourcing-revenue-to-hit-50-bn/266661/|title=India's outsourcing revenue to hit $50 bn|newspaper=The Financial Express|year=2008|access-date=18 November 2016|archive-date=11 August 2014|archive-url=https://web.archive.org/web/20140811152108/http://www.financialexpress.com/news/indias-outsourcing-revenue-to-hit-50-bn/266661|url-status=live}}</ref> around 1% of GDP. Around 2.5 million people graduate in India every year. Wages are rising by 10–15 percent as a result of skill shortages.<ref name="feout" /> | ||
==== Insurance ==== | ==== Insurance ==== | ||
{{Main|Insurance in India}} | {{Main|Insurance in India}} | ||
[[File:LIC Zonal Office.jpg|right|thumb|[[Life Insurance Corporation|LIC Zonal Office]] in Connaught Place,New Delhi opened in 1986]] | [[File:LIC Zonal Office.jpg|right|thumb|[[Life Insurance Corporation|LIC Zonal Office]] in [[Connaught Place, New Delhi]] opened in 1986]] | ||
India became the tenth-largest insurance market in the world in 2013, rising from 15th in 2011.<ref>Ernst & Young, [http://www.ey.com/Publication/vwLUAssets/Insurance_industry_-_challenges_reforms_and_realignment/$FILE/EY-Insurance-industry-challenges-reforms-realignment.pdf Insurance industry: Challenges, reforms and realignment] {{Webarchive|url=https://web.archive.org/web/20141017194908/http://www.ey.com/Publication/vwLUAssets/Insurance_industry_-_challenges_reforms_and_realignment/$FILE/EY-Insurance-industry-challenges-reforms-realignment.pdf |date=17 October 2014 }} India (2012)</ref><ref>IBEF, Insurance Industry in India, [http://www.ibef.org/industry/insurance-presentation Sectoral Presentation], Ministry of Finance, Government of India (October 2014)</ref> At a total market size of US$66.4 billion in 2013, it remains small compared to world's major economies,<ref name="ibefinsure" /> and the Indian insurance market accounted for just 2% of the world's insurance business in 2017. India's life and non-life insurance industry collected {{INRConvert|6.1|t|lk=on}} in total gross insurance premiums in 2018. Life insurance accounts for 75.41% of the insurance market and the rest is general insurance.<ref>{{cite web |title=Insurance penetration in India grows just 1% in last one and half decade; These six charts explain why |url=https://www.firstpost.com/business/insurance-penetration-in-india-grows-just-1-in-last-one-and-half-decade-these-six-charts-explain-why-5953351.html |website=Firstpost |date=25 January 2019 |access-date=27 January 2019}}</ref> Of the 52 insurance companies in India, 24 are active in life-insurance business.<ref name="ibefinsure">IBEF, [http://www.ibef.org/industry/insurance-sector-india.aspx Insurance Sector in India] April 2014 Industry Report</ref> | India became the tenth-largest insurance market in the world in 2013, rising from 15th in 2011.<ref>Ernst & Young, [http://www.ey.com/Publication/vwLUAssets/Insurance_industry_-_challenges_reforms_and_realignment/$FILE/EY-Insurance-industry-challenges-reforms-realignment.pdf Insurance industry: Challenges, reforms and realignment] {{Webarchive|url=https://web.archive.org/web/20141017194908/http://www.ey.com/Publication/vwLUAssets/Insurance_industry_-_challenges_reforms_and_realignment/$FILE/EY-Insurance-industry-challenges-reforms-realignment.pdf |date=17 October 2014 }} India (2012)</ref><ref>IBEF, Insurance Industry in India, [http://www.ibef.org/industry/insurance-presentation Sectoral Presentation] {{Webarchive|url=https://web.archive.org/web/20161121032630/http://www.ibef.org/industry/insurance-presentation |date=21 November 2016 }}, Ministry of Finance, Government of India (October 2014)</ref> At a total market size of US$66.4 billion in 2013, it remains small compared to world's major economies,<ref name="ibefinsure" /> and the Indian insurance market accounted for just 2% of the world's insurance business in 2017. India's life and non-life insurance industry collected {{INRConvert|6.1|t|lk=on}} in total gross insurance premiums in 2018. Life insurance accounts for 75.41% of the insurance market and the rest is general insurance.<ref>{{cite web |title=Insurance penetration in India grows just 1% in last one and half decade; These six charts explain why |url=https://www.firstpost.com/business/insurance-penetration-in-india-grows-just-1-in-last-one-and-half-decade-these-six-charts-explain-why-5953351.html |website=Firstpost |date=25 January 2019 |access-date=27 January 2019 |archive-date=27 January 2019 |archive-url=https://web.archive.org/web/20190127205710/https://www.firstpost.com/business/insurance-penetration-in-india-grows-just-1-in-last-one-and-half-decade-these-six-charts-explain-why-5953351.html |url-status=live }}</ref> Of the 52 insurance companies in India, 24 are active in life-insurance business.<ref name="ibefinsure">IBEF, [http://www.ibef.org/industry/insurance-sector-india.aspx Insurance Sector in India] {{Webarchive|url=https://web.archive.org/web/20161221215333/http://www.ibef.org/industry/insurance-sector-india.aspx |date=21 December 2016 }} April 2014 Industry Report</ref> | ||
Specialised insurers [[Export Credit Guarantee Corporation of India|Export Credit Guarantee Corporation]] and [[Agriculture Insurance Company]] (AIC) offer credit guarantee and crop insurance. It has introduced several innovative products such as weather insurance and insurance related to specific crops. The premium underwritten by the non-life insurers during 2010–11 was {{INRConvert|425|b|lk=on|year=2011}} against {{INRConvert|346|b|year=2010}} in 2009–10. The growth was satisfactory,{{according to whom|date=June 2017}} particularly given across-the-broad cuts in the tariff rates. The private insurers underwrote premiums of {{INRConvert|174|b|year=2011}} against {{INRConvert|140|b|year=2010}} in 2009–10. | Specialised insurers [[Export Credit Guarantee Corporation of India|Export Credit Guarantee Corporation]] and [[Agriculture Insurance Company]] (AIC) offer credit guarantee and crop insurance. It has introduced several innovative products such as weather insurance and insurance related to specific crops. The premium underwritten by the non-life insurers during 2010–11 was {{INRConvert|425|b|lk=on|year=2011}} against {{INRConvert|346|b|year=2010}} in 2009–10. The growth was satisfactory,{{according to whom|date=June 2017}} particularly given across-the-broad cuts in the tariff rates. The private insurers underwrote premiums of {{INRConvert|174|b|year=2011}} against {{INRConvert|140|b|year=2010}} in 2009–10. | ||
| Line 994: | Line 1,001: | ||
[[File:World Trade Park Mall.gif|thumb|[[World Trade Park, Jaipur|World Trade Park]], Shopping mall in Jaipur]] | [[File:World Trade Park Mall.gif|thumb|[[World Trade Park, Jaipur|World Trade Park]], Shopping mall in Jaipur]] | ||
[[File:City Centre - Rajarhat 7481.JPG|thumb|[[City Center metro station|City Centre Mall]] in Kolkata]] | [[File:City Centre - Rajarhat 7481.JPG|thumb|[[City Center metro station|City Centre Mall]] in Kolkata]] | ||
The retail industry, excluding wholesale, contributed $793 billion (10% of GDP) and employed 35 million people (8% of the workforce) in 2020. The industry is the second largest employer in India, after agriculture.<ref>{{cite journal |author1=Arpita Mukherjee |author2=Tanu M. Goyal|title=Employment Conditions in Organised and Unorganised Retail: Implications for FDI Policy in India|journal=Journal of Business and Retail Management Research|date=April 2012|volume=6|issue=2|doi=10.24052/JBRMR/97|doi-broken-date=1 August 2023 }}</ref><ref>{{cite news|title=The Uneasy Compromise – Indian Retail|last=Dikshit|first=Anand|work=[[The Wall Street Journal]]|date=12 August 2011 | The retail industry, excluding wholesale, contributed $793 billion (10% of GDP) and employed 35 million people (8% of the workforce) in 2020. The industry is the second largest employer in India, after agriculture.<ref>{{cite journal |author1=Arpita Mukherjee |author2=Tanu M. Goyal|title=Employment Conditions in Organised and Unorganised Retail: Implications for FDI Policy in India|journal=Journal of Business and Retail Management Research|date=April 2012|volume=6|issue=2|doi=10.24052/JBRMR/97|doi-broken-date=1 August 2023 }}</ref><ref>{{cite news|title=The Uneasy Compromise – Indian Retail|last=Dikshit|first=Anand|work=[[The Wall Street Journal]]|date=12 August 2011|url=https://www.wsj.com/articles/SB10001424053111903461104576461540616622966|access-date=30 April 2022|archive-date=30 April 2022|archive-url=https://web.archive.org/web/20220430204532/https://www.wsj.com/articles/SB10001424053111903461104576461540616622966|url-status=live}}</ref><ref>{{cite web | url=https://www.investindia.gov.in/sector/retail-e-commerce#:~:text=The%20Indian%20retail%20market%20is%20largely%20unorganized.,to%20reach%2018%25%20by%202025. | title=Retail Industry in India – Indian Retail Sector, Market Size | access-date=30 April 2022 | archive-date=9 May 2022 | archive-url=https://web.archive.org/web/20220509125326/https://www.investindia.gov.in/sector/retail-e-commerce#:~:text=The%20Indian%20retail%20market%20is%20largely%20unorganized.,to%20reach%2018%25%20by%202025. | url-status=live }}</ref><ref>[https://nasscom.in/sites/default/files/media_pdf/NASSCOM_Press_Release_NASSCOM_RETAIL_4_REPORT%20.pdf NASSCOM press release] {{Webarchive|url=https://web.archive.org/web/20220430210254/https://nasscom.in/sites/default/files/media_pdf/NASSCOM_Press_Release_NASSCOM_RETAIL_4_REPORT%20.pdf |date=30 April 2022 }} NASSCOM. 8 March 2021. Retrieved 29 November 2022</ref> The Indian retail market is estimated to be US$600 billion and one of the top-five retail markets in the world by economic value. India has one of the fastest-growing retail markets in the world,<ref>{{cite web|title=Winning the Indian consumer|publisher=McKinsey & Company|year=2005|url=http://www.mckinseyquarterly.com/Marketing/Sectors_Regions/Winning_the_Indian_consumer_1659?gp=1|access-date=28 June 2012|archive-date=26 January 2013|archive-url=https://web.archive.org/web/20130126161914/http://www.mckinseyquarterly.com/Marketing/Sectors_Regions/Winning_the_Indian_consumer_1659?gp=1|url-status=dead}}</ref><ref>{{cite news| url=https://www.bbc.co.uk/news/world-asia-india-15885055| first=Sanjoy| last=Majumder| title=Changing the way Indians shop| work=BBC News| date=25 November 2011| access-date=22 June 2018| archive-date=1 November 2018| archive-url=https://web.archive.org/web/20181101094039/https://www.bbc.co.uk/news/world-asia-india-15885055| url-status=live}}</ref> and is projected to reach $1.3 trillion by 2020.<ref name="pwc12tik">[http://www.pwc.in/en_IN/in/assets/pdfs/industries/retail-and-consumer/retail-report-300812.pdf The Indian Kaleidoscope – Emerging trends in retail] {{Webarchive|url=https://web.archive.org/web/20130228033058/http://www.pwc.in/en_IN/in/assets/pdfs/industries/retail-and-consumer/retail-report-300812.pdf |date=28 February 2013 }} PWC (2012)</ref><ref>[http://www.strategyand.pwc.com/media/file/RAI_Strategyand_Successful-Innovations-in-Indian-Retail.pdf Successful Innovations in Indian Retail] {{webarchive|url=https://web.archive.org/web/20140808025059/http://www.strategyand.pwc.com/media/file/RAI_Strategyand_Successful-Innovations-in-Indian-Retail.pdf |date= 8 August 2014 }} Booz Allen & PwC (February 2013)</ref> India has [[Retailing in India|retail market]] worth $1.17 trillion, which contributes over 10% of India's GDP. It also has one of the world's fastest growing [[e-commerce]] markets.<ref>{{cite news|url=https://www.ibef.org/industry/retail-india.aspx|website=ibef.org|title=Retail industry in India|access-date=22 June 2019|archive-date=21 February 2021|archive-url=https://web.archive.org/web/20210221032409/https://www.ibef.org/industry/retail-india.aspx|url-status=live}}</ref> The e-commerce retail market in India was valued at $32.7 billion in 2018, and is expected to reach $71.9 billion by 2022.<ref>{{cite web |title=Market Realist |url=https://marketrealist.com/2019/01/what-next-for-amazon-in-india-amid-new-retail-rules |website=marketrealist.com |date=7 January 2019 |access-date=27 January 2019 |archive-date=28 January 2019 |archive-url=https://web.archive.org/web/20190128030300/https://marketrealist.com/2019/01/what-next-for-amazon-in-india-amid-new-retail-rules |url-status=live }}</ref> | ||
|url=https://www.wsj.com/articles/SB10001424053111903461104576461540616622966}}</ref><ref>{{cite web| url=https://www.investindia.gov.in/sector/retail-e-commerce#:~:text=The%20Indian%20retail%20market%20is%20largely%20unorganized.,to%20reach%2018%25%20by%202025. | title=Retail Industry in India – Indian Retail Sector, Market Size }}</ref><ref>[https://nasscom.in/sites/default/files/media_pdf/NASSCOM_Press_Release_NASSCOM_RETAIL_4_REPORT%20.pdf NASSCOM press release] NASSCOM. 8 March 2021. Retrieved 29 November 2022</ref> The Indian retail market is estimated to be US$600 billion and one of the top-five retail markets in the world by economic value. India has one of the fastest-growing retail markets in the world,<ref>{{cite web|title=Winning the Indian consumer|publisher=McKinsey & Company|year=2005|url=http://www.mckinseyquarterly.com/Marketing/Sectors_Regions/Winning_the_Indian_consumer_1659?gp=1|access-date=28 June 2012|archive-date=26 January 2013|archive-url=https://web.archive.org/web/20130126161914/http://www.mckinseyquarterly.com/Marketing/Sectors_Regions/Winning_the_Indian_consumer_1659?gp=1|url-status=dead}}</ref><ref>{{cite news| url=https://www.bbc.co.uk/news/world-asia-india-15885055| first=Sanjoy|last=Majumder|title= Changing the way Indians shop|work=BBC News|date = 25 November 2011}}</ref> and is projected to reach $1.3 trillion by 2020.<ref name="pwc12tik">[http://www.pwc.in/en_IN/in/assets/pdfs/industries/retail-and-consumer/retail-report-300812.pdf The Indian Kaleidoscope – Emerging trends in retail] PWC (2012)</ref><ref>[http://www.strategyand.pwc.com/media/file/RAI_Strategyand_Successful-Innovations-in-Indian-Retail.pdf Successful Innovations in Indian Retail] {{webarchive|url=https://web.archive.org/web/20140808025059/http://www.strategyand.pwc.com/media/file/RAI_Strategyand_Successful-Innovations-in-Indian-Retail.pdf |date= 8 August 2014 }} Booz Allen & PwC (February 2013)</ref> India has [[Retailing in India|retail market]] worth $1.17 trillion, which contributes over 10% of India's GDP. It also has one of the world's fastest growing [[e-commerce]] markets.<ref>{{cite news|url=https://www.ibef.org/industry/retail-india.aspx|website=ibef.org|title=Retail industry in India |access-date=22 June 2019}}</ref> The e-commerce retail market in India was valued at $32.7 billion in 2018, and is expected to reach $71.9 billion by 2022.<ref>{{cite web |title=Market Realist |url=https://marketrealist.com/2019/01/what-next-for-amazon-in-india-amid-new-retail-rules |website=marketrealist.com |date=7 January 2019 |access-date=27 January 2019}}</ref> | |||
India's retail industry mostly consists of local [[Small business|mom-and-pop stores]], owner-staffed shops and street vendors. Retail supermarkets are expanding, with a market share of 4% in 2008.<ref name="chainstores">{{cite news|url=http://www.economist.com/displayStory.cfm?story_id=11465586|title=Retailing in India: Unshackling the chain stores|newspaper=The Economist|date=29 May 2008|access-date=10 January 2010}}</ref> In 2012, the government permitted 51% FDI in multi-brand retail and 100% FDI in single-brand retail. However, a lack of back-end warehouse infrastructure and state-level permits and red tape continue to limit growth of organised retail.<ref>{{cite news |last1=Sharma |first1=Amol |last2=Mukherji |first2=Biman|url=https://www.wsj.com/news/articles/SB10001424127887323622904578129294224588914 |title=Bad Roads, Red Tape, Burly Thugs Slow Wal-Mart's Passage in India |newspaper=The Wall Street Journal |date=12 January 2013}}</ref> Compliance with over thirty regulations such as "signboard licences" and "anti-hoarding measures" must be made before a store can open for business. There are taxes for moving goods from state to state, and even within states.<ref name="chainstores" /> According to ''The Wall Street Journal'', the lack of infrastructure and efficient retail networks cause a third of India's agriculture produce to be lost from spoilage.<ref name="India's Food Transportation Ordeal">{{cite news|url=https://www.wsj.com/news/articles/SB10001424127887324907204578187122310400706|title=India's Food Transportation Ordeal|work=The Wall Street Journal|date=11 January 2013}}</ref> | India's retail industry mostly consists of local [[Small business|mom-and-pop stores]], owner-staffed shops and street vendors. Retail supermarkets are expanding, with a market share of 4% in 2008.<ref name="chainstores">{{cite news|url=http://www.economist.com/displayStory.cfm?story_id=11465586|title=Retailing in India: Unshackling the chain stores|newspaper=The Economist|date=29 May 2008|access-date=10 January 2010|archive-date=6 October 2008|archive-url=https://web.archive.org/web/20081006022549/http://www.economist.com/displayStory.cfm?story_id=11465586|url-status=live}}</ref> In 2012, the government permitted 51% FDI in multi-brand retail and 100% FDI in single-brand retail. However, a lack of back-end warehouse infrastructure and state-level permits and red tape continue to limit growth of organised retail.<ref>{{cite news |last1=Sharma |first1=Amol |last2=Mukherji |first2=Biman |url=https://www.wsj.com/news/articles/SB10001424127887323622904578129294224588914 |title=Bad Roads, Red Tape, Burly Thugs Slow Wal-Mart's Passage in India |newspaper=The Wall Street Journal |date=12 January 2013 |access-date=13 March 2017 |archive-date=23 April 2017 |archive-url=https://web.archive.org/web/20170423062452/https://www.wsj.com/news/articles/SB10001424127887323622904578129294224588914 |url-status=live }}</ref> Compliance with over thirty regulations such as "signboard licences" and "anti-hoarding measures" must be made before a store can open for business. There are taxes for moving goods from state to state, and even within states.<ref name="chainstores" /> According to ''The Wall Street Journal'', the lack of infrastructure and efficient retail networks cause a third of India's agriculture produce to be lost from spoilage.<ref name="India's Food Transportation Ordeal">{{cite news|url=https://www.wsj.com/news/articles/SB10001424127887324907204578187122310400706|title=India's Food Transportation Ordeal|work=The Wall Street Journal|date=11 January 2013|access-date=13 March 2017|archive-date=22 April 2017|archive-url=https://web.archive.org/web/20170422213022/https://www.wsj.com/news/articles/SB10001424127887324907204578187122310400706|url-status=live}}</ref> | ||
[[File:Nashik Clouds.jpg|thumb| [[List of forts in Maharashtra| | [[File:Nashik Clouds.jpg|thumb| [[List of forts in Maharashtra|The forts of Maharashtra]] are also called the "Green Canyons of India", and are very popular among trekkers]] | ||
==== Tourism ==== | ==== Tourism ==== | ||
| Line 1,005: | Line 1,011: | ||
]] | ]] | ||
[[File:Valley-of-flowers-in-Uttarakhand.jpg|thumb|[[Valley of Flowers National Park]], a UNESCO world heritage site]] | [[File:Valley-of-flowers-in-Uttarakhand.jpg|thumb|[[Valley of Flowers National Park]], a UNESCO world heritage site]] | ||
The [[World Travel and Tourism Council|World Travel & Tourism Council]] calculated that tourism generated {{INRConvert|15.24|t}} or 9.4% of the nation's GDP in 2017 and supported 41.622 million jobs, 8% of its total employment. The sector is predicted to grow at an annual rate of 6.9% to {{INRConvert|32.05|t}} by 2028 (9.9% of GDP).<ref>{{cite web|title=Travel & Tourism Economic Impact 2018 India|url=https://www.wttc.org/-/media/files/reports/economic-impact-research/countries-2018/india2018.pdf|publisher=[[World Travel and Tourism Council]]|access-date=22 March 2017|archive-date=22 March 2018|archive-url=https://web.archive.org/web/20180322143152/https://www.wttc.org/-/media/files/reports/economic-impact-research/countries-2018/india2018.pdf|url-status=dead}}</ref> Over 10 million foreign tourists arrived in India in 2017 compared to 8.89 million in 2016, recording a growth of 15.6%.<ref>{{cite news|last1=Team|first1=BS Web|title=India attracted 10 mn foreign tourists in 2017, sports to bring more|url=http://www.business-standard.com/article/economy-policy/india-attracted-10-mn-foreigners-in-2017-sports-to-bring-more-alphons-118011700293_1.html|website=Business Standard India|access-date=11 February 2018|date=17 January 2018}}</ref> The [[Tourism in India|tourism industry]] contributes about 9.2% of India's GDP and employs over 42 million people.<ref>{{cite web |title=2019 ANNUAL RESEARCH: KEY HIGHLIGHTS |url=https://www.wttc.org/-/media/files/reports/economic-impact-research/countries-2019/india2019.pdf |website=WTTC |access-date=15 March 2019|url-status=dead|archive-url=https://web.archive.org/web/20191230065707/https://www.wttc.org/-/media/files/reports/economic-impact-research/countries-2019/india2019.pdf|archive-date=2019-12-30}}</ref> India earned $21.07 billion in foreign exchange from tourism receipts in 2015.<ref>{{cite web |url=http://tourism.gov.in/sites/default/files/Other/India%20Tourism%20Book%20English.pdf |archive-url=https://web.archive.org/web/20160910140217/http://tourism.gov.in/sites/default/files/Other/India%20Tourism%20Book%20English.pdf |archive-date=2016-09-10 |title=India Tourism Statistics at a Glance 2015 |website=Ministry of Tourism}}</ref> International tourism to India has seen a steady growth from 2.37 million arrivals in 1997 to 8.03 million arrivals in 2015. [[Bangladesh]] is the largest source of international tourists to India, while European Union nations and Japan are other major sources of international tourists.<ref name="unwtoitp">[https://tourism.gov.in/sites/default/files/2021-09/English%20Tourisum%202021.pdf India's tourism performance] {{Webarchive|url=https://web.archive.org/web/20140808043955/http://asiapacific.unwto.org/sites/all/files/pdf/cap-csa-24-5b_ref_indias_report.pdf |date=8 August 2014 }} United Nations World Tourism Organization (2013)</ref><ref>[http://www2.unwto.org/publication/yearbook-tourism-statistics-data-2008-2012-2014-edition Yearbook of Tourism Statistics, Data 2008 – 2012, 2014 Edition] {{Webarchive|url=https://web.archive.org/web/20181201132717/http://www2.unwto.org/publication/yearbook-tourism-statistics-data-2008-2012-2014-edition |date=1 December 2018 }} United Nations World Tourism Organization (2014)</ref> Less than 10% of international tourists visit the [[Taj Mahal]], with the majority visiting other cultural, thematic and holiday circuits.<ref>RN Pandey, [http://statistics.unwto.org/sites/all/files/pdf/india_inbound_0.pdf Inbound Tourism Statistics of India] {{Webarchive|url=https://web.archive.org/web/20160528064125/http://statistics.unwto.org/sites/all/files/pdf/india_inbound_0.pdf |date=28 May 2016 }} Ministry of Tourism, Govt of India (2012)</ref> Over 12 million Indian citizens take international trips each year for tourism, while domestic tourism within India adds about 740 million Indian travellers.<ref name="unwtoitp" /> | The [[World Travel and Tourism Council|World Travel & Tourism Council]] calculated that tourism generated {{INRConvert|15.24|t}} or 9.4% of the nation's GDP in 2017 and supported 41.622 million jobs, 8% of its total employment. The sector is predicted to grow at an annual rate of 6.9% to {{INRConvert|32.05|t}} by 2028 (9.9% of GDP).<ref>{{cite web|title=Travel & Tourism Economic Impact 2018 India|url=https://www.wttc.org/-/media/files/reports/economic-impact-research/countries-2018/india2018.pdf|publisher=[[World Travel and Tourism Council]]|access-date=22 March 2017|archive-date=22 March 2018|archive-url=https://web.archive.org/web/20180322143152/https://www.wttc.org/-/media/files/reports/economic-impact-research/countries-2018/india2018.pdf|url-status=dead}}</ref> Over 10 million foreign tourists arrived in India in 2017 compared to 8.89 million in 2016, recording a growth of 15.6%.<ref>{{cite news|last1=Team|first1=BS Web|title=India attracted 10 mn foreign tourists in 2017, sports to bring more|url=http://www.business-standard.com/article/economy-policy/india-attracted-10-mn-foreigners-in-2017-sports-to-bring-more-alphons-118011700293_1.html|website=Business Standard India|access-date=11 February 2018|date=17 January 2018|archive-date=15 February 2018|archive-url=https://web.archive.org/web/20180215003052/http://www.business-standard.com/article/economy-policy/india-attracted-10-mn-foreigners-in-2017-sports-to-bring-more-alphons-118011700293_1.html|url-status=live}}</ref> The [[Tourism in India|tourism industry]] contributes about 9.2% of India's GDP and employs over 42 million people.<ref>{{cite web |title=2019 ANNUAL RESEARCH: KEY HIGHLIGHTS |url=https://www.wttc.org/-/media/files/reports/economic-impact-research/countries-2019/india2019.pdf |website=WTTC |access-date=15 March 2019|url-status=dead|archive-url=https://web.archive.org/web/20191230065707/https://www.wttc.org/-/media/files/reports/economic-impact-research/countries-2019/india2019.pdf|archive-date=2019-12-30}}</ref> India earned $21.07 billion in foreign exchange from tourism receipts in 2015.<ref>{{cite web |url=http://tourism.gov.in/sites/default/files/Other/India%20Tourism%20Book%20English.pdf |archive-url=https://web.archive.org/web/20160910140217/http://tourism.gov.in/sites/default/files/Other/India%20Tourism%20Book%20English.pdf |archive-date=2016-09-10 |title=India Tourism Statistics at a Glance 2015 |website=Ministry of Tourism}}</ref> International tourism to India has seen a steady growth from 2.37 million arrivals in 1997 to 8.03 million arrivals in 2015. [[Bangladesh]] is the largest source of international tourists to India, while European Union nations and Japan are other major sources of international tourists.<ref name="unwtoitp">[https://tourism.gov.in/sites/default/files/2021-09/English%20Tourisum%202021.pdf India's tourism performance] {{Webarchive|url=https://web.archive.org/web/20140808043955/http://asiapacific.unwto.org/sites/all/files/pdf/cap-csa-24-5b_ref_indias_report.pdf |date=8 August 2014 }} United Nations World Tourism Organization (2013)</ref><ref>[http://www2.unwto.org/publication/yearbook-tourism-statistics-data-2008-2012-2014-edition Yearbook of Tourism Statistics, Data 2008 – 2012, 2014 Edition] {{Webarchive|url=https://web.archive.org/web/20181201132717/http://www2.unwto.org/publication/yearbook-tourism-statistics-data-2008-2012-2014-edition |date=1 December 2018 }} United Nations World Tourism Organization (2014)</ref> Less than 10% of international tourists visit the [[Taj Mahal]], with the majority visiting other cultural, thematic and holiday circuits.<ref>RN Pandey, [http://statistics.unwto.org/sites/all/files/pdf/india_inbound_0.pdf Inbound Tourism Statistics of India] {{Webarchive|url=https://web.archive.org/web/20160528064125/http://statistics.unwto.org/sites/all/files/pdf/india_inbound_0.pdf |date=28 May 2016 }} Ministry of Tourism, Govt of India (2012)</ref> Over 12 million Indian citizens take international trips each year for tourism, while domestic tourism within India adds about 740 million Indian travellers.<ref name="unwtoitp" /> | ||
India has a fast-growing [[Medical tourism in India|medical tourism sector]] of its health care economy, offering low-cost health services and long-term care.<ref name="BMJ">{{cite journal |last=Mudur |first=Ganapati |date=June 2004 |title=Hospitals in India woo foreign patients |journal=[[British Medical Journal]] |volume=328 |issue= 7452|page=1338 |doi= 10.1136/bmj.328.7452.1338 |pmid=15178611 |pmc=420282}}</ref><ref>{{cite news|url=http://communities.washingtontimes.com/neighborhood/travelers-notebook/2013/aug/18/medical-tourism-draws-americans-india/ |title=Medical Tourism draws Americans to India|work=The Washington Times|date=18 August 2013}}</ref> In October 2015, the medical tourism sector was estimated to be worth US$3 billion. It is projected to grow to $7–8 billion by 2020.<ref>{{cite news|url=http://economictimes.indiatimes.com/industry/healthcare/biotech/healthcare/indian-medical-tourism-industry-to-touch-8-billion-by-2020-grant-thornton/articleshow/49615898.cms|title=Indian medical tourism industry to touch $8 billion by 2020: Grant Thornton – The Economic Times|website=The Economic Times|access-date=16 April 2016}}</ref> In 2014, 184,298 foreign patients traveled to India to seek medical treatment.<ref>{{cite web|title=Promotion of Medical Tourism|url=http://pib.nic.in/newsite/pmreleases.aspx?mincode=36|website=Press Information Bureau|access-date=28 April 2016}}</ref> | India has a fast-growing [[Medical tourism in India|medical tourism sector]] of its health care economy, offering low-cost health services and long-term care.<ref name="BMJ">{{cite journal |last=Mudur |first=Ganapati |date=June 2004 |title=Hospitals in India woo foreign patients |journal=[[British Medical Journal]] |volume=328 |issue= 7452|page=1338 |doi= 10.1136/bmj.328.7452.1338 |pmid=15178611 |pmc=420282}}</ref><ref>{{cite news|url=http://communities.washingtontimes.com/neighborhood/travelers-notebook/2013/aug/18/medical-tourism-draws-americans-india/|title=Medical Tourism draws Americans to India|work=The Washington Times|date=18 August 2013|access-date=30 July 2014|archive-date=11 August 2014|archive-url=https://web.archive.org/web/20140811054014/http://communities.washingtontimes.com/neighborhood/travelers-notebook/2013/aug/18/medical-tourism-draws-americans-india/|url-status=live}}</ref> In October 2015, the medical tourism sector was estimated to be worth US$3 billion. It is projected to grow to $7–8 billion by 2020.<ref>{{cite news|url=http://economictimes.indiatimes.com/industry/healthcare/biotech/healthcare/indian-medical-tourism-industry-to-touch-8-billion-by-2020-grant-thornton/articleshow/49615898.cms|title=Indian medical tourism industry to touch $8 billion by 2020: Grant Thornton – The Economic Times|website=The Economic Times|access-date=16 April 2016|archive-date=18 March 2017|archive-url=https://web.archive.org/web/20170318195634/http://economictimes.indiatimes.com/industry/healthcare/biotech/healthcare/indian-medical-tourism-industry-to-touch-8-billion-by-2020-grant-thornton/articleshow/49615898.cms|url-status=live}}</ref> In 2014, 184,298 foreign patients traveled to India to seek medical treatment.<ref>{{cite web|title=Promotion of Medical Tourism|url=http://pib.nic.in/newsite/pmreleases.aspx?mincode=36|website=Press Information Bureau|access-date=28 April 2016|archive-date=11 October 2016|archive-url=https://web.archive.org/web/20161011232253/http://pib.nic.in/newsite/pmreleases.aspx?mincode=36|url-status=live}}</ref> | ||
==== Healthcare ==== | ==== Healthcare and Travel Healthcare==== | ||
{{Main|Healthcare in India}} | {{Main|Healthcare in India}} | ||
[[File:Fortis Hospital Noida - panoramio.jpg|thumb|[[Fortis Healthcare|Fortis Hospitals]] in Noida, one of the | [[File:Fortis Hospital Noida - panoramio.jpg|thumb|[[Fortis Healthcare|Fortis Hospitals]] in [[Noida]], is one of the advanced and leading hospitals of India]] | ||
[[File:Max Building.jpg|thumb|Max Healthcare in New Delhi]] | [[File:Max Building.jpg|thumb|[[Max Healthcare]] in New Delhi]] | ||
[[File:Apollo Proton Cancer Centre, Chennai.jpg|thumb|[[Apollo Hospitals|Apollo]] Proton Cancer Centre in Chennai]] | [[File:Apollo Proton Cancer Centre, Chennai.jpg|thumb|[[Apollo Hospitals|Apollo]] Proton Cancer Centre in Chennai]] | ||
India's healthcare sector is expected to grow at a CAGR of 29% between 2015 and 2020, to reach US$280 billion, buoyed by rising incomes, greater health awareness, increased precedence of lifestyle diseases, and improved access to health insurance.<ref name="healthDNA" /> | India's healthcare sector is expected to grow at a CAGR of 29% between 2015 and 2020, to reach US$280 billion, buoyed by rising incomes, greater health awareness, increased precedence of lifestyle diseases, and improved access to health insurance.<ref name="healthDNA" /> | ||
The India hospital market size was valued at USD 93.6 billion in 2022, driven by the rise in the prevalence of chronic and infectious diseases across India. The market size is anticipated to grow at a CAGR of 5.75% during the forecast period of 2023-2031 to achieve a value of USD 154.8 billion by 2031.<ref>{{Cite web |url=https://www.niti.gov.in/sites/default/files/2023-02/InvestmentOpportunities_HealthcareSector.pdf |title=Archived copy |access-date=13 October 2023 |archive-date=15 October 2023 |archive-url=https://web.archive.org/web/20231015010251/http://niti.gov.in/sites/default/files/2023-02/InvestmentOpportunities_HealthcareSector.pdf |url-status=live }}</ref><ref>{{Cite web |url=https://www.medicalbuyer.co.in/india-hospital-market-size-to-hit-usd-154-8-billion-by-2031/ |title=Archived copy |access-date=13 October 2023 |archive-date=17 October 2023 |archive-url=https://web.archive.org/web/20231017181127/https://www.medicalbuyer.co.in/india-hospital-market-size-to-hit-usd-154-8-billion-by-2031/ |url-status=live }}</ref><ref>{{Cite web |url=https://www.livemint.com/Politics/rEsOz2HVZdBU8YPnz09BdO/EM-private-hospital-market-to-reach-240-billion-by-2020-re.html |title=Archived copy |access-date=13 October 2023 |archive-date=17 October 2023 |archive-url=https://web.archive.org/web/20231017175621/https://www.livemint.com/Politics/rEsOz2HVZdBU8YPnz09BdO/EM-private-hospital-market-to-reach-240-billion-by-2020-re.html |url-status=live }}</ref> | |||
The [[ayurveda]] industry in India recorded a market size of $4.4 billion in 2018. The Confederation of Indian Industry estimates that the industry will grow at a CAGR 16% until 2025. Nearly 75% of the market comprises over-the-counter personal care and beauty products, while ayurvedic well-being or ayurvedic tourism services accounted for 15% of the market.<ref>{{cite web |title=Indian ayurvedic industry to grow to $ 4.4 billion by the end of this year |url=https://economictimes.indiatimes.com/industry/healthcare/biotech/healthcare/indian-ayurvedic-industry-to-grow-to-4-4-billion-by-the-end-of-this-year/articleshow/66694089.cms |website=The Economic Times |access-date=26 November 2018 |date=19 November 2018}}</ref> | [[Medical tourism in India|Travel Healthcare]] is a growing sector in [[India]]. In 2022,According to [[Federation of Indian Chambers of Commerce & Industry|Federation of Indian Chambers of Commerce and Industry (FICCI)]] report, India's travel healthcare sector was estimated to be worth US$9 billion.<ref>{{Cite web |url=https://www.laingbuissonnews.com/imtj/news-imtj/india-medical-tourism-revenue-will-reach-us13-billion-by-2026/ |title=Archived copy |access-date=13 October 2023 |archive-date=17 October 2023 |archive-url=https://web.archive.org/web/20231017175623/https://www.laingbuissonnews.com/imtj/news-imtj/india-medical-tourism-revenue-will-reach-us13-billion-by-2026/ |url-status=live }}</ref><ref>{{Cite web |url=https://www.hindustantimes.com/lifestyle/travel/medical-tourism-in-india-top-destinations-scenarios-and-all-you-need-to-know-101668163467932.html |title=Archived copy |access-date=13 October 2023 |archive-date=17 October 2023 |archive-url=https://web.archive.org/web/20231017175622/https://www.hindustantimes.com/lifestyle/travel/medical-tourism-in-india-top-destinations-scenarios-and-all-you-need-to-know-101668163467932.html |url-status=live }}</ref> Approximately 2 million patients visit India each year from 78 countries for medical, wellness and IVF treatments, generating $6 billion for the industry which is expected to reach $13 billion by 2026 backed by the government’s Heal in India initiative.<ref>{{Cite web |url=https://www.hindustantimes.com/lifestyle/travel/medical-tourism-in-india-top-destinations-scenarios-and-all-you-need-to-know-101668163467932.html |title=Archived copy |access-date=13 October 2023 |archive-date=17 October 2023 |archive-url=https://web.archive.org/web/20231017175622/https://www.hindustantimes.com/lifestyle/travel/medical-tourism-in-india-top-destinations-scenarios-and-all-you-need-to-know-101668163467932.html |url-status=live }}</ref> | ||
The [[ayurveda]] industry in India recorded a market size of $4.4 billion in 2018. The Confederation of Indian Industry estimates that the industry will grow at a CAGR 16% until 2025. Nearly 75% of the market comprises over-the-counter personal care and beauty products, while ayurvedic well-being or ayurvedic tourism services accounted for 15% of the market.<ref>{{cite web |title=Indian ayurvedic industry to grow to $ 4.4 billion by the end of this year |url=https://economictimes.indiatimes.com/industry/healthcare/biotech/healthcare/indian-ayurvedic-industry-to-grow-to-4-4-billion-by-the-end-of-this-year/articleshow/66694089.cms |website=The Economic Times |access-date=26 November 2018 |date=19 November 2018 |archive-date=26 November 2018 |archive-url=https://web.archive.org/web/20181126092759/https://economictimes.indiatimes.com/industry/healthcare/biotech/healthcare/indian-ayurvedic-industry-to-grow-to-4-4-billion-by-the-end-of-this-year/articleshow/66694089.cms |url-status=live }}</ref> | |||
==== Logistics ==== | ==== Logistics ==== | ||
The [[logistics industry]] in India was worth over $160 billion in 2016, and grew at a CAGR of 7.8% in the previous five-year period. The industry employs about 22 million people.<ref>{{cite web|title=Economic Survey 2018: 5 states show the way with 70% of exports, enjoy higher standard of living|url=http://indianexpress.com/article/business/economy/economic-survey-five-states-show-the-way-with-70-of-exports-enjoy-higher-standard-of-living-union-budget-5044319/|website=The Indian Express|access-date=11 February 2018|date=30 January 2018}}</ref><ref>{{cite news|last1=Chakraborty|first1=Subhayan|title=Only 5 states account for 70% of exports, Economic Survey shows|url=http://www.business-standard.com/budget/article/only-5-states-account-for-70-of-exports-economic-survey-shows-118012900344_1.html|website=Business Standard India|access-date=11 February 2018|date=29 January 2018}}</ref> It is expected to reach of a size of $215 billion by 2020.<ref>{{cite web |last1=Vashistha |first1=Praveen |title=Future and Growth of Transportation Market by 2020 |url=https://www.entrepreneur.com/article/326552 |website=Entrepreneur |access-date=27 January 2019 |language=en |date=18 January 2019}}</ref> India was ranked 35th out of 160 countries in the World Bank's 2016 Logistics Performance Index.<ref>{{cite web|title=Global Rankings 2016 {{!}} Logistics Performance Index|url=https://lpi.worldbank.org/international/global?sort=desc&order=LPI%20Score#datatable|publisher=World Bank|access-date=11 February 2018|language=en}}</ref> | The [[logistics industry]] in India was worth over $160 billion in 2016, and grew at a CAGR of 7.8% in the previous five-year period. The industry employs about 22 million people.<ref>{{cite web|title=Economic Survey 2018: 5 states show the way with 70% of exports, enjoy higher standard of living|url=http://indianexpress.com/article/business/economy/economic-survey-five-states-show-the-way-with-70-of-exports-enjoy-higher-standard-of-living-union-budget-5044319/|website=The Indian Express|access-date=11 February 2018|date=30 January 2018|archive-date=12 February 2018|archive-url=https://web.archive.org/web/20180212084325/http://indianexpress.com/article/business/economy/economic-survey-five-states-show-the-way-with-70-of-exports-enjoy-higher-standard-of-living-union-budget-5044319/|url-status=live}}</ref><ref>{{cite news|last1=Chakraborty|first1=Subhayan|title=Only 5 states account for 70% of exports, Economic Survey shows|url=http://www.business-standard.com/budget/article/only-5-states-account-for-70-of-exports-economic-survey-shows-118012900344_1.html|website=Business Standard India|access-date=11 February 2018|date=29 January 2018|archive-date=12 February 2018|archive-url=https://web.archive.org/web/20180212084452/http://www.business-standard.com/budget/article/only-5-states-account-for-70-of-exports-economic-survey-shows-118012900344_1.html|url-status=live}}</ref> It is expected to reach of a size of $215 billion by 2020.<ref>{{cite web |last1=Vashistha |first1=Praveen |title=Future and Growth of Transportation Market by 2020 |url=https://www.entrepreneur.com/article/326552 |website=Entrepreneur |access-date=27 January 2019 |language=en |date=18 January 2019 |archive-date=27 January 2019 |archive-url=https://web.archive.org/web/20190127205637/https://www.entrepreneur.com/article/326552 |url-status=live }}</ref> India was ranked 35th out of 160 countries in the World Bank's 2016 Logistics Performance Index.<ref>{{cite web|title=Global Rankings 2016 {{!}} Logistics Performance Index|url=https://lpi.worldbank.org/international/global?sort=desc&order=LPI%20Score#datatable|publisher=World Bank|access-date=11 February 2018|language=en|archive-date=9 July 2017|archive-url=https://web.archive.org/web/20170709083245/https://lpi.worldbank.org/international/global?sort=desc&order=LPI%20Score#datatable|url-status=live}}</ref> | ||
==== Media and Press ==== | ==== Media and Press ==== | ||
| Line 1,024: | Line 1,033: | ||
{{See also|Gambling in India}} | {{See also|Gambling in India}} | ||
An [[ASSOCHAM]]-[[PwC]] joint study projected that the Indian media and entertainment industry would grow from a size of $30.364 billion in 2017 to $52.683 billion by 2022, recording a CAGR of 11.7%. The study also predicted that television, satellite dish, over-the-top services would account for nearly half of the overall industry growth during the period.<ref>{{cite web |title=Media and Entertainment Industry May Touch Rs 3.73 Lakh Crore by 2022: Study |url=https://www.news18.com/news/india/media-and-entertainment-industry-may-touch-rs-3-73-lakh-crore-by-2022-study-2015579.html |website=News18 |date=27 January 2019 |access-date=27 January 2019}}</ref> | An [[ASSOCHAM]]-[[PwC]] joint study projected that the Indian media and entertainment industry would grow from a size of $30.364 billion in 2017 to $52.683 billion by 2022, recording a CAGR of 11.7%. The study also predicted that television, satellite dish, over-the-top services would account for nearly half of the overall industry growth during the period.<ref>{{cite web |title=Media and Entertainment Industry May Touch Rs 3.73 Lakh Crore by 2022: Study |url=https://www.news18.com/news/india/media-and-entertainment-industry-may-touch-rs-3-73-lakh-crore-by-2022-study-2015579.html |website=News18 |date=27 January 2019 |access-date=27 January 2019 |archive-date=27 January 2019 |archive-url=https://web.archive.org/web/20190127205635/https://www.news18.com/news/india/media-and-entertainment-industry-may-touch-rs-3-73-lakh-crore-by-2022-study-2015579.html |url-status=live }}</ref> | ||
India has very popular newspaper and media outlets such as [[The Times of India]], [[Hindustan Times]] and [[Zee TV]]. | India has very popular newspaper and media outlets such as [[The Times of India]], [[Hindustan Times]] and [[Zee TV]]. | ||
| Line 1,031: | Line 1,040: | ||
{{Main|Cinema of India}} | {{Main|Cinema of India}} | ||
The Indian cinema industry is expected to garner a revenue of around Rs 16,198 crore by 2026, of which Rs 15,849 would be Box office revenue and the rest Rs 349 crore from advertising, the report added.<ref name="cinema">{{cite web|url=https://www.cnbctv18.com/business/companies/pwc-report-says-indian-media-and-entertainment-industry-could-be-worth-over-r-lakh-crore-rupees-13915872.htm|title=Streaming will rake in Rs 21,000 crore by 2026, more than Indian film industry: Report|author=PTI|date=23 June 2022|website=cnbctv18.com}}</ref> | The Indian cinema industry is expected to garner a revenue of around Rs 16,198 crore by 2026, of which Rs 15,849 would be Box office revenue and the rest Rs 349 crore from advertising, the report added.<ref name="cinema">{{cite web|url=https://www.cnbctv18.com/business/companies/pwc-report-says-indian-media-and-entertainment-industry-could-be-worth-over-r-lakh-crore-rupees-13915872.htm|title=Streaming will rake in Rs 21,000 crore by 2026, more than Indian film industry: Report|author=PTI|date=23 June 2022|website=cnbctv18.com|access-date=3 July 2023|archive-date=3 July 2023|archive-url=https://web.archive.org/web/20230703091730/https://www.cnbctv18.com/business/companies/pwc-report-says-indian-media-and-entertainment-industry-could-be-worth-over-r-lakh-crore-rupees-13915872.htm|url-status=live}}</ref> | ||
India's Recorded Music industry (which is a key sub-segment) is making steady progress at a CAGR of 13.6 percent, thanks to streaming models.<ref name="cinema" /> | India's Recorded Music industry (which is a key sub-segment) is making steady progress at a CAGR of 13.6 percent, thanks to streaming models.<ref name="cinema" /> | ||
| Line 1,039: | Line 1,048: | ||
{{Main|Telecommunications in India}} | {{Main|Telecommunications in India}} | ||
[[File:STS008-44-611.jpg|thumb|right| | [[File:STS008-44-611.jpg|thumb|right|[[INSAT-1B]] [[satellite]]: broadcasting sector in India is highly dependent on [[INSAT]] system.]] | ||
The telecommunication sector generated {{INRConvert|2.20|t}} in revenue in 2014–15, accounting for 1.94% of total GDP.<ref>{{cite web|url=http://www.dnaindia.com/money/report-telecom-sector-share-in-gdp-marginally-up-at-194-in-fy15-2158878|title=Telecom sector share in GDP marginally up at 1.94% in FY15 & Updates at Daily News & Analysis|date=23 December 2015|website=Daily News and Analysis|access-date=2 November 2017}}</ref> India is the second-largest market in the world by number of telephone users (both fixed and mobile phones) with 1.053 billion subscribers {{as of|2016|August|31|lc=y|post=.}} It has one of the lowest call-tariffs in the world, due to fierce competition among telecom operators. India has the world's third-largest Internet user-base. {{As of|2016|March|31|post=,}} there were 342.65 million Internet subscribers in the country.<ref>{{cite web |url=http://www.trai.gov.in/WriteReadData/PIRReport/Documents/Indicator_Report_05_August_2016.pdf |title=The Indian Telecom Services Performance Indicators January – March, 2016 |website=Telecom Regulatory Authority of India |access-date=29 November 2016 |date=5 August 2016 |archive-url=https://web.archive.org/web/20161130132013/http://www.trai.gov.in/WriteReadData/PIRReport/Documents/Indicator_Report_05_August_2016.pdf |archive-date=30 November 2016 }}</ref> India's [[Telecommunications in India|telecommunication industry]] is the world's second largest by the number of mobile phone, smartphone, and internet users. It is the world's [[List of countries by oil production|24th-largest oil producer]] and the [[List of countries by oil consumption|third-largest oil consumer]].<ref name=EIA>{{cite web |url=https://www.eia.gov/beta/international/data/browser/#/?pa=00000000000000000000000000000000002&c=ruvvvvvfvtvnvv1vrvvvvfvvvvvvfvvvou20evvvvvvvvvvvvuvo&ct=0&tl_id=5-A&vs=INTL.57-1-AFG-TBPD.A&vo=0&v=H&start=2019&end=2019 |title=Production of Crude Oil including Lease Condensate 2019 |publisher=[[U.S. Energy Information Administration]] |format=CVS download |access-date= 31 March 2019}}</ref> | The telecommunication sector generated {{INRConvert|2.20|t}} in revenue in 2014–15, accounting for 1.94% of total GDP.<ref>{{cite web|url=http://www.dnaindia.com/money/report-telecom-sector-share-in-gdp-marginally-up-at-194-in-fy15-2158878|title=Telecom sector share in GDP marginally up at 1.94% in FY15 & Updates at Daily News & Analysis|date=23 December 2015|website=Daily News and Analysis|access-date=2 November 2017|archive-date=11 March 2017|archive-url=https://web.archive.org/web/20170311130037/http://www.dnaindia.com/money/report-telecom-sector-share-in-gdp-marginally-up-at-194-in-fy15-2158878|url-status=live}}</ref> India is the second-largest market in the world by number of telephone users (both fixed and mobile phones) with 1.053 billion subscribers {{as of|2016|August|31|lc=y|post=.}} It has one of the lowest call-tariffs in the world, due to fierce competition among telecom operators. India has the world's third-largest Internet user-base. {{As of|2016|March|31|post=,}} there were 342.65 million Internet subscribers in the country.<ref>{{cite web |url=http://www.trai.gov.in/WriteReadData/PIRReport/Documents/Indicator_Report_05_August_2016.pdf |title=The Indian Telecom Services Performance Indicators January – March, 2016 |website=Telecom Regulatory Authority of India |access-date=29 November 2016 |date=5 August 2016 |archive-url=https://web.archive.org/web/20161130132013/http://www.trai.gov.in/WriteReadData/PIRReport/Documents/Indicator_Report_05_August_2016.pdf |archive-date=30 November 2016 }}</ref> India's [[Telecommunications in India|telecommunication industry]] is the world's second largest by the number of mobile phone, smartphone, and internet users. It is the world's [[List of countries by oil production|24th-largest oil producer]] and the [[List of countries by oil consumption|third-largest oil consumer]].<ref name=EIA>{{cite web |url=https://www.eia.gov/beta/international/data/browser/#/?pa=00000000000000000000000000000000002&c=ruvvvvvfvtvnvv1vrvvvvfvvvvvvfvvvou20evvvvvvvvvvvvuvo&ct=0&tl_id=5-A&vs=INTL.57-1-AFG-TBPD.A&vo=0&v=H&start=2019&end=2019 |title=Production of Crude Oil including Lease Condensate 2019 |publisher=[[U.S. Energy Information Administration]] |format=CVS download |access-date=31 March 2019 |archive-date=27 April 2017 |archive-url=https://web.archive.org/web/20170427031435/https://www.eia.gov/beta/international/data/browser/#/?pa=00000000000000000000000000000000002&c=ruvvvvvfvtvnvv1vrvvvvfvvvvvvfvvvou20evvvvvvvvvvvvuvo&ct=0&tl_id=5-A&vs=INTL.57-1-AFG-TBPD.A&vo=0&v=H&start=2019&end=2019 |url-status=live }}</ref> | ||
Industry estimates indicate that there are over 554 million TV consumers in India {{as of|2012|lc=y|post=.}}<ref name="mruc">{{cite web|url=http://mruc.net/irs2012q1-topline-findings.pdf |title=Indian Readership Survey 2012 Q1 : Topline Findings |at=Growth: Literacy & Media Consumption |publisher=Media Research Users Council |access-date=12 September 2012 |url-status=dead |archive-url=https://web.archive.org/web/20140407092737/http://mruc.net/irs2012q1-topline-findings.pdf |archive-date= 7 April 2014 }}</ref> India is the largest [[direct-to-home]] (DTH) television market in the world by number of subscribers. {{As of|2016|May|post=,}} there were 84.80 million [[Satellite television|DTH]] subscribers in the country.<ref name="TRAI">{{cite press release | url=http://www.trai.gov.in/WriteReadData/PIRReport/Documents/QPIR_Oct_to_Dec-15.pdf | title=Telecom Subscription data, May 2016 | publisher=TRAI | date=18 May 2016 | access-date=14 July 2016 | url-status=dead | archive-url=https://web.archive.org/web/20160615054203/http://www.trai.gov.in/WriteReadData/PIRReport/Documents/QPIR_Oct_to_Dec-15.pdf | archive-date=15 June 2016 | df=dmy-all }}</ref> | Industry estimates indicate that there are over 554 million TV consumers in India {{as of|2012|lc=y|post=.}}<ref name="mruc">{{cite web|url=http://mruc.net/irs2012q1-topline-findings.pdf |title=Indian Readership Survey 2012 Q1 : Topline Findings |at=Growth: Literacy & Media Consumption |publisher=Media Research Users Council |access-date=12 September 2012 |url-status=dead |archive-url=https://web.archive.org/web/20140407092737/http://mruc.net/irs2012q1-topline-findings.pdf |archive-date= 7 April 2014 }}</ref> India is the largest [[direct-to-home]] (DTH) television market in the world by number of subscribers. {{As of|2016|May|post=,}} there were 84.80 million [[Satellite television|DTH]] subscribers in the country.<ref name="TRAI">{{cite press release | url=http://www.trai.gov.in/WriteReadData/PIRReport/Documents/QPIR_Oct_to_Dec-15.pdf | title=Telecom Subscription data, May 2016 | publisher=TRAI | date=18 May 2016 | access-date=14 July 2016 | url-status=dead | archive-url=https://web.archive.org/web/20160615054203/http://www.trai.gov.in/WriteReadData/PIRReport/Documents/QPIR_Oct_to_Dec-15.pdf | archive-date=15 June 2016 | df=dmy-all }}</ref> | ||
== Security markets == | == Security markets == | ||
[[File:IT7A2275 copy (cropped).jpg|thumb|[[National Stock Exchange of India | [[File:IT7A2275 copy (cropped).jpg|thumb|The [[National Stock Exchange of India]] (NSE) is the biggest [[stock exchange]] in India by trading volume as 96% trading occurs in NSE]] | ||
[[File:BSE building at Dalal Street.JPG|thumb|[[Bombay Stock Exchange]] in Mumbai, which was Asia's first stock exchange<ref name="Rawal2015">{{cite book|author=Dr.Priya Rawal|title=Indian Stock Market and Investors Strategy|url=https://books.google.com/books?id=xLsoCAAAQBAJ&pg=PA12|date=16 April 2015|publisher=Dr.Priya Rawal|isbn=978-1-5053-5668-7|pages=12–}}</ref>]] | [[File:BSE building at Dalal Street.JPG|thumb|[[Bombay Stock Exchange]] in Mumbai, which was Asia's first stock exchange<ref name="Rawal2015">{{cite book|author=Dr.Priya Rawal|title=Indian Stock Market and Investors Strategy|url=https://books.google.com/books?id=xLsoCAAAQBAJ&pg=PA12|date=16 April 2015|publisher=Dr.Priya Rawal|isbn=978-1-5053-5668-7|pages=12–|access-date=23 November 2018|archive-date=11 January 2023|archive-url=https://web.archive.org/web/20230111193659/https://books.google.com/books?id=xLsoCAAAQBAJ&pg=PA12|url-status=live}}</ref>]] | ||
The development of Indian security markets began with the launch of the [[Bombay Stock Exchange]] (BSE) in July 1875 and the [[Ahmedabad Stock Exchange]] in 1894. Since then, 22 other exchanges have traded in Indian cities. In 2014, India's stock exchange market became the 10th largest in the world by market capitalisation, just above those of South Korea and Australia.<ref>{{cite news|url=http://www.ft.com/intl/cms/s/0/fa07a946-e1a1-11e3-b7c4-00144feabdc0.html|title= 'Modi Mania' propels India's stock market into world's top 10|work=Financial Times|date= 22 May 2014}}</ref> India's two major stock exchanges, BSE and the [[National Stock Exchange of India]], had a market capitalisation of US$1.71 trillion and US$1.68 trillion {{as of|2015|February|lc=y|post=,}} according to the [[World Federation of Exchanges]], which grew to $3.36 trillion and $3.31 trillion respectively by September 2021.<ref name="bseindia.com">{{cite web|url=http://www.bseindia.com/|title=BSE Ltd. (Bombay Stock Exchange) – Live Stock Market Updates for S&P BSE SENSEX, Stock Quotes & Corporate Information|website=BSEIndia.com|access-date=2 November 2017}}</ref><ref>{{cite web|url=http://www.world-exchanges.org/statistics/monthly-reports|archive-url=https://web.archive.org/web/20140817220823/http://www.world-exchanges.org/statistics/monthly-reports|url-status= dead|title=WFE|archive-date=17 August 2014}}</ref> | The development of Indian security markets began with the launch of the [[Bombay Stock Exchange]] (BSE) in July 1875 and the [[Ahmedabad Stock Exchange]] in 1894. Since then, 22 other exchanges have traded in Indian cities. In 2014, India's stock exchange market became the 10th largest in the world by market capitalisation, just above those of South Korea and Australia.<ref>{{cite news|url=http://www.ft.com/intl/cms/s/0/fa07a946-e1a1-11e3-b7c4-00144feabdc0.html|title='Modi Mania' propels India's stock market into world's top 10|work=Financial Times|date=22 May 2014|access-date=28 July 2014|archive-date=9 November 2023|archive-url=https://web.archive.org/web/20231109223843/https://www.ft.com/content/fa07a946-e1a1-11e3-b7c4-00144feabdc0|url-status=live}}</ref> India's two major stock exchanges, BSE and the [[National Stock Exchange of India]], had a market capitalisation of US$1.71 trillion and US$1.68 trillion {{as of|2015|February|lc=y|post=,}} according to the [[World Federation of Exchanges]], which grew to $3.36 trillion and $3.31 trillion respectively by September 2021.<ref name="bseindia.com">{{cite web|url=http://www.bseindia.com/|title=BSE Ltd. (Bombay Stock Exchange) – Live Stock Market Updates for S&P BSE SENSEX, Stock Quotes & Corporate Information|website=BSEIndia.com|access-date=2 November 2017|archive-date=28 January 2017|archive-url=https://web.archive.org/web/20170128034956/http://www.bseindia.com/|url-status=live}}</ref><ref>{{cite web|url=http://www.world-exchanges.org/statistics/monthly-reports|archive-url=https://web.archive.org/web/20140817220823/http://www.world-exchanges.org/statistics/monthly-reports|url-status= dead|title=WFE|archive-date=17 August 2014}}</ref> | ||
The initial public offering (IPO) market in India has been small compared to NYSE and NASDAQ, raising US$300 million in 2013 and US$1.4 billion in 2012. [[Ernst & Young]] stated<ref name=eygipo>[http://www.ey.com/Publication/vwLUAssets/EY_-_Global_IPO_Trends_Q4_2013/$FILE/EY-Global-IPO-Trends-Q4-2013.pdf EY Global IPO Trends Global IPO Trends Q4 2013] Ernst & Young (2014)</ref> that the low IPO activity reflects market conditions, slow government approval processes, and complex regulations. Before 2013, Indian companies were not allowed to list their securities internationally without first completing an IPO in India. In 2013, these security laws were reformed and Indian companies can now choose where they want to list first: overseas, domestically, or both concurrently.<ref>{{cite news|url=http://www.business-standard.com/article/markets/listing-abroad-sans-domestic-ipo-set-to-be-a-reality-soon-113122000712_1.html |title=Listing abroad sans domestic IPO set to be a reality soon|work=Business Standard|date=28 July 2013}}</ref> Further, security laws have been revised to ease overseas listings of already-listed companies, to increase liquidity for private equity and international investors in Indian companies.<ref name=eygipo /> | The initial public offering (IPO) market in India has been small compared to NYSE and NASDAQ, raising US$300 million in 2013 and US$1.4 billion in 2012. [[Ernst & Young]] stated<ref name=eygipo>[http://www.ey.com/Publication/vwLUAssets/EY_-_Global_IPO_Trends_Q4_2013/$FILE/EY-Global-IPO-Trends-Q4-2013.pdf EY Global IPO Trends Global IPO Trends Q4 2013] {{Webarchive|url=https://web.archive.org/web/20150924040938/http://www.ey.com/Publication/vwLUAssets/EY_-_Global_IPO_Trends_Q4_2013/$FILE/EY-Global-IPO-Trends-Q4-2013.pdf |date=24 September 2015 }} Ernst & Young (2014)</ref> that the low IPO activity reflects market conditions, slow government approval processes, and complex regulations. Before 2013, Indian companies were not allowed to list their securities internationally without first completing an IPO in India. In 2013, these security laws were reformed and Indian companies can now choose where they want to list first: overseas, domestically, or both concurrently.<ref>{{cite news|url=http://www.business-standard.com/article/markets/listing-abroad-sans-domestic-ipo-set-to-be-a-reality-soon-113122000712_1.html|title=Listing abroad sans domestic IPO set to be a reality soon|work=Business Standard|date=28 July 2013|access-date=28 July 2014|archive-date=1 August 2017|archive-url=https://web.archive.org/web/20170801152809/http://www.business-standard.com/article/markets/listing-abroad-sans-domestic-ipo-set-to-be-a-reality-soon-113122000712_1.html|url-status=live}}</ref> Further, security laws have been revised to ease overseas listings of already-listed companies, to increase liquidity for private equity and international investors in Indian companies.<ref name=eygipo /> | ||
== Foreign trade and investment == | == Foreign trade and investment == | ||
| Line 1,059: | Line 1,068: | ||
{{Main|Foreign trade of India}} | {{Main|Foreign trade of India}} | ||
{{Further|List of the largest trading partners of India}} | {{Further|List of the largest trading partners of India}} | ||
{{multiple image | {{multiple image | ||
| direction = vertical | | direction = vertical | ||
| Line 1,192: | Line 1,200: | ||
|} | |} | ||
Until the liberalisation of 1991, India was largely and intentionally isolated from world markets, to protect its economy and to achieve self-reliance. Foreign trade was subject to import tariffs, export taxes and quantitative restrictions, while [[foreign direct investment]] (FDI) was restricted by upper-limit equity participation, restrictions on technology transfer, export obligations and government approvals; these approvals were needed for nearly 60% of new FDI in the industrial sector. The restrictions ensured that FDI averaged only around $200 million annually between 1985 and 1991; a large percentage of the capital flows consisted of foreign aid, commercial borrowing and deposits of [[Non-resident Indian and person of Indian origin|non-resident Indians]].<ref name="tn-srinivasan">{{cite web|author=Srinivasan, T.N.|title=Economic Reforms and Global Integration|year=2002|version=17 January 2002|url=http://www.econ.yale.edu/%7Esrinivas/ec_reforms.pdf|website=Economic Growth Center, Yale University|access-date=21 June 2009|archive-url=https://web.archive.org/web/20090326211644/http://www.econ.yale.edu/%7Esrinivas/ec_reforms.pdf|archive-date=26 March 2009}}</ref> India's exports were stagnant for the first 15 years after independence, due to general neglect of trade policy by the government of that period; imports in the same period, with early industrialisation, consisted predominantly of machinery, raw materials and consumer goods.<ref>{{Harvnb|Panagariya|2008|pp=27–29}}</ref> | Until the liberalisation of 1991, India was largely and intentionally isolated from world markets, to protect its economy and to achieve self-reliance. Foreign trade was subject to import tariffs, export taxes and quantitative restrictions, while [[foreign direct investment]] (FDI) was restricted by upper-limit equity participation, restrictions on technology transfer, export obligations and government approvals; these approvals were needed for nearly 60% of new FDI in the industrial sector. The restrictions ensured that FDI averaged only around $200 million annually between 1985 and 1991; a large percentage of the capital flows consisted of foreign aid, commercial borrowing and deposits of [[Non-resident Indian and person of Indian origin|non-resident Indians]].<ref name="tn-srinivasan">{{cite web|author=Srinivasan, T.N.|title=Economic Reforms and Global Integration|year=2002|version=17 January 2002|url=http://www.econ.yale.edu/%7Esrinivas/ec_reforms.pdf|website=Economic Growth Center, Yale University|access-date=21 June 2009|archive-url=https://web.archive.org/web/20090326211644/http://www.econ.yale.edu/%7Esrinivas/ec_reforms.pdf|archive-date=26 March 2009}}</ref> India's exports were stagnant for the first 15 years after independence, due to general neglect of trade policy by the government of that period; imports in the same period, with early industrialisation, consisted predominantly of machinery, raw materials and consumer goods.<ref>{{Harvnb|Panagariya|2008|pp=27–29}}</ref> | ||
Since liberalisation, the value of India's international trade has increased sharply,<ref>{{Harvnb|Datt|Sundharam|2009|pp=747–748}}</ref> with the contribution of total trade in goods and services to the GDP rising from 16% in 1990–91 to 47% in 2009–10.<ref name="Trade">{{Harvnb|Panagariya|2008|p=109}}</ref><ref name="WTO profile">{{cite web|url=http://stat.wto.org/CountryProfile/WSDBCountryPFView.aspx?Language=E&Country=IN|title=Trade profiles-India|publisher=[[World Trade Organization]]|access-date=7 February 2012|archive-date=20 May 2016|archive-url=https://web.archive.org/web/20160520195000/http://stat.wto.org/CountryProfile/WSDBCountryPFView.aspx?Country=IN&Language=E|url-status=dead}}</ref> Foreign trade accounted for 48.8% of India's GDP in 2015.<ref name="HDI">{{cite web |url=http://hdr.undp.org/en/indicators/137506 |title=Human Development Index (HDI) |website=hdr.undp.org |publisher=[[Human Development Report|HDRO (Human Development Report Office)]] [[United Nations Development Programme]] |access-date=11 December 2019}}</ref> Globally, India accounts for 1.44% of exports and 2.12% of imports for merchandise trade and 3.34% of exports and 3.31% of imports for commercial services trade.<ref name="WTO profile" /> India's major trading partners are the European Union, China, United States and [[United Arab Emirates]].<ref name="Datt-14">{{Harvnb|Datt|Sundharam|2009|p=757}}</ref> In 2006–07, major export commodities included engineering goods, petroleum products, chemicals and pharmaceuticals, gems and jewellery, textiles and garments, agricultural products, iron ore and other minerals. Major import commodities included crude oil and related products, machinery, electronic goods, gold and silver.<ref>{{cite web|url=http://commerce.nic.in/eidb/default.asp|title=Imports and Exports Databank|publisher=Ministry of Commerce and Industry, Government of India|access-date=5 April 2010|archive-url=https://web.archive.org/web/20181122004154/http://commerce.nic.in/eidb/default.asp|archive-date=22 November 2018|url-status=dead}}</ref> In November 2010, exports increased 22.3% year-on-year to {{INRConvert|851|b|year=2010}}, while imports were up 7.5% at {{INRConvert|1.25|t|year=2010}}. The trade deficit for the same month dropped from {{INRConvert|469|b|year=2009}} in 2009 to {{INRConvert|401|b|year=2010}} in 2010.<ref>{{cite web |url=http://commerce.nic.in/tradestats/Indiastrade_press.pdf |title=India's Foreign Trade: November 2010 |work=Press Release |publisher=Ministry of Commerce and Industry, Government of India |date=3 January 2011 |access-date=11 January 2011 |url-status=dead |archive-url=https://web.archive.org/web/20110124192815/http://commerce.nic.in/tradestats/Indiastrade_press.pdf |archive-date=24 January 2011 }}</ref> | Since liberalisation, the value of India's international trade has increased sharply,<ref>{{Harvnb|Datt|Sundharam|2009|pp=747–748}}</ref> with the contribution of total trade in goods and services to the GDP rising from 16% in 1990–91 to 47% in 2009–10.<ref name="Trade">{{Harvnb|Panagariya|2008|p=109}}</ref><ref name="WTO profile">{{cite web|url=http://stat.wto.org/CountryProfile/WSDBCountryPFView.aspx?Language=E&Country=IN|title=Trade profiles-India|publisher=[[World Trade Organization]]|access-date=7 February 2012|archive-date=20 May 2016|archive-url=https://web.archive.org/web/20160520195000/http://stat.wto.org/CountryProfile/WSDBCountryPFView.aspx?Country=IN&Language=E|url-status=dead}}</ref> Foreign trade accounted for 48.8% of India's GDP in 2015.<ref name="HDI">{{cite web |url=http://hdr.undp.org/en/indicators/137506 |title=Human Development Index (HDI) |website=hdr.undp.org |publisher=[[Human Development Report|HDRO (Human Development Report Office)]] [[United Nations Development Programme]] |access-date=11 December 2019 |archive-date=15 December 2019 |archive-url=https://web.archive.org/web/20191215174637/http://hdr.undp.org/en/indicators/137506 |url-status=live }}</ref> Globally, India accounts for 1.44% of exports and 2.12% of imports for merchandise trade and 3.34% of exports and 3.31% of imports for commercial services trade.<ref name="WTO profile" /> India's major trading partners are the European Union, China, United States and [[United Arab Emirates]].<ref name="Datt-14">{{Harvnb|Datt|Sundharam|2009|p=757}}</ref> In 2006–07, major export commodities included engineering goods, petroleum products, chemicals and pharmaceuticals, gems and jewellery, textiles and garments, agricultural products, iron ore and other minerals. Major import commodities included crude oil and related products, machinery, electronic goods, gold and silver.<ref>{{cite web|url=http://commerce.nic.in/eidb/default.asp|title=Imports and Exports Databank|publisher=Ministry of Commerce and Industry, Government of India|access-date=5 April 2010|archive-url=https://web.archive.org/web/20181122004154/http://commerce.nic.in/eidb/default.asp|archive-date=22 November 2018|url-status=dead}}</ref> In November 2010, exports increased 22.3% year-on-year to {{INRConvert|851|b|year=2010}}, while imports were up 7.5% at {{INRConvert|1.25|t|year=2010}}. The trade deficit for the same month dropped from {{INRConvert|469|b|year=2009}} in 2009 to {{INRConvert|401|b|year=2010}} in 2010.<ref>{{cite web |url=http://commerce.nic.in/tradestats/Indiastrade_press.pdf |title=India's Foreign Trade: November 2010 |work=Press Release |publisher=Ministry of Commerce and Industry, Government of India |date=3 January 2011 |access-date=11 January 2011 |url-status=dead |archive-url=https://web.archive.org/web/20110124192815/http://commerce.nic.in/tradestats/Indiastrade_press.pdf |archive-date=24 January 2011 }}</ref> | ||
India is a founding-member of [[General Agreement on Tariffs and Trade]] (GATT) and its successor, the WTO. While participating actively in its general council meetings, India has been crucial in voicing the concerns of the [[developing country|developing world]]. For instance, India has continued its opposition to the inclusion of labour, environmental issues and other [[non-tariff barriers to trade]] in WTO policies.<ref name="wto">{{cite web|title=India & the World Trade Organization|url=http://www.indianembassy.org/policy/WTO/overview.html|archive-url=https://web.archive.org/web/20050613080223/http://www.indianembassy.org/policy/WTO/overview.html|publisher=Embassy of India|archive-date=13 June 2005|access-date = 9 July 2005}}</ref> | India is a founding-member of [[General Agreement on Tariffs and Trade]] (GATT) and its successor, the WTO. While participating actively in its general council meetings, India has been crucial in voicing the concerns of the [[developing country|developing world]]. For instance, India has continued its opposition to the inclusion of labour, environmental issues and other [[non-tariff barriers to trade]] in WTO policies.<ref name="wto">{{cite web|title=India & the World Trade Organization|url=http://www.indianembassy.org/policy/WTO/overview.html|archive-url=https://web.archive.org/web/20050613080223/http://www.indianembassy.org/policy/WTO/overview.html|publisher=Embassy of India|archive-date=13 June 2005|access-date = 9 July 2005}}</ref> | ||
[[India]] secured 43rd place in competitiveness index.<ref>{{cite web|url=https://www.moneycontrol.com/news/india/india-moves-up-to-43rd-place-on-competitiveness-singapore-reaches-top-4033901.html|title=India moves up to 43rd place on competitiveness; Singapore reaches top|website=Moneycontrol|access-date=29 May 2019}}</ref> | [[India]] secured 43rd place in competitiveness index.<ref>{{cite web|url=https://www.moneycontrol.com/news/india/india-moves-up-to-43rd-place-on-competitiveness-singapore-reaches-top-4033901.html|title=India moves up to 43rd place on competitiveness; Singapore reaches top|website=Moneycontrol|access-date=29 May 2019|archive-date=29 May 2019|archive-url=https://web.archive.org/web/20190529054655/https://www.moneycontrol.com/news/india/india-moves-up-to-43rd-place-on-competitiveness-singapore-reaches-top-4033901.html|url-status=live}}</ref> | ||
=== Balance of payments === | === Balance of payments === | ||
[[File:Cumulative Current Account Balance.png|thumb|[[Cumulativity|Cumulative]] current account balance 1980–2008 based on IMF data]] | [[File:Cumulative Current Account Balance.png|thumb|[[Cumulativity|Cumulative]] current account balance 1980–2008 based on IMF data]] | ||
Since independence, India's [[balance of payments]] on its [[Current account (balance of payments)|current account]] has been negative. Since economic liberalisation in the 1990s, precipitated by a balance-of-payment crisis, India's exports rose consistently, covering 80.3% of its imports in 2002–03, up from 66.2% in 1990–91.<ref>{{Harvnb|Datt|Sundharam|2009|pp=763–765}}</ref> However, the global economic slump followed by a general deceleration in world trade saw the exports as a percentage of imports drop to 61.4% in 2008–09.{{sfn|Economic Survey|2010|pp=127–129}} India's growing oil import bill is seen as the main driver behind the large current account deficit,<ref name="RupeeOil" /> which rose to $118.7 billion, or 11.11% of GDP, in 2008–09.{{sfn|Economic Survey|2010|p=127}} Between January and October 2010, India imported $82.1 billion worth of crude oil.<ref name="RupeeOil">{{cite news|url=http://www.businessweek.com/news/2010-12-07/rupee-rally-falters-as-oil-rises-to-two-year-high-india-credit.html |title=Rupee Rally Falters as Oil Rises to Two-Year High |work=Bloomberg BusinessWeek |date=7 December 2010 |author=V. Ramakrishnan |access-date=11 January 2011 |url-status=dead |archive-url=https://web.archive.org/web/20110111083311/http://www.businessweek.com/news/2010-12-07/rupee-rally-falters-as-oil-rises-to-two-year-high-india-credit.html |archive-date=11 January 2011 }}</ref> The Indian economy has run a trade deficit every year from 2002 to 2012, with a merchandise trade deficit of US$189 billion in 2011–12.<ref>[http://commerce.gov.in/publications/pdf/annualreport_overview-2012-13.pdf 2013 Annual Report] Ministry of Commerce, Govt of India (2013)</ref> Its trade with China has the largest deficit, about $31 billion in 2013.<ref>{{cite news|url=http://articles.economictimes.indiatimes.com/2014-01-10/news/46066593_1_trade-deficit-indian-it-trade-data |title=India's trade deficit with China mounts to $ 31.42 bn|work= The Economic Times |date=10 January 2014}}</ref> | Since independence, India's [[balance of payments]] on its [[Current account (balance of payments)|current account]] has been negative. Since economic liberalisation in the 1990s, precipitated by a balance-of-payment crisis, India's exports rose consistently, covering 80.3% of its imports in 2002–03, up from 66.2% in 1990–91.<ref>{{Harvnb|Datt|Sundharam|2009|pp=763–765}}</ref> However, the global economic slump followed by a general deceleration in world trade saw the exports as a percentage of imports drop to 61.4% in 2008–09.{{sfn|Economic Survey|2010|pp=127–129}} India's growing oil import bill is seen as the main driver behind the large current account deficit,<ref name="RupeeOil" /> which rose to $118.7 billion, or 11.11% of GDP, in 2008–09.{{sfn|Economic Survey|2010|p=127}} Between January and October 2010, India imported $82.1 billion worth of crude oil.<ref name="RupeeOil">{{cite news|url=http://www.businessweek.com/news/2010-12-07/rupee-rally-falters-as-oil-rises-to-two-year-high-india-credit.html |title=Rupee Rally Falters as Oil Rises to Two-Year High |work=Bloomberg BusinessWeek |date=7 December 2010 |author=V. Ramakrishnan |access-date=11 January 2011 |url-status=dead |archive-url=https://web.archive.org/web/20110111083311/http://www.businessweek.com/news/2010-12-07/rupee-rally-falters-as-oil-rises-to-two-year-high-india-credit.html |archive-date=11 January 2011 }}</ref> The Indian economy has run a trade deficit every year from 2002 to 2012, with a merchandise trade deficit of US$189 billion in 2011–12.<ref>[http://commerce.gov.in/publications/pdf/annualreport_overview-2012-13.pdf 2013 Annual Report] {{Webarchive|url=https://web.archive.org/web/20140810031400/http://commerce.gov.in/publications/pdf/annualreport_overview-2012-13.pdf |date=10 August 2014 }} Ministry of Commerce, Govt of India (2013)</ref> Its trade with China has the largest deficit, about $31 billion in 2013.<ref>{{cite news|url=http://articles.economictimes.indiatimes.com/2014-01-10/news/46066593_1_trade-deficit-indian-it-trade-data|title=India's trade deficit with China mounts to $ 31.42 bn|work=The Economic Times|date=10 January 2014|access-date=1 August 2014|archive-date=5 March 2016|archive-url=https://web.archive.org/web/20160305144404/http://articles.economictimes.indiatimes.com/2014-01-10/news/46066593_1_trade-deficit-indian-it-trade-data|url-status=live}}</ref> | ||
India's reliance on external assistance and concessional debt has decreased since liberalisation of the economy, and the [[debt service ratio]] decreased from 35.3% in 1990–91 to 4.4% in 2008–09.{{sfn|Economic Survey|2010|pp=142–144}} In India, [[External commercial borrowing (India)|external commercial borrowings]] (ECBs), or commercial loans from non-resident lenders, are being permitted by the government for providing an additional source of funds to Indian corporates. The [[Finance Minister of India|Ministry of Finance]] monitors and regulates them through ECB policy guidelines issued by the Reserve Bank of India (RBI) under the [[Foreign Exchange Management Act]] of 1999.<ref>{{cite web|url=http://rbidocs.rbi.org.in/rdocs/Notification/PDFs/27ECB010709_F.pdf|title=Master Circular on External Commercial Borrowings and Trade Credits|publisher=Reserve Bank of India |access-date=11 January 2011}}</ref> India's [[foreign exchange reserve]]s have steadily risen from $5.8 billion in March 1991 to ₹38,832.21 billion (US$540 billion) in July 2020.<ref name="RBI_reserves" />{{sfn|Economic Survey|2010|p=132}} In 2012, United Kingdom announced an end to all financial aid to India, citing the growth and robustness of Indian economy.<ref>{{cite news|url=http://www.ft.com/intl/cms/s/0/30203e68-2a55-11e2-99bb-00144feabdc0.html |title=UK to end financial aid to India|work= Financial Times |date=9 November 2012}}</ref><ref>{{cite news|url=http://in.reuters.com/article/india-cenbank-forex-reserves-idINS8N0QH02M20140905|title=TABLE-India's forex reserves rise to $318.64 bln as of Aug 29 – cbank|newspaper=Reuters|date=5 September 2014|access-date=3 March 2015}}</ref> | India's reliance on external assistance and concessional debt has decreased since liberalisation of the economy, and the [[debt service ratio]] decreased from 35.3% in 1990–91 to 4.4% in 2008–09.{{sfn|Economic Survey|2010|pp=142–144}} In India, [[External commercial borrowing (India)|external commercial borrowings]] (ECBs), or commercial loans from non-resident lenders, are being permitted by the government for providing an additional source of funds to Indian corporates. The [[Finance Minister of India|Ministry of Finance]] monitors and regulates them through ECB policy guidelines issued by the Reserve Bank of India (RBI) under the [[Foreign Exchange Management Act]] of 1999.<ref>{{cite web|url=http://rbidocs.rbi.org.in/rdocs/Notification/PDFs/27ECB010709_F.pdf|title=Master Circular on External Commercial Borrowings and Trade Credits|publisher=Reserve Bank of India|access-date=11 January 2011|archive-date=17 September 2012|archive-url=https://web.archive.org/web/20120917004422/http://rbidocs.rbi.org.in/rdocs/notification/PDFs/27ECB010709_F.pdf|url-status=live}}</ref> India's [[foreign exchange reserve]]s have steadily risen from $5.8 billion in March 1991 to ₹38,832.21 billion (US$540 billion) in July 2020.<ref name="RBI_reserves" />{{sfn|Economic Survey|2010|p=132}} In 2012, United Kingdom announced an end to all financial aid to India, citing the growth and robustness of Indian economy.<ref>{{cite news|url=http://www.ft.com/intl/cms/s/0/30203e68-2a55-11e2-99bb-00144feabdc0.html|title=UK to end financial aid to India|work=Financial Times|date=9 November 2012|access-date=1 August 2014|archive-date=9 November 2023|archive-url=https://web.archive.org/web/20231109223843/https://www.ft.com/content/30203e68-2a55-11e2-99bb-00144feabdc0|url-status=live}}</ref><ref>{{cite news|url=http://in.reuters.com/article/india-cenbank-forex-reserves-idINS8N0QH02M20140905|title=TABLE-India's forex reserves rise to $318.64 bln as of Aug 29 – cbank|newspaper=Reuters|date=5 September 2014|access-date=3 March 2015|archive-date=10 December 2015|archive-url=https://web.archive.org/web/20151210215231/http://in.reuters.com/article/india-cenbank-forex-reserves-idINS8N0QH02M20140905|url-status=live}}</ref> | ||
India's current account deficit reached an all-time high in 2013.<ref>{{cite web|last1=Nag|first1=Anirban|title=Foreigners to the rescue as inflows rise to bridge India's current account deficit|url=http://www.livemint.com/Money/6XJ5pjEUBlu9eRBgwEypaM/Foreigners-to-the-rescue-as-inflows-rise-to-bridge-Indias-c.html|website=Mint|access-date=4 April 2017|date=27 March 2017}}</ref> India has historically funded its current account deficit through borrowings by companies in the overseas markets or remittances by non-resident Indians and portfolio inflows. From April 2016 to January 2017, RBI data showed that, for the first time since 1991, India was funding its deficit through foreign direct investment inflows. ''[[The Economic Times]]'' noted that the development was "a sign of rising confidence among long-term investors in Prime Minister [[Narendra Modi]]'s ability to strengthen the country's economic foundation for sustained growth".<ref>{{cite news|title=In a first since 1991, FDI flow takes care of CAD|url=http://economictimes.indiatimes.com/markets/stocks/news/in-a-first-since-1991-fdi-flow-takes-care-of-cad/articleshow/58000640.cms|website=The Economic Times|access-date=4 April 2017|last1=Nayak|first1=Gayatri}}</ref> | India's current account deficit reached an all-time high in 2013.<ref>{{cite web|last1=Nag|first1=Anirban|title=Foreigners to the rescue as inflows rise to bridge India's current account deficit|url=http://www.livemint.com/Money/6XJ5pjEUBlu9eRBgwEypaM/Foreigners-to-the-rescue-as-inflows-rise-to-bridge-Indias-c.html|website=Mint|access-date=4 April 2017|date=27 March 2017|archive-date=5 April 2017|archive-url=https://web.archive.org/web/20170405170637/http://www.livemint.com/Money/6XJ5pjEUBlu9eRBgwEypaM/Foreigners-to-the-rescue-as-inflows-rise-to-bridge-Indias-c.html|url-status=live}}</ref> India has historically funded its current account deficit through borrowings by companies in the overseas markets or remittances by non-resident Indians and portfolio inflows. From April 2016 to January 2017, RBI data showed that, for the first time since 1991, India was funding its deficit through foreign direct investment inflows. ''[[The Economic Times]]'' noted that the development was "a sign of rising confidence among long-term investors in Prime Minister [[Narendra Modi]]'s ability to strengthen the country's economic foundation for sustained growth".<ref>{{cite news|title=In a first since 1991, FDI flow takes care of CAD|url=http://economictimes.indiatimes.com/markets/stocks/news/in-a-first-since-1991-fdi-flow-takes-care-of-cad/articleshow/58000640.cms|website=The Economic Times|access-date=4 April 2017|last1=Nayak|first1=Gayatri|archive-date=5 April 2017|archive-url=https://web.archive.org/web/20170405165843/http://economictimes.indiatimes.com/markets/stocks/news/in-a-first-since-1991-fdi-flow-takes-care-of-cad/articleshow/58000640.cms|url-status=live}}</ref> | ||
=== Foreign direct investment === | === Foreign direct investment === | ||
| Line 1,224: | Line 1,232: | ||
|5 || Netherlands || 4,968 || 4.00 | |5 || Netherlands || 4,968 || 4.00 | ||
|} | |} | ||
As the third-largest economy in the world in PPP terms, India has attracted [[foreign direct investment]] (FDI).<ref name="financialexpress1">{{cite news|url=http://www.financialexpress.com/news/India-2nd-best-country-for-biz-investment-Survey/343344/ |title=India 2nd best country for biz investment: Survey|newspaper=[[The Financial Express (India)|The Financial Express]] |access-date=3 November 2008}}</ref> During the year 2011, FDI inflow into India stood at $36.5 billion, 51.1% higher than the 2010 figure of $24.15 billion. India has strengths in telecommunication, information technology and other significant areas such as auto components, chemicals, apparels, pharmaceuticals, and jewellery. Despite a surge in foreign investments, rigid FDI policies<ref name="news.indiamart.com">{{cite news|url=http://news.indiamart.com/story/finmin-considers-three-single-brand-retail-fdi-proposals-169557.html|title=FinMin considers three single-brand retail FDI proposals|url-status=dead|archive-url=https://web.archive.org/web/20121021202322/http://news.indiamart.com/story/finmin-considers-three-single-brand-retail-fdi-proposals-169557.html|archive-date=21 October 2012}}</ref> were a significant hindrance. Over time, India has adopted a number of FDI reforms.<ref name="financialexpress1" /> India has a large pool of skilled managerial and technical expertise. The size of the [[Standard of living in India|middle-class]] population stands at 300 million and represents a growing consumer market.<ref>{{cite web|url=http://www.mckinsey.com/mgi/mginews/bigspenders.asp |title=Next Big Spenders: India's Middle Class |publisher=[[McKinsey & Company]] |access-date=5 April 2010}}</ref> | As the third-largest economy in the world in PPP terms, India has attracted [[foreign direct investment]] (FDI).<ref name="financialexpress1">{{cite news |url=http://www.financialexpress.com/news/India-2nd-best-country-for-biz-investment-Survey/343344/ |title=India 2nd best country for biz investment: Survey |newspaper=[[The Financial Express (India)|The Financial Express]] |access-date=3 November 2008 |archive-date=5 July 2009 |archive-url=https://web.archive.org/web/20090705004920/http://www.financialexpress.com/news/India-2nd-best-country-for-biz-investment-Survey/343344/ |url-status=live }}</ref> During the year 2011, FDI inflow into India stood at $36.5 billion, 51.1% higher than the 2010 figure of $24.15 billion. India has strengths in telecommunication, information technology and other significant areas such as auto components, chemicals, apparels, pharmaceuticals, and jewellery. Despite a surge in foreign investments, rigid FDI policies<ref name="news.indiamart.com">{{cite news|url=http://news.indiamart.com/story/finmin-considers-three-single-brand-retail-fdi-proposals-169557.html|title=FinMin considers three single-brand retail FDI proposals|url-status=dead|archive-url=https://web.archive.org/web/20121021202322/http://news.indiamart.com/story/finmin-considers-three-single-brand-retail-fdi-proposals-169557.html|archive-date=21 October 2012}}</ref> were a significant hindrance. Over time, India has adopted a number of FDI reforms.<ref name="financialexpress1" /> India has a large pool of skilled managerial and technical expertise. The size of the [[Standard of living in India|middle-class]] population stands at 300 million and represents a growing consumer market.<ref>{{cite web |url=http://www.mckinsey.com/mgi/mginews/bigspenders.asp |title=Next Big Spenders: India's Middle Class |publisher=[[McKinsey & Company]] |access-date=5 April 2010 |archive-date=16 November 2011 |archive-url=https://web.archive.org/web/20111116211914/http://www.mckinsey.com/mgi/mginews/bigspenders.asp |url-status=dead }}</ref> | ||
India liberalised its FDI policy in 2005, allowing up to a 100% FDI stake in ventures. Industrial policy reforms have substantially reduced industrial licensing requirements, removed restrictions on expansion and facilitated easy access to foreign technology and investment. The upward growth curve of the real-estate sector owes some credit to a booming economy and liberalised FDI regime. In March 2005, the government amended the rules to allow 100% FDI in the construction sector, including built-up infrastructure and construction development projects comprising housing, commercial premises, hospitals, educational institutions, recreational facilities, and city- and regional-level infrastructure.<ref>{{cite news|url=http://www.hindu.com/2005/02/25/stories/2005022506990100.htm |archive-url=https://web.archive.org/web/20050405032727/http://www.hindu.com/2005/02/25/stories/2005022506990100.htm |url-status=dead |archive-date=5 April 2005 |title=100 per cent FDI in construction industry automatic route |newspaper=[[The Hindu]] |date=25 February 2005 |first=Sushma|last=Ramachandran |access-date=17 December 2010 |location=Chennai, India}}</ref> Between 2012 and 2014, India extended these reforms to defence, telecom, oil, retail, aviation, and other sectors.<ref>{{cite news|url=http://timesofindia.indiatimes.com/business/india-business/Govt-unleashes-big-bang-FDI-reforms-opens-up-defence/articleshow/21110866.cms |title=Govt unleashes big-bang FDI reforms, opens up defence|work= The Times of India |date=17 July 2014}}</ref><ref>{{cite news|url=http://in.reuters.com/article/india-economy-retail-fdi-reform-idINDEE88D08M20120914 |title=Govt allows FDI multi-brand retail, aviation in bold reform push|work= Reuters |date=14 September 2012}}</ref> | India liberalised its FDI policy in 2005, allowing up to a 100% FDI stake in ventures. Industrial policy reforms have substantially reduced industrial licensing requirements, removed restrictions on expansion and facilitated easy access to foreign technology and investment. The upward growth curve of the real-estate sector owes some credit to a booming economy and liberalised FDI regime. In March 2005, the government amended the rules to allow 100% FDI in the construction sector, including built-up infrastructure and construction development projects comprising housing, commercial premises, hospitals, educational institutions, recreational facilities, and city- and regional-level infrastructure.<ref>{{cite news|url=http://www.hindu.com/2005/02/25/stories/2005022506990100.htm |archive-url=https://web.archive.org/web/20050405032727/http://www.hindu.com/2005/02/25/stories/2005022506990100.htm |url-status=dead |archive-date=5 April 2005 |title=100 per cent FDI in construction industry automatic route |newspaper=[[The Hindu]] |date=25 February 2005 |first=Sushma|last=Ramachandran |access-date=17 December 2010 |location=Chennai, India}}</ref> Between 2012 and 2014, India extended these reforms to defence, telecom, oil, retail, aviation, and other sectors.<ref>{{cite news|url=http://timesofindia.indiatimes.com/business/india-business/Govt-unleashes-big-bang-FDI-reforms-opens-up-defence/articleshow/21110866.cms|title=Govt unleashes big-bang FDI reforms, opens up defence|work=The Times of India|date=17 July 2014|access-date=1 August 2014|archive-date=6 January 2018|archive-url=https://web.archive.org/web/20180106104913/https://timesofindia.indiatimes.com/business/india-business/Govt-unleashes-big-bang-FDI-reforms-opens-up-defence/articleshow/21110866.cms|url-status=live}}</ref><ref>{{cite news|url=http://in.reuters.com/article/india-economy-retail-fdi-reform-idINDEE88D08M20120914|title=Govt allows FDI multi-brand retail, aviation in bold reform push|work=Reuters|date=14 September 2012|access-date=6 July 2021|archive-date=10 June 2020|archive-url=https://web.archive.org/web/20200610124354/https://in.reuters.com/article/india-economy-retail-fdi-reform-idINDEE88D08M20120914|url-status=live}}</ref> | ||
From 2000 to 2010, the country attracted $178 billion as FDI.<ref>{{cite web|url=http://www.dipp.nic.in/fdi_statistics/india_fdi_index.htm |title=India FDI Fact sheet – September 2010 |publisher=Department of Industrial Policy & Promotion, Ministry of Commerce and Industry |access-date=21 December 2010 |url-status=dead |archive-url=https://web.archive.org/web/20101216063528/http://www.dipp.nic.in/fdi_statistics/india_fdi_index.htm |archive-date=16 December 2010 }}</ref> The inordinately high investment from [[Mauritius]] is due to routing of international funds through the country given significant tax advantages – double taxation is avoided due to a [[Double taxation#Double taxation avoidance agreement signed by India|tax treaty]] between India and Mauritius, and Mauritius is a capital gains [[tax haven]], effectively creating a zero-taxation FDI channel.<ref>{{cite news|url=http://www.business-standard.com/india/news/jaimini-bhagwati-rationalising-fdi-taxes/418512/|title=Rationalising FDI taxes|newspaper=[[Business Standard]]|date=17 December 2010|first=Jaimini|last=Bhagwati|access-date=21 December 2010}}</ref> FDI accounted for 2.1% of India's GDP in 2015.<ref name="HDI" /> | From 2000 to 2010, the country attracted $178 billion as FDI.<ref>{{cite web|url=http://www.dipp.nic.in/fdi_statistics/india_fdi_index.htm |title=India FDI Fact sheet – September 2010 |publisher=Department of Industrial Policy & Promotion, Ministry of Commerce and Industry |access-date=21 December 2010 |url-status=dead |archive-url=https://web.archive.org/web/20101216063528/http://www.dipp.nic.in/fdi_statistics/india_fdi_index.htm |archive-date=16 December 2010 }}</ref> The inordinately high investment from [[Mauritius]] is due to routing of international funds through the country given significant tax advantages – double taxation is avoided due to a [[Double taxation#Double taxation avoidance agreement signed by India|tax treaty]] between India and Mauritius, and Mauritius is a capital gains [[tax haven]], effectively creating a zero-taxation FDI channel.<ref>{{cite news|url=http://www.business-standard.com/india/news/jaimini-bhagwati-rationalising-fdi-taxes/418512/|title=Rationalising FDI taxes|newspaper=[[Business Standard]]|date=17 December 2010|first=Jaimini|last=Bhagwati|access-date=21 December 2010|archive-date=9 November 2023|archive-url=https://web.archive.org/web/20231109223445/https://www.business-standard.com/search?q=news|url-status=live}}</ref> FDI accounted for 2.1% of India's GDP in 2015.<ref name="HDI" /> | ||
As the government has eased 87 foreign investment direct rules across 21 sectors in the last three years, FDI inflows hit $60.1 billion between 2016 and 2017 in India.<ref>{{cite web|url=http://www.hindustantimes.com/business-news/india-s-fdi-inflows-at-a-record-60-1-billion-in-2016-17/story-7a8pt2u7e8IJttptDQcwhO.html|title=India's FDI inflows at a record $60.1 billion in 2016–17|date=19 May 2017|website=Hindustan Times|access-date=2 November 2017}}</ref><ref>{{cite news|url=http://economictimes.indiatimes.com/news/economy/finance/fdi-jumps-37-to-10-4-billion-during-april-june-2017/articleshow/60163515.cms|title=FDI jumps 37% to $10.4 billion during April–June 2017|date=21 August 2017|access-date=2 November 2017|newspaper=The Economic Times}}</ref> | As the government has eased 87 foreign investment direct rules across 21 sectors in the last three years, FDI inflows hit $60.1 billion between 2016 and 2017 in India.<ref>{{cite web|url=http://www.hindustantimes.com/business-news/india-s-fdi-inflows-at-a-record-60-1-billion-in-2016-17/story-7a8pt2u7e8IJttptDQcwhO.html|title=India's FDI inflows at a record $60.1 billion in 2016–17|date=19 May 2017|website=Hindustan Times|access-date=2 November 2017|archive-date=21 October 2017|archive-url=https://web.archive.org/web/20171021213125/http://www.hindustantimes.com/business-news/india-s-fdi-inflows-at-a-record-60-1-billion-in-2016-17/story-7a8pt2u7e8IJttptDQcwhO.html|url-status=live}}</ref><ref>{{cite news|url=http://economictimes.indiatimes.com/news/economy/finance/fdi-jumps-37-to-10-4-billion-during-april-june-2017/articleshow/60163515.cms|title=FDI jumps 37% to $10.4 billion during April–June 2017|date=21 August 2017|access-date=2 November 2017|newspaper=The Economic Times|archive-date=27 September 2017|archive-url=https://web.archive.org/web/20170927072848/http://economictimes.indiatimes.com/news/economy/finance/fdi-jumps-37-to-10-4-billion-during-april-june-2017/articleshow/60163515.cms|url-status=live}}</ref> | ||
==== Outflows ==== | ==== Outflows ==== | ||
Since 2000, Indian companies have expanded overseas, investing FDI and creating jobs outside India. From 2006 to 2010, FDI by Indian companies outside India amounted to 1.34 per cent of its GDP.<ref>Shah and Patnaik, [http://www.imf.org/external/pubs/ft/wp/2011/wp1107.pdf India's financial globalisation] IMF (2012)</ref> Indian companies have deployed FDI and started operations in United States,<ref>{{cite news|url=https://www.wsj.com/news/articles/SB10001424052702304655304579552181391629024 |title=Mahindra Expands Effort to Counter Global Rivals with U.S. Engineering|work=The Wall Street Journal|date=9 May 2014}}</ref> Europe and Africa.<ref>{{cite news|url=http://businesstoday.intoday.in/story/bt-500-indian-inc-goes-global/1/189144.html |title=A Slice of World Action|work=Business Today|date=11 November 2012}}</ref> The Indian | Since 2000, Indian companies have expanded overseas, investing FDI and creating jobs outside India. From 2006 to 2010, FDI by Indian companies outside India amounted to 1.34 per cent of its GDP.<ref>Shah and Patnaik, [http://www.imf.org/external/pubs/ft/wp/2011/wp1107.pdf India's financial globalisation] {{Webarchive|url=https://web.archive.org/web/20160304054858/http://www.imf.org/external/pubs/ft/wp/2011/wp1107.pdf |date=4 March 2016 }} IMF (2012)</ref> Indian companies have deployed FDI and started operations in United States,<ref>{{cite news|url=https://www.wsj.com/news/articles/SB10001424052702304655304579552181391629024|title=Mahindra Expands Effort to Counter Global Rivals with U.S. Engineering|work=The Wall Street Journal|date=9 May 2014|access-date=13 March 2017|archive-date=15 March 2016|archive-url=https://web.archive.org/web/20160315084129/http://www.wsj.com/news/articles/SB10001424052702304655304579552181391629024|url-status=live}}</ref> Europe and Africa.<ref>{{cite news|url=http://businesstoday.intoday.in/story/bt-500-indian-inc-goes-global/1/189144.html|title=A Slice of World Action|work=Business Today|date=11 November 2012|access-date=1 August 2014|archive-date=8 August 2014|archive-url=https://web.archive.org/web/20140808052716/http://businesstoday.intoday.in/story/bt-500-indian-inc-goes-global/1/189144.html|url-status=live}}</ref> The Indian conglomerate [[Tata Group]] is United Kingdom's largest manufacturer and private-sector employer.<ref>{{cite news|url=http://www.economist.com/node/21528653|title=India's industrial outpost Tata for now|newspaper=The Economist|date=10 September 2011|access-date=1 August 2014|archive-date=28 May 2017|archive-url=https://web.archive.org/web/20170528051431/http://www.economist.com/node/21528653|url-status=live}}</ref><ref>{{cite news|url=https://www.telegraph.co.uk/finance/newsbysector/industry/9722673/JLRs-Ratan-Tata-warns-on-UK-competitiveness.html |archive-url=https://ghostarchive.org/archive/20220110/https://www.telegraph.co.uk/finance/newsbysector/industry/9722673/JLRs-Ratan-Tata-warns-on-UK-competitiveness.html |archive-date=10 January 2022 |url-access=subscription |url-status=live |title=JLR's Ratan Tata warns on UK competitiveness|work=The Telegraph|date=5 December 2012}}{{cbignore}}</ref> | ||
=== Remittances === | === Remittances === | ||
{{Main|Remittances to India}} | {{Main|Remittances to India}} | ||
In 2015, a total of US$68.91 billion was made in remittances to India from other countries, and a total of US$8.476 billion was made in remittances by foreign workers in India to their home countries. [[United Arab Emirates|UAE]], US, and [[Saudi Arabia]] were the top sources of remittances to India, while Bangladesh, Pakistan, and Nepal were the top recipients of remittances from India.<ref>{{cite web|url=http://www.pewglobal.org/interactives/remittance-map/|title=Remittance Flows Worldwide in 2015|date=31 August 2016|website=PewGlobal.org|access-date=2 November 2017}}</ref> Remittances to India accounted for 3.32% of the country's GDP in 2015.<ref name="HDI" /> | In 2015, a total of US$68.91 billion was made in remittances to India from other countries, and a total of US$8.476 billion was made in remittances by foreign workers in India to their home countries. [[United Arab Emirates|UAE]], US, and [[Saudi Arabia]] were the top sources of remittances to India, while Bangladesh, Pakistan, and Nepal were the top recipients of remittances from India.<ref>{{cite web|url=http://www.pewglobal.org/interactives/remittance-map/|title=Remittance Flows Worldwide in 2015|date=31 August 2016|website=PewGlobal.org|access-date=2 November 2017|archive-date=25 April 2017|archive-url=https://web.archive.org/web/20170425103928/http://www.pewglobal.org/interactives/remittance-map/|url-status=live}}</ref> Remittances to India accounted for 3.32% of the country's GDP in 2015.<ref name="HDI" /> | ||
=== Mergers and acquisitions === | === Mergers and acquisitions === | ||
Between 1985 and 2018 20,846 deals have been announced in, into (inbound) and out of (outbound) India. This cumulates to a value of US$618 billion. In terms of value, 2010 has been the most active year with deals worth almost 60 bil. USD. Most deals have been conducted in 2007 (1,510).<ref>{{Cite news|url=https://imaa-institute.org/m-and-a-statistics-countries/|title=M&A Statistics by Countries |work=Institute for Mergers, Acquisitions and Alliances (IMAA)|access-date=26 February 2018|language=en}}</ref> | Between 1985 and 2018 20,846 deals have been announced in, into (inbound) and out of (outbound) India. This cumulates to a value of US$618 billion. In terms of value, 2010 has been the most active year with deals worth almost 60 bil. USD. Most deals have been conducted in 2007 (1,510).<ref>{{Cite news|url=https://imaa-institute.org/m-and-a-statistics-countries/|title=M&A Statistics by Countries|work=Institute for Mergers, Acquisitions and Alliances (IMAA)|access-date=26 February 2018|language=en|archive-date=27 November 2020|archive-url=https://web.archive.org/web/20201127222829/https://imaa-institute.org/m-and-a-statistics-countries/|url-status=live}}</ref> | ||
Here is a list of the top 10 deals with Indian companies participating: | Here is a list of the top 10 deals with Indian companies participating: | ||
| Line 1,336: | Line 1,344: | ||
== Currency == | == Currency == | ||
{{Main|Indian rupee|Reserve Bank of India}} | {{Main|Indian rupee|Reserve Bank of India}} | ||
[[File:RBI-Tower.jpg|thumb | [[File:RBI-Tower.jpg|thumb|The [[Reserve Bank of India]]'s headquarters in [[Mumbai]], India]] | ||
'''{{Bullet}}EXCHANGE RATES''' | '''{{Bullet}}EXCHANGE RATES''' | ||
{| class="wikitable floatleft" style="text-align: center; " | {| class="wikitable floatleft" style="text-align: center; " | ||
|- | |- | ||
! Year !! INR{{INR}} per US$<br />(''annual average'')<ref>RBI Handbook of Statistics on Indian Economy</ref> !!INR{{INR}} per [[Pound sterling|Pound]](£)<br />(''annual average'')<ref>{{cite web|date=2018-12-28|title=1 GBP to INR in 1947 till Now, Historical Exchange Rates Explained|url=https://www.bookmyforex.com/blog/1-gbp-inr-1947-till-now/|access-date=2021-10-28|website=Blog-Best Foreign Exchange|language=en-US}}</ref> | ! Year !! INR{{INR}} per US$<br />(''annual average'')<ref>RBI Handbook of Statistics on Indian Economy</ref> !!INR{{INR}} per [[Pound sterling|Pound]](£)<br />(''annual average'')<ref>{{cite web|date=2018-12-28|title=1 GBP to INR in 1947 till Now, Historical Exchange Rates Explained|url=https://www.bookmyforex.com/blog/1-gbp-inr-1947-till-now/|access-date=2021-10-28|website=Blog-Best Foreign Exchange|language=en-US|archive-date=28 October 2021|archive-url=https://web.archive.org/web/20211028092128/https://www.bookmyforex.com/blog/1-gbp-inr-1947-till-now/|url-status=live}}</ref> | ||
|- | |- | ||
| 1947||{{color|red|3.31}}||{{color|red|13.33}} | | 1947||{{color|red|3.31}}||{{color|red|13.33}} | ||
| Line 1,381: | Line 1,389: | ||
|2020 | |2020 | ||
|{{color|red|72.97}}||{{color|red|100.05}} | |{{color|red|72.97}}||{{color|red|100.05}} | ||
|-<ref>{{cite web|title=Yearly Average Currency Exchange Rates {{!}} Internal Revenue Service|url=https://www.irs.gov/individuals/international-taxpayers/yearly-average-currency-exchange-rates|access-date=11 September 2020|website=www.irs.gov|language=en}}</ref> | |-<ref>{{cite web|title=Yearly Average Currency Exchange Rates {{!}} Internal Revenue Service|url=https://www.irs.gov/individuals/international-taxpayers/yearly-average-currency-exchange-rates|access-date=11 September 2020|website=www.irs.gov|language=en|archive-date=21 May 2017|archive-url=https://web.archive.org/web/20170521112855/https://www.irs.gov/individuals/international-taxpayers/yearly-average-currency-exchange-rates|url-status=live}}</ref> | ||
|- | |- | ||
|2021 | |2021 | ||
| Line 1,391: | Line 1,399: | ||
The rupee was linked to the [[British pound]] from 1927 to 1946, and then to US dollar until 1975 through a [[fixed exchange rate]]. It was devalued in September 1975 and the system of fixed par rate was replaced with a basket of four major international currencies: the British pound, US dollar, the [[Japanese yen]] and the [[Deutsche Mark]].<ref>{{Harvnb|Datt|Sundharam|2009|p=822}}</ref> In 1991, after the collapse of its largest trading partner, the Soviet Union, India faced the major foreign exchange crisis and the rupee was devalued by around 19% in two stages on 1 and 2 July. In 1992, a Liberalized Exchange Rate Mechanism (LERMS) was introduced. Under LERMS, exporters had to surrender 40 percent of their foreign exchange earnings to the RBI at the RBI-determined exchange rate; the remaining 60% could be converted at the market-determined exchange rate. In 1994, the rupee was convertible on the current account, with some capital controls.<ref>International Monetary Fund (1996), {{Google books|a0IuF5RmrbEC|1996 Annual Report on Exchange Arrangements & Exchange Restrictions}}, pages 224–226</ref> | The rupee was linked to the [[British pound]] from 1927 to 1946, and then to US dollar until 1975 through a [[fixed exchange rate]]. It was devalued in September 1975 and the system of fixed par rate was replaced with a basket of four major international currencies: the British pound, US dollar, the [[Japanese yen]] and the [[Deutsche Mark]].<ref>{{Harvnb|Datt|Sundharam|2009|p=822}}</ref> In 1991, after the collapse of its largest trading partner, the Soviet Union, India faced the major foreign exchange crisis and the rupee was devalued by around 19% in two stages on 1 and 2 July. In 1992, a Liberalized Exchange Rate Mechanism (LERMS) was introduced. Under LERMS, exporters had to surrender 40 percent of their foreign exchange earnings to the RBI at the RBI-determined exchange rate; the remaining 60% could be converted at the market-determined exchange rate. In 1994, the rupee was convertible on the current account, with some capital controls.<ref>International Monetary Fund (1996), {{Google books|a0IuF5RmrbEC|1996 Annual Report on Exchange Arrangements & Exchange Restrictions}}, pages 224–226</ref> | ||
After the sharp devaluation in 1991 and transition to current account convertibility in 1994, the value of the rupee has been largely determined by market forces. The rupee has been fairly stable during the decade 2000–2010. In October | After the sharp devaluation in 1991 and transition to current account convertibility in 1994, the value of the rupee has been largely determined by market forces. The rupee has been fairly stable during the decade 2000–2010. In October 2022, rupee touched an all-time low 83.29 to US dollar.<ref>[https://finance.yahoo.com/echarts?s=USDINR%3DX+Interactive#symbol=USDINR=X;range=2y USD INR] {{Webarchive|url=https://web.archive.org/web/20160711192414/http://finance.yahoo.com/echarts?s=USDINR%3DX+Interactive#symbol=USDINR=X;range=2y |date=11 July 2016 }} Currency Conversion Rates, Yahoo</ref> | ||
<ref>{{cite news |last1=Vora |first1=Nimesh |title=With Indian rupee near record low, cenbank steps up NDF intervention |url=https://www.reuters.com/markets/currencies/with-indian-rupee-near-record-low-cenbank-steps-up-ndf-intervention-2023-09-07/ |access-date=7 October 2023 |work=Reuters |date=7 September 2023 |archive-url=https://web.archive.org/web/20231007173754/https://www.reuters.com/markets/currencies/with-indian-rupee-near-record-low-cenbank-steps-up-ndf-intervention-2023-09-07/ |archive-date=7 October 2023 |language=en}}</ref> | |||
== Income and consumption == | == Income and consumption == | ||
| Line 1,397: | Line 1,406: | ||
{{Main|Income in India}} | {{Main|Income in India}} | ||
[[File:India vs World by Nominal GDP per capita in 2020.png|thumb|India vs world by nominal GDP per capita in 2020<ref name="GDP IMFb">{{cite web|url=https://www.imf.org/en/Publications/WEO/weo-database/2020/October/weo-report?c=512,914,612,614,311,213,911,314,193,122,912,313,419,513,316,913,124,339,638,514,218,963,616,223,516,918,748,618,624,522,622,156,626,628,228,924,233,632,636,634,238,662,960,423,935,128,611,321,243,248,469,253,642,643,939,734,644,819,172,132,646,648,915,134,652,174,328,258,656,654,336,263,268,532,944,176,534,536,429,433,178,436,136,343,158,439,916,664,826,542,967,443,917,544,941,446,666,668,672,946,137,546,674,676,548,556,678,181,867,682,684,273,868,921,948,943,686,688,518,728,836,558,138,196,278,692,694,962,142,449,564,565,283,853,288,293,566,964,182,359,453,968,922,714,862,135,716,456,722,942,718,724,576,936,961,813,726,199,733,184,524,361,362,364,732,366,144,146,463,528,923,738,578,537,742,866,369,744,186,925,869,746,926,466,112,111,298,927,846,299,582,487,474,754,698,&s=NGDPDPC,&sy=2020&ey=2020&ssm=0&scsm=1&scc=0&ssd=1&ssc=0&sic=0&sort=country&ds=.&br=1 |title=World Economic Outlook Database, October 2020 |publisher=[[International Monetary Fund]] |work=World Economic Outlook |date=October 2020 |access-date=13 October 2020 }}</ref>|400px]] | [[File:India vs World by Nominal GDP per capita in 2020.png|thumb|India vs world by nominal GDP per capita in 2020<ref name="GDP IMFb">{{cite web |url=https://www.imf.org/en/Publications/WEO/weo-database/2020/October/weo-report?c=512,914,612,614,311,213,911,314,193,122,912,313,419,513,316,913,124,339,638,514,218,963,616,223,516,918,748,618,624,522,622,156,626,628,228,924,233,632,636,634,238,662,960,423,935,128,611,321,243,248,469,253,642,643,939,734,644,819,172,132,646,648,915,134,652,174,328,258,656,654,336,263,268,532,944,176,534,536,429,433,178,436,136,343,158,439,916,664,826,542,967,443,917,544,941,446,666,668,672,946,137,546,674,676,548,556,678,181,867,682,684,273,868,921,948,943,686,688,518,728,836,558,138,196,278,692,694,962,142,449,564,565,283,853,288,293,566,964,182,359,453,968,922,714,862,135,716,456,722,942,718,724,576,936,961,813,726,199,733,184,524,361,362,364,732,366,144,146,463,528,923,738,578,537,742,866,369,744,186,925,869,746,926,466,112,111,298,927,846,299,582,487,474,754,698,&s=NGDPDPC,&sy=2020&ey=2020&ssm=0&scsm=1&scc=0&ssd=1&ssc=0&sic=0&sort=country&ds=.&br=1 |title=World Economic Outlook Database, October 2020 |publisher=[[International Monetary Fund]] |work=World Economic Outlook |date=October 2020 |access-date=13 October 2020 |archive-date=15 October 2020 |archive-url=https://web.archive.org/web/20201015091908/https://www.imf.org/en/Publications/WEO/weo-database/2020/October/weo-report?c=512,914,612,614,311,213,911,314,193,122,912,313,419,513,316,913,124,339,638,514,218,963,616,223,516,918,748,618,624,522,622,156,626,628,228,924,233,632,636,634,238,662,960,423,935,128,611,321,243,248,469,253,642,643,939,734,644,819,172,132,646,648,915,134,652,174,328,258,656,654,336,263,268,532,944,176,534,536,429,433,178,436,136,343,158,439,916,664,826,542,967,443,917,544,941,446,666,668,672,946,137,546,674,676,548,556,678,181,867,682,684,273,868,921,948,943,686,688,518,728,836,558,138,196,278,692,694,962,142,449,564,565,283,853,288,293,566,964,182,359,453,968,922,714,862,135,716,456,722,942,718,724,576,936,961,813,726,199,733,184,524,361,362,364,732,366,144,146,463,528,923,738,578,537,742,866,369,744,186,925,869,746,926,466,112,111,298,927,846,299,582,487,474,754,698,&s=NGDPDPC,&sy=2020&ey=2020&ssm=0&scsm=1&scc=0&ssd=1&ssc=0&sic=0&sort=country&ds=.&br=1 |url-status=live }}</ref>|400px]] | ||
[[File:GINI index World Bank up to 2018.png|alt=|thumb|280x280px|[[Gini coefficient|Gini index]] of India compared to other countries per [[World Bank]] data tables {{as of|2018||lc=y|post=}}<ref>{{cite web|title=GINI index (World Bank estimate) {{!}} Data|url=https://data.worldbank.org/indicator/SI.POV.GINI?view=map|access-date=23 July 2020|publisher=World Bank}}</ref>]] | [[File:GINI index World Bank up to 2018.png|alt=|thumb|280x280px|[[Gini coefficient|Gini index]] of India compared to other countries per [[World Bank]] data tables {{as of|2018||lc=y|post=}}<ref>{{cite web|title=GINI index (World Bank estimate) {{!}} Data|url=https://data.worldbank.org/indicator/SI.POV.GINI?view=map|access-date=23 July 2020|publisher=World Bank|archive-date=12 July 2016|archive-url=https://web.archive.org/web/20160712173327/https://data.worldbank.org/indicator/SI.POV.GINI?view=map|url-status=live}}</ref>]] | ||
India's [[gross national income]] per capita had experienced high growth rates since 2002. It tripled from {{INR}}19,040 in 2002–03 to {{INR}}53,331 in 2010–11, averaging 13.7% growth each of these eight years, with peak growth of 15.6% in 2010–11<ref>{{cite news|url=http://articles.timesofindia.indiatimes.com/2012-05-02/india-business/31537296_1_affordability-rental-income-home-price|archive-url=https://web.archive.org/web/20130510183020/http://articles.timesofindia.indiatimes.com/2012-05-02/india-business/31537296_1_affordability-rental-income-home-price|url-status=dead|archive-date=10 May 2013|newspaper=[[The Times of India]]|title= Homes become more affordable in last 10 years|date=2 May 2012}}</ref> and, growth in the inflation-adjusted per-capita income of the nation slowed to 5.6% in 2010–11, down from 6.4% in the previous year. These consumption levels are on an individual basis.<ref>{{cite web|url=http://web.worldbank.org/WBSITE/EXTERNAL/TOPICS/EXTPOVERTY/0,,menuPK:336998~pagePK:149018~piPK:149093~theSitePK:336992,00.html|title= Poverty reduction and equity (2010)|publisher=World Bank|date=July 2012|access-date=11 July 2012}}</ref> The average family income in India was $6,671 per household in 2011.<ref>[http://www.euromonitor.com/medialibrary/PDF/Book_WCIEP0.pdf Table 3.4, World Consumer Income and Expenditure Patterns – Annual Household Income] Euro Monitor International (2013)</ref> | India's [[gross national income]] per capita had experienced high growth rates since 2002. It tripled from {{INR}}19,040 in 2002–03 to {{INR}}53,331 in 2010–11, averaging 13.7% growth each of these eight years, with peak growth of 15.6% in 2010–11<ref>{{cite news|url=http://articles.timesofindia.indiatimes.com/2012-05-02/india-business/31537296_1_affordability-rental-income-home-price|archive-url=https://web.archive.org/web/20130510183020/http://articles.timesofindia.indiatimes.com/2012-05-02/india-business/31537296_1_affordability-rental-income-home-price|url-status=dead|archive-date=10 May 2013|newspaper=[[The Times of India]]|title= Homes become more affordable in last 10 years|date=2 May 2012}}</ref> and, growth in the inflation-adjusted per-capita income of the nation slowed to 5.6% in 2010–11, down from 6.4% in the previous year. These consumption levels are on an individual basis.<ref>{{cite web|url=http://web.worldbank.org/WBSITE/EXTERNAL/TOPICS/EXTPOVERTY/0,,menuPK:336998~pagePK:149018~piPK:149093~theSitePK:336992,00.html|title=Poverty reduction and equity (2010)|publisher=World Bank|date=July 2012|access-date=11 July 2012|archive-date=20 July 2012|archive-url=https://web.archive.org/web/20120720225227/http://web.worldbank.org/WBSITE/EXTERNAL/TOPICS/EXTPOVERTY/0,,menuPK:336998~pagePK:149018~piPK:149093~theSitePK:336992,00.html|url-status=live}}</ref> The average family income in India was $6,671 per household in 2011.<ref>[http://www.euromonitor.com/medialibrary/PDF/Book_WCIEP0.pdf Table 3.4, World Consumer Income and Expenditure Patterns – Annual Household Income] {{Webarchive|url=https://web.archive.org/web/20160705030928/http://www.euromonitor.com/medialibrary/PDF/Book_WCIEP0.pdf |date=5 July 2016 }} Euro Monitor International (2013)</ref> | ||
According to 2011 census data, India has about 330 million houses and 247 million households. The household size in India has dropped in recent years, the 2011 census reporting 50% of households have four or fewer members, with an average of 4.8 members per household including surviving grandparents.<ref name=hhc>{{cite web|title=Final Figures of Houselisting & Housing Census, 2011 Released|publisher=Census 2011, Government of India|date=13 March 2012|url=http://pib.nic.in/newsite/erelease.aspx?relid=80811}}</ref><ref>{{cite news|title=Median household size drops below 4 in cities|date=25 March 2012|url=http://articles.timesofindia.indiatimes.com/2012-03-25/india/31236370_1_household-family-size-census|archive-url=https://web.archive.org/web/20120906214655/http://articles.timesofindia.indiatimes.com/2012-03-25/india/31236370_1_household-family-size-census|url-status=dead|work=[[The Times of India]]|archive-date=6 September 2012}}</ref> These households produced a GDP of about $1.7 trillion.<ref>{{cite web|title=Country Report – India (2010)|publisher=The World Bank|year=2011|url=http://www.worldbank.org/en/country/india}}</ref> Consumption patterns note: approximately 67% of households use firewood, crop residue, or cow-dung cakes for cooking purposes; 53% do not have sanitation or drainage facilities on premises; 83% have water supply within their premises or {{convert|100|m}} from their house in urban areas and {{convert|500|m}} from the house in rural areas; 67% of the households have access to electricity; 63% of households have landline or mobile telephone service; 43% have a television; 26% have either a two- or four-wheel motor vehicle. Compared to 2001, these income and consumption trends represent moderate to significant improvements.<ref name=hhc /> One report in 2010 claimed that high-income households outnumber low-income households.<ref>{{cite news|first=Prabhakar|last=Sinha|url=http://articles.timesofindia.indiatimes.com/2010-08-01/india/28285817_1_households-middle-class-slowdown |archive-url=https://web.archive.org/web/20130612045150/http://articles.timesofindia.indiatimes.com/2010-08-01/india/28285817_1_households-middle-class-slowdown |url-status=dead |archive-date=12 June 2013 |title=India has more rich people than poor now |date=1 August 2010 |newspaper=[[The Times of India]]|access-date=15 November 2010}}</ref> | According to 2011 census data, India has about 330 million houses and 247 million households. The household size in India has dropped in recent years, the 2011 census reporting 50% of households have four or fewer members, with an average of 4.8 members per household including surviving grandparents.<ref name=hhc>{{cite web|title=Final Figures of Houselisting & Housing Census, 2011 Released|publisher=Census 2011, Government of India|date=13 March 2012|url=http://pib.nic.in/newsite/erelease.aspx?relid=80811|access-date=10 July 2012|archive-date=12 October 2016|archive-url=https://web.archive.org/web/20161012151338/http://pib.nic.in/newsite/erelease.aspx?relid=80811|url-status=live}}</ref><ref>{{cite news|title=Median household size drops below 4 in cities|date=25 March 2012|url=http://articles.timesofindia.indiatimes.com/2012-03-25/india/31236370_1_household-family-size-census|archive-url=https://web.archive.org/web/20120906214655/http://articles.timesofindia.indiatimes.com/2012-03-25/india/31236370_1_household-family-size-census|url-status=dead|work=[[The Times of India]]|archive-date=6 September 2012}}</ref> These households produced a GDP of about $1.7 trillion.<ref>{{cite web|title=Country Report – India (2010)|publisher=The World Bank|year=2011|url=http://www.worldbank.org/en/country/india|access-date=10 July 2012|archive-date=29 June 2012|archive-url=https://web.archive.org/web/20120629050630/http://www.worldbank.org/en/country/india|url-status=live}}</ref> Consumption patterns note: approximately 67% of households use firewood, crop residue, or cow-dung cakes for cooking purposes; 53% do not have sanitation or drainage facilities on premises; 83% have water supply within their premises or {{convert|100|m}} from their house in urban areas and {{convert|500|m}} from the house in rural areas; 67% of the households have access to electricity; 63% of households have landline or mobile telephone service; 43% have a television; 26% have either a two- or four-wheel motor vehicle. Compared to 2001, these income and consumption trends represent moderate to significant improvements.<ref name=hhc /> One report in 2010 claimed that high-income households outnumber low-income households.<ref>{{cite news|first=Prabhakar|last=Sinha|url=http://articles.timesofindia.indiatimes.com/2010-08-01/india/28285817_1_households-middle-class-slowdown |archive-url=https://web.archive.org/web/20130612045150/http://articles.timesofindia.indiatimes.com/2010-08-01/india/28285817_1_households-middle-class-slowdown |url-status=dead |archive-date=12 June 2013 |title=India has more rich people than poor now |date=1 August 2010 |newspaper=[[The Times of India]]|access-date=15 November 2010}}</ref> | ||
[[File:Countries by GNI (nominal, Atlas method) per capita in 2016.png|thumb|280px|Countries by nominal GNI per capita according to the [[Atlas method]] (2016)<ref name="wdi.worldbank.org">Table 2.9 of [http://wdi.worldbank.org/table/2.9 World Development Indicators: Distribution of income or consumption] The World Bank</ref>]] | [[File:Countries by GNI (nominal, Atlas method) per capita in 2016.png|thumb|280px|Countries by nominal GNI per capita according to the [[Atlas method]] (2016)<ref name="wdi.worldbank.org">Table 2.9 of [http://wdi.worldbank.org/table/2.9 World Development Indicators: Distribution of income or consumption] {{Webarchive|url=https://web.archive.org/web/20140923045844/http://wdi.worldbank.org/table/2.9 |date=23 September 2014 }} The World Bank</ref>]] | ||
New World Wealth publishes reports tracking the total wealth of countries, which is measured as the private wealth held by all residents of a country. According to New World Wealth, India's total wealth increased from $3,165 billion in 2007 to $8,230 billion in 2017, a growth rate of 160%. India's total wealth decreased by 1% from $8.23 trillion in 2017 to $8.148 trillion in 2018, making it the sixth wealthiest nation in the world. There are 20,730 multimillionaires (7th largest in the world)<ref>{{cite web|url=http://www.livemint.com/Money/0k6mJNHvCEZLvXSo7vg5TK/India-6th-wealthiest-country-in-the-world-with-total-wealth.html|title=India 6th wealthiest country with total wealth of $8,230 billion|date=30 January 2018|website=livemint.com/|access-date=18 February 2018}}</ref> and 118 billionaires in India (3rd largest in the world). With 327,100 high net-worth individuals (HNWI), India is home to the 9th highest number of HNWIs in the world. Mumbai is the wealthiest Indian city and the 12th wealthiest in the world, with a total net worth of $941 billion in 2018. Twenty-eight billionaires reside in the city, ranked ninth worldwide.<ref name="Global Wealth Migration Review">{{cite web|url=https://e.issuu.com/embed.html?u=newworldwealth&d=gwmr_2019|title=Global Wealth Migration Review|date=April 2019|website=issuu.com|publisher=New World Wealth|access-date=12 June 2019}}</ref> {{as of|2016|December|post=,}} the next wealthiest cities in India were [[Delhi]] ($450 billion), [[Bengaluru]] ($320 billion), [[Hyderabad]] ($310 billion), [[Kolkata]] ($290 billion), [[Chennai]] ($200 billion), and [[Gurugram]] ($110 billion).<ref>{{cite news|title='Mumbai richest Indian city with total wealth of $820 bn' – The Economic Times|url=http://economictimes.indiatimes.com/news/economy/finance/mumbai-richest-indian-city-with-total-wealth-of-820-bn/articleshow/57354354.cms|website=The Economic Times|access-date=26 February 2017}}</ref><ref>{{cite web|title=Mumbai richest Indian city with total wealth of $820 billion: Report|url=http://www.hindustantimes.com/business-news/mumbai-richest-indian-city-with-total-wealth-of-820-billion-report/story-G8SKgU3jmO3TaE6Skin1QJ.html|website=Hindustan Times|access-date=26 February 2017|date=26 February 2017}}</ref> | New World Wealth publishes reports tracking the total wealth of countries, which is measured as the private wealth held by all residents of a country. According to New World Wealth, India's total wealth increased from $3,165 billion in 2007 to $8,230 billion in 2017, a growth rate of 160%. India's total wealth decreased by 1% from $8.23 trillion in 2017 to $8.148 trillion in 2018, making it the sixth wealthiest nation in the world. There are 20,730 multimillionaires (7th largest in the world)<ref>{{cite web|url=http://www.livemint.com/Money/0k6mJNHvCEZLvXSo7vg5TK/India-6th-wealthiest-country-in-the-world-with-total-wealth.html|title=India 6th wealthiest country with total wealth of $8,230 billion|date=30 January 2018|website=livemint.com/|access-date=18 February 2018|archive-date=19 February 2018|archive-url=https://web.archive.org/web/20180219090307/http://www.livemint.com/Money/0k6mJNHvCEZLvXSo7vg5TK/India-6th-wealthiest-country-in-the-world-with-total-wealth.html|url-status=live}}</ref> and 118 billionaires in India (3rd largest in the world). With 327,100 high net-worth individuals (HNWI), India is home to the 9th highest number of HNWIs in the world. Mumbai is the wealthiest Indian city and the 12th wealthiest in the world, with a total net worth of $941 billion in 2018. Twenty-eight billionaires reside in the city, ranked ninth worldwide.<ref name="Global Wealth Migration Review">{{cite web|url=https://e.issuu.com/embed.html?u=newworldwealth&d=gwmr_2019|title=Global Wealth Migration Review|date=April 2019|website=issuu.com|publisher=New World Wealth|access-date=12 June 2019|archive-date=27 December 2019|archive-url=https://web.archive.org/web/20191227181506/https://e.issuu.com/embed.html?u=newworldwealth&d=gwmr_2019|url-status=live}}</ref> {{as of|2016|December|post=,}} the next wealthiest cities in India were [[Delhi]] ($450 billion), [[Bengaluru]] ($320 billion), [[Hyderabad]] ($310 billion), [[Kolkata]] ($290 billion), [[Chennai]] ($200 billion), and [[Gurugram]] ($110 billion).<ref>{{cite news|title='Mumbai richest Indian city with total wealth of $820 bn' – The Economic Times|url=http://economictimes.indiatimes.com/news/economy/finance/mumbai-richest-indian-city-with-total-wealth-of-820-bn/articleshow/57354354.cms|website=The Economic Times|access-date=26 February 2017|archive-date=26 February 2017|archive-url=https://web.archive.org/web/20170226200627/http://economictimes.indiatimes.com/news/economy/finance/mumbai-richest-indian-city-with-total-wealth-of-820-bn/articleshow/57354354.cms|url-status=live}}</ref><ref>{{cite web|title=Mumbai richest Indian city with total wealth of $820 billion: Report|url=http://www.hindustantimes.com/business-news/mumbai-richest-indian-city-with-total-wealth-of-820-billion-report/story-G8SKgU3jmO3TaE6Skin1QJ.html|website=Hindustan Times|access-date=26 February 2017|date=26 February 2017|archive-date=26 February 2017|archive-url=https://web.archive.org/web/20170226211225/http://www.hindustantimes.com/business-news/mumbai-richest-indian-city-with-total-wealth-of-820-billion-report/story-G8SKgU3jmO3TaE6Skin1QJ.html|url-status=live}}</ref> | ||
The ''Global Wealth Migration Review'' ''2019'' report, published by New World Wealth, found that 5,000 HNWI's emigrated from India in 2018, or about 2% of all HNWIs in the country. [[Australia]], [[Canada]], and United States were among the top destination countries.<ref>{{cite web|url=https://www.businessinsider.in/why-indias-millionaires-are-leaving-india/articleshow/69321959.cms|title=India's millionaires are fleeing from homeland – and these are the countries where they are headed|website=Business Insider|access-date=12 June 2019}}</ref> The report also projected that private wealth in India would grow by around 180% to reach $22,814 billion by 2028.<ref name="Global Wealth Migration Review" /> | The ''Global Wealth Migration Review'' ''2019'' report, published by New World Wealth, found that 5,000 HNWI's emigrated from India in 2018, or about 2% of all HNWIs in the country. [[Australia]], [[Canada]], and United States were among the top destination countries.<ref>{{cite web|url=https://www.businessinsider.in/why-indias-millionaires-are-leaving-india/articleshow/69321959.cms|title=India's millionaires are fleeing from homeland – and these are the countries where they are headed|website=Business Insider|access-date=12 June 2019|archive-date=26 August 2019|archive-url=https://web.archive.org/web/20190826225006/https://www.businessinsider.in/why-indias-millionaires-are-leaving-india/articleshow/69321959.cms|url-status=live}}</ref> The report also projected that private wealth in India would grow by around 180% to reach $22,814 billion by 2028.<ref name="Global Wealth Migration Review" /> | ||
=== Poverty === | === Poverty === | ||
{{Main|Poverty in India}} | {{Main|Poverty in India}} | ||
[[File:2012 Poverty distribution map in India by its states and union territories.svg|left|thumb|Poverty rate map of India by prevalence in 2012, among its states and union territories]] | [[File:2012 Poverty distribution map in India by its states and union territories.svg|left|thumb|Poverty rate map of India by prevalence in 2012, among its states and union territories]] | ||
In May 2014, the World Bank reviewed and proposed revisions to its poverty calculation methodology of 2005 and purchasing-power-parity basis for measuring poverty. According to the revised methodology, the world had 872.3 million people below the new poverty line, of which 179.6 million lived in India. With 17.5% of the total world's population, India had a 20.6% share of the world's poorest in 2013.<ref name=sdcnk>Note: 24.6% rate is based on '''2005 PPP''' at $1.25 per day, International dollar basis, {{cite book|last1=The World Bank|title=A measured approach to ending poverty and boosting shared prosperity|date=2015|publisher=World Bank Group|isbn=978-1-4648-0361-1|page=50|url=https://openknowledge.worldbank.org/bitstream/handle/10986/20384/9781464803611.pdf}}</ref> According to a 2005–2006 survey,<ref>[http://www.unicef.org/india/nutrition.html Nutrition], Fast Facts, UNICEF (2009)</ref> India had about 61 million children under the age of 5 who were chronically malnourished. A 2011 UNICEF report stated that between 1990 and 2010, India achieved a 45 percent reduction in mortality rates under the age of 5, and now ranks 46th of 188 countries on this metric.<ref>{{cite web|title=India Statistics|publisher=UNICEF, United Nations|year=2011|url=http://www.unicef.org/infobycountry/india_statistics.html|access-date=10 July 2012|archive-date=25 December 2018|archive-url=https://web.archive.org/web/20181225050318/https://www.unicef.org/infobycountry/india_statistics.html|url-status=dead}}</ref> | In May 2014, the World Bank reviewed and proposed revisions to its poverty calculation methodology of 2005 and purchasing-power-parity basis for measuring poverty. According to the revised methodology, the world had 872.3 million people below the new poverty line, of which 179.6 million lived in India. With 17.5% of the total world's population, India had a 20.6% share of the world's poorest in 2013.<ref name=sdcnk>Note: 24.6% rate is based on '''2005 PPP''' at $1.25 per day, International dollar basis, {{cite book|last1=The World Bank|title=A measured approach to ending poverty and boosting shared prosperity|date=2015|publisher=World Bank Group|isbn=978-1-4648-0361-1|page=50|url=https://openknowledge.worldbank.org/bitstream/handle/10986/20384/9781464803611.pdf|access-date=1 February 2015|archive-date=9 October 2016|archive-url=https://web.archive.org/web/20161009183315/https://openknowledge.worldbank.org/bitstream/handle/10986/20384/9781464803611.pdf|url-status=live}}</ref> According to a 2005–2006 survey,<ref>[http://www.unicef.org/india/nutrition.html Nutrition] {{Webarchive|url=https://web.archive.org/web/20141220054556/http://www.unicef.org/india/nutrition.html |date=20 December 2014 }}, Fast Facts, UNICEF (2009)</ref> India had about 61 million children under the age of 5 who were chronically malnourished. A 2011 UNICEF report stated that between 1990 and 2010, India achieved a 45 percent reduction in mortality rates under the age of 5, and now ranks 46th of 188 countries on this metric.<ref>{{cite web|title=India Statistics|publisher=UNICEF, United Nations|year=2011|url=http://www.unicef.org/infobycountry/india_statistics.html|access-date=10 July 2012|archive-date=25 December 2018|archive-url=https://web.archive.org/web/20181225050318/https://www.unicef.org/infobycountry/india_statistics.html|url-status=dead}}</ref> | ||
Since the early 1960s, successive governments have implemented various schemes to alleviate poverty, under central planning, that have met with partial success.<ref name="survey">{{cite web|title=Economic Survey 2004–2005|url=http://indiabudget.nic.in/es2004-05/esmain.htm|access-date=15 July 2006|archive-url=https://web.archive.org/web/20071216142417/http://indiabudget.nic.in/es2004-05/esmain.htm|archive-date=16 December 2007|url-status=dead}}</ref> In 2005, the government enacted the [[Mahatma Gandhi National Rural Employment Guarantee Act]] (MGNREGA), guaranteeing 100 days of minimum wage employment to every rural household in all the districts of India.<ref name="Panagariya 2008 146">{{Harvnb|Panagariya|2008|p=146}}</ref> In 2011, it was widely criticised and beset with controversy for corrupt officials, deficit financing as the source of funds, poor quality of infrastructure built under the programme, and unintended destructive effects.<ref name=wsj1>{{cite news|title=India's Boom Bypasses Rural Poor|newspaper=The Wall Street Journal|date=29 April 2011|author1=Tom Wright |author2=Harsh Gupta |url=https://www.wsj.com/articles/SB10001424052748704081604576143671902043578}}</ref><ref name=econ1>{{cite news|title=India rural welfare – Digging holes|newspaper=The Economist|date=5 November 2011|url=http://www.economist.com/node/21536642}}</ref><ref>{{cite news|title=Rural India enjoys consumption boom|work=Financial Times|date=29 February 2012|author1=James Fontanella-Khan |author2=James Lamont |url=http://www.ft.com/intl/cms/s/0/04473296-5865-11e1-9f28-00144feabdc0.html}}</ref> Other studies suggest that the programme has helped reduce rural poverty in some cases.<ref>Sarkar & Kumar (2011), [http://purl.umn.edu/119395 Impact of MGNREGA on Reducing Rural Poverty and Improving Socio-economic Status of Rural Poor: A Study in Burdwan District of West Bengal], Agricultural Economics Research Review, Vol 24</ref><ref>Swain & Ray (2013), Social welfare through guaranteed wage employment: experience of National Rural Employment Guarantee Scheme in an Indian state, Journal of International and Comparative Social Policy, 29(1), 79–90</ref> Yet other studies report that India's economic growth has been the driver of sustainable employment and poverty reduction, though a sizeable population remains in poverty.<ref>Aggarwal & Kumar (November 2012), [http://sswa.unescap.org/pdf/sswa_development_paper_1206_nov2012.pdf Structural change, industrialization and poverty reduction: the case of India], in United Nation's UNIDO workshop "The Untold Story: Structural Change for Poverty Reduction–The Case of the BRICS", Vienna, 16–17 August (pp 1–68)</ref><ref>Kotwal, Ramaswami & Wadhwa (2011), Economic liberalization and Indian economic growth: What's the evidence?, Journal of Economic Literature, Vol. 49, No. 4, 1152–1199</ref> India lifted 271 million people out of poverty between 2006 and 2016, recording the fastest reductions in the multidimensional poverty index values during the period with strong improvements in areas such as assets, cooking fuel, sanitation, and nutrition.<ref>{{cite news|url=https://www.thehindu.com/news/national/india-lifted-271-million-people-out-of-poverty-in-10-years-un/article28397694.ece|title=India lifted 271 million people out of poverty in 10 years: UN|newspaper=The Hindu}}</ref> | Since the early 1960s, successive governments have implemented various schemes to alleviate poverty, under central planning, that have met with partial success.<ref name="survey">{{cite web|title=Economic Survey 2004–2005|url=http://indiabudget.nic.in/es2004-05/esmain.htm|access-date=15 July 2006|archive-url=https://web.archive.org/web/20071216142417/http://indiabudget.nic.in/es2004-05/esmain.htm|archive-date=16 December 2007|url-status=dead}}</ref> In 2005, the government enacted the [[Mahatma Gandhi National Rural Employment Guarantee Act]] (MGNREGA), guaranteeing 100 days of minimum wage employment to every rural household in all the districts of India.<ref name="Panagariya 2008 146">{{Harvnb|Panagariya|2008|p=146}}</ref> In 2011, it was widely criticised and beset with controversy for corrupt officials, deficit financing as the source of funds, poor quality of infrastructure built under the programme, and unintended destructive effects.<ref name=wsj1>{{cite news|title=India's Boom Bypasses Rural Poor|newspaper=The Wall Street Journal|date=29 April 2011|author1=Tom Wright|author2=Harsh Gupta|url=https://www.wsj.com/articles/SB10001424052748704081604576143671902043578|access-date=3 August 2017|archive-date=16 July 2017|archive-url=https://web.archive.org/web/20170716054442/https://www.wsj.com/articles/SB10001424052748704081604576143671902043578|url-status=live}}</ref><ref name=econ1>{{cite news|title=India rural welfare – Digging holes|newspaper=The Economist|date=5 November 2011|url=http://www.economist.com/node/21536642|access-date=18 August 2012|archive-date=9 June 2012|archive-url=https://web.archive.org/web/20120609205426/http://www.economist.com/node/21536642|url-status=live}}</ref><ref>{{cite news|title=Rural India enjoys consumption boom|work=Financial Times|date=29 February 2012|author1=James Fontanella-Khan|author2=James Lamont|url=http://www.ft.com/intl/cms/s/0/04473296-5865-11e1-9f28-00144feabdc0.html|access-date=18 August 2012|archive-date=9 November 2023|archive-url=https://web.archive.org/web/20231109223444/https://www.ft.com/content/04473296-5865-11e1-9f28-00144feabdc0|url-status=live}}</ref> Other studies suggest that the programme has helped reduce rural poverty in some cases.<ref>Sarkar & Kumar (2011), [http://purl.umn.edu/119395 Impact of MGNREGA on Reducing Rural Poverty and Improving Socio-economic Status of Rural Poor: A Study in Burdwan District of West Bengal] {{Webarchive|url=https://web.archive.org/web/20231109223450/https://ageconsearch.umn.edu/record/119395 |date=9 November 2023 }}, Agricultural Economics Research Review, Vol 24</ref><ref>Swain & Ray (2013), Social welfare through guaranteed wage employment: experience of National Rural Employment Guarantee Scheme in an Indian state, Journal of International and Comparative Social Policy, 29(1), 79–90</ref> Yet other studies report that India's economic growth has been the driver of sustainable employment and poverty reduction, though a sizeable population remains in poverty.<ref>Aggarwal & Kumar (November 2012), [http://sswa.unescap.org/pdf/sswa_development_paper_1206_nov2012.pdf Structural change, industrialization and poverty reduction: the case of India] {{Webarchive|url=https://web.archive.org/web/20131127021556/http://sswa.unescap.org/pdf/SSWA_Development_Paper_1206_Nov2012.pdf |date=27 November 2013 }}, in United Nation's UNIDO workshop "The Untold Story: Structural Change for Poverty Reduction–The Case of the BRICS", Vienna, 16–17 August (pp 1–68)</ref><ref>Kotwal, Ramaswami & Wadhwa (2011), Economic liberalization and Indian economic growth: What's the evidence?, Journal of Economic Literature, Vol. 49, No. 4, 1152–1199</ref> India lifted 271 million people out of poverty between 2006 and 2016, recording the fastest reductions in the multidimensional poverty index values during the period with strong improvements in areas such as assets, cooking fuel, sanitation, and nutrition.<ref>{{cite news|url=https://www.thehindu.com/news/national/india-lifted-271-million-people-out-of-poverty-in-10-years-un/article28397694.ece|title=India lifted 271 million people out of poverty in 10 years: UN|newspaper=The Hindu|access-date=14 July 2019|archive-date=14 July 2019|archive-url=https://web.archive.org/web/20190714191602/https://www.thehindu.com/news/national/india-lifted-271-million-people-out-of-poverty-in-10-years-un/article28397694.ece|url-status=live}}</ref> | ||
On the 2019 [[Global Hunger Index]] India [[Global Hunger Index#Ranking|ranked 102nd]] (out of 117 countries), being categorized as 'serious' in severity. | On the 2019 [[Global Hunger Index]] India [[Global Hunger Index#Ranking|ranked 102nd]] (out of 117 countries), being categorized as 'serious' in severity. | ||
| Line 1,426: | Line 1,435: | ||
=== Unemployment === | === Unemployment === | ||
{{Main|Unemployment in India}} | {{Main|Unemployment in India}} | ||
Unemployment in India is characterised by [[Unemployment types#Hidden unemployment|chronic (disguised) unemployment]]. Government schemes that target eradication of both poverty and unemployment – which in recent decades has sent millions of poor and unskilled people into urban areas in search of livelihoods – attempt to solve the problem by providing financial assistance for starting businesses, honing skills, setting up public sector enterprises, reservations in governments, etc. The decline in organised employment, due to the decreased role of the public sector after liberalisation, has further underlined the need for focusing on better education and created political pressure for further reforms.{{sfn|Economic Survey|2010|pp=275–277}}<ref name="Datt-11">{{Harvnb|Datt|Sundharam|2009|pp=434–436}}</ref> India's labour regulations are heavy, even by developing country standards, and analysts have urged the government to abolish or modify them to make the environment more conducive for employment generation.<ref>{{Harvnb|Datt|Sundharam|2009|p=431}}</ref><ref>{{cite news|url=http://news.bbc.co.uk/2/hi/south_asia/4103554.stm| title=Why India needs labour law reform|publisher=BBC |date=27 June 2005|author=Kaushik Basu|access-date=16 December 2010| author-link=Kaushik Basu}}</ref> The [[Eleventh Five-Year Plan (India)|11th five-year plan]] has also identified the need for a congenial environment to be created for employment generation, by reducing the number of permissions and other bureaucratic clearances required.<ref>{{Harvnb|Datt|Sundharam|2009|p=434}}</ref> Inequalities and inadequacies in the education system have been identified as an obstacle, which prevents the benefits of increased employment opportunities from reaching all sectors of society.<ref>{{Harvnb|Drèze|Sen|1996|p=39}}</ref> | Unemployment in India is characterised by [[Unemployment types#Hidden unemployment|chronic (disguised) unemployment]]. Government schemes that target eradication of both poverty and unemployment – which in recent decades has sent millions of poor and unskilled people into urban areas in search of livelihoods – attempt to solve the problem by providing financial assistance for starting businesses, honing skills, setting up public sector enterprises, reservations in governments, etc. The decline in organised employment, due to the decreased role of the public sector after liberalisation, has further underlined the need for focusing on better education and created political pressure for further reforms.{{sfn|Economic Survey|2010|pp=275–277}}<ref name="Datt-11">{{Harvnb|Datt|Sundharam|2009|pp=434–436}}</ref> India's labour regulations are heavy, even by developing country standards, and analysts have urged the government to abolish or modify them to make the environment more conducive for employment generation.<ref>{{Harvnb|Datt|Sundharam|2009|p=431}}</ref><ref>{{cite news|url=http://news.bbc.co.uk/2/hi/south_asia/4103554.stm|title=Why India needs labour law reform|publisher=BBC|date=27 June 2005|author=Kaushik Basu|access-date=16 December 2010|author-link=Kaushik Basu|archive-date=25 December 2018|archive-url=https://web.archive.org/web/20181225053353/http://news.bbc.co.uk/2/hi/south_asia/4103554.stm|url-status=live}}</ref> The [[Eleventh Five-Year Plan (India)|11th five-year plan]] has also identified the need for a congenial environment to be created for employment generation, by reducing the number of permissions and other bureaucratic clearances required.<ref>{{Harvnb|Datt|Sundharam|2009|p=434}}</ref> Inequalities and inadequacies in the education system have been identified as an obstacle, which prevents the benefits of increased employment opportunities from reaching all sectors of society.<ref>{{Harvnb|Drèze|Sen|1996|p=39}}</ref> | ||
=== Child labour === | === Child labour === | ||
| Line 1,434: | Line 1,443: | ||
=== Diaspora employment === | === Diaspora employment === | ||
India has the largest diaspora around the world, an estimated | India has the largest diaspora around the world, an estimated 32 million people according to the [[Ministry of External Affairs (India)]],<ref>{{cite web |title=Population of Overseas Indians |url=https://www.mea.gov.in/population-of-overseas-indians.htm |website=www.mea.gov.in |access-date=7 October 2023 |archive-url=https://web.archive.org/web/20231007174555/https://www.mea.gov.in/population-of-overseas-indians.htm |archive-date=7 October 2023 |language=english}}</ref> many of whom work overseas and remit funds back to their families. The Middle East region is the largest source of employment for expat Indians. The crude oil production and infrastructure industry of Saudi Arabia employs over 2 million expat Indians. Cities such as [[Dubai]] and [[Abu Dhabi]] in United Arab Emirates have employed another 2 million Indians during the construction boom in recent decades.<ref>Leone Lakhani, [http://edition.cnn.com/2014/05/15/business/dubai-indians-expats-elections/ Dubai's expat Indians: The world's most productive foreign workers] {{Webarchive|url=https://web.archive.org/web/20170324225631/http://edition.cnn.com/2014/05/15/business/dubai-indians-expats-elections/ |date=24 March 2017 }} CNN (19 May 2014)</ref> In 2009–10, [[Remittances to India|remittances]] from Indian migrants overseas stood at {{INRConvert|2.5|t|lk=on|year=2010}}, the highest in the world, but their share in FDI remained low at around 1%.<ref>{{cite web|url=http://www.tribuneindia.com/2011/20110110/main1.htm|title=NRIs don't invest as much as they remit, says Montek|work=The Tribune|location=India|date=9 January 2011|first=Ajay|last=Banerjee|access-date=13 January 2011|archive-date=4 March 2016|archive-url=https://web.archive.org/web/20160304080943/http://www.tribuneindia.com/2011/20110110/main1.htm|url-status=live}}</ref> | ||
=== Trade unions === | === Trade unions === | ||
| Line 1,441: | Line 1,450: | ||
[[AITUC]] is the oldest trade union in India. It is a left supported organization. | [[AITUC]] is the oldest trade union in India. It is a left supported organization. | ||
A trade union with nearly 2,000,000 members is the Self Employed Women's Association (SEWA) which protects the rights of Indian women working in the informal economy. In addition to the protection of rights, SEWA educates, mobilizes, finances, and exalts their members' trades.<ref>{{Cite journal|last=Datta|first=Rekah|title=From Development to Empowerment: The Self-Employed Women's Association in India|journal=International Journal of Politics, Culture, and Society}}</ref> Multiple other organizations represent workers. These organizations are formed upon different political groups. These different groups allow different groups of people with different political views to join a Union.<ref>{{cite web |last= Chand |first=Smriti |title= 6 Major Central Trade Unions of India |url= http://www.yourarticlelibrary.com/trade-unions/6-major-central-trade-unions-of-india-trade-unions/26113 |website= Your Article Library |access-date= 2017-11-15|date=17 February 2014 }}</ref> | A trade union with nearly 2,000,000 members is the Self Employed Women's Association (SEWA) which protects the rights of Indian women working in the informal economy. In addition to the protection of rights, SEWA educates, mobilizes, finances, and exalts their members' trades.<ref>{{Cite journal|last=Datta|first=Rekah|title=From Development to Empowerment: The Self-Employed Women's Association in India|journal=International Journal of Politics, Culture, and Society}}</ref> Multiple other organizations represent workers. These organizations are formed upon different political groups. These different groups allow different groups of people with different political views to join a Union.<ref>{{cite web |last= Chand |first= Smriti |title= 6 Major Central Trade Unions of India |url= http://www.yourarticlelibrary.com/trade-unions/6-major-central-trade-unions-of-india-trade-unions/26113 |website= Your Article Library |access-date= 2017-11-15 |date= 17 February 2014 |archive-date= 29 June 2022 |archive-url= https://web.archive.org/web/20220629101329/https://www.yourarticlelibrary.com/trade-unions/6-major-central-trade-unions-of-india-trade-unions/26113 |url-status= live }}</ref> | ||
== Economic issues == | == Economic issues == | ||
| Line 1,458: | Line 1,467: | ||
{{Legend|#bf0000|9 – 0}} | {{Legend|#bf0000|9 – 0}} | ||
{{Legend|#c0c0c0|No data}}]] | {{Legend|#c0c0c0|No data}}]] | ||
Corruption has been a pervasive problem in India.<ref>[https://papers.ssrn.com/sol3/papers.cfm?abstract_id=2993646 India: Potential for a Parliamentary Budget Office]. Social Science Research Network (SSRN). Retrieved 18 July 2017.</ref> A 2005 study by [[Transparency International]] (TI) found that more than half of those surveyed had first-hand experience of paying a bribe or peddling influence to get a job done in a public office in the previous year.<ref name="2005-TI-study" /> A follow-up study in 2008 found this rate to be 40 percent.<ref>{{cite web|title=India Corruption Study – 2008|publisher=Transparency International|year=2008|url=http://www.transparencyindia.org/resource/survey_study/India%20Corruptino%20Study%202008.pdf|access-date=15 July 2012|archive-url=https://web.archive.org/web/20120619212155/http://www.transparencyindia.org/resource/survey_study/India%20Corruptino%20Study%202008.pdf|archive-date=19 June 2012|url-status=dead}}</ref> In 2011, TI ranked India at 95th place amongst 183 countries in perceived levels of public sector corruption.<ref name="transparency1">{{cite web|url=http://cpi.transparency.org/cpi2011/interactive2/| title= Corruption Perceptions Index 2011|publisher=Transparency International|access-date=9 July 2012}}</ref> By 2016, India saw a reduction in corruption, and its ranking improved to 79th place.<ref>{{cite web|last1=e.V.|first1=Transparency International|title=Corruption Perceptions Index 2016|url=https://www.transparency.org/news/feature/corruption_perceptions_index_2016|website=transparency.org|access-date=18 February 2018}}</ref> | Corruption has been a pervasive problem in India.<ref>[https://papers.ssrn.com/sol3/papers.cfm?abstract_id=2993646 India: Potential for a Parliamentary Budget Office] {{Webarchive|url=https://web.archive.org/web/20180603144231/https://papers.ssrn.com/sol3/papers.cfm?abstract_id=2993646 |date=3 June 2018 }}. Social Science Research Network (SSRN). Retrieved 18 July 2017.</ref> A 2005 study by [[Transparency International]] (TI) found that more than half of those surveyed had first-hand experience of paying a bribe or peddling influence to get a job done in a public office in the previous year.<ref name="2005-TI-study" /> A follow-up study in 2008 found this rate to be 40 percent.<ref>{{cite web|title=India Corruption Study – 2008|publisher=Transparency International|year=2008|url=http://www.transparencyindia.org/resource/survey_study/India%20Corruptino%20Study%202008.pdf|access-date=15 July 2012|archive-url=https://web.archive.org/web/20120619212155/http://www.transparencyindia.org/resource/survey_study/India%20Corruptino%20Study%202008.pdf|archive-date=19 June 2012|url-status=dead}}</ref> In 2011, TI ranked India at 95th place amongst 183 countries in perceived levels of public sector corruption.<ref name="transparency1">{{cite web|url=http://cpi.transparency.org/cpi2011/interactive2/|title=Corruption Perceptions Index 2011|publisher=Transparency International|access-date=9 July 2012|archive-date=20 November 2012|archive-url=https://web.archive.org/web/20121120045916/http://cpi.transparency.org/cpi2011/interactive2/|url-status=dead}}</ref> By 2016, India saw a reduction in corruption, and its ranking improved to 79th place.<ref>{{cite web|last1=e.V.|first1=Transparency International|title=Corruption Perceptions Index 2016|url=https://www.transparency.org/news/feature/corruption_perceptions_index_2016|website=transparency.org|access-date=18 February 2018|archive-date=25 January 2017|archive-url=https://web.archive.org/web/20170125081958/https://www.transparency.org/news/feature/corruption_perceptions_index_2016|url-status=live}}</ref> | ||
In 1996, [[red tape]], bureaucracy, and the [[Licence Raj]] were suggested as a cause for the institutionalised corruption and inefficiency.<ref>{{Harvnb|Drèze|Sen|1996|p=180}}</ref> More recent reports<ref name=kpmg2011>{{cite web|title=Survey on Bribery and Corruption – Impact on Economy and Business Environment|publisher=KPMG|year=2011|url=http://www.kpmg.com/IN/en/IssuesAndInsights/ThoughtLeadership/KPMG_Bribery_Survey_Report_new.pdf}}</ref><ref name=WFR2011>{{cite web|title=Corruption in India|publisher=The World Finance Review|author=Debroy and Bhandari|year=2011|url=http://www.worldfinancialreview.com/?p=1575}}</ref><ref>{{cite news|title=Corruption in India – A rotten state|newspaper=The Economist|date=10 March 2011|url=http://www.economist.com/node/18332796}}</ref> suggest the causes of corruption include excessive regulations and approval requirements, mandated spending programs, monopoly of certain goods and service providers by government-controlled institutions, bureaucracy with discretionary powers, and lack of transparent laws and processes. | In 1996, [[red tape]], bureaucracy, and the [[Licence Raj]] were suggested as a cause for the institutionalised corruption and inefficiency.<ref>{{Harvnb|Drèze|Sen|1996|p=180}}</ref> More recent reports<ref name=kpmg2011>{{cite web|title=Survey on Bribery and Corruption – Impact on Economy and Business Environment|publisher=KPMG|year=2011|url=http://www.kpmg.com/IN/en/IssuesAndInsights/ThoughtLeadership/KPMG_Bribery_Survey_Report_new.pdf|access-date=15 July 2012|archive-date=6 May 2016|archive-url=https://web.archive.org/web/20160506184127/http://www.kpmg.com/IN/en/IssuesAndInsights/ThoughtLeadership/KPMG_Bribery_Survey_Report_new.pdf|url-status=live}}</ref><ref name=WFR2011>{{cite web|title=Corruption in India|publisher=The World Finance Review|author=Debroy and Bhandari|year=2011|url=http://www.worldfinancialreview.com/?p=1575|access-date=15 July 2012|archive-date=1 May 2014|archive-url=https://web.archive.org/web/20140501135424/http://www.worldfinancialreview.com/?p=1575|url-status=live}}</ref><ref>{{cite news|title=Corruption in India – A rotten state|newspaper=The Economist|date=10 March 2011|url=http://www.economist.com/node/18332796|access-date=15 July 2012|archive-date=18 August 2012|archive-url=https://web.archive.org/web/20120818134512/http://www.economist.com/node/18332796|url-status=live}}</ref> suggest the causes of corruption include excessive regulations and approval requirements, mandated spending programs, monopoly of certain goods and service providers by government-controlled institutions, bureaucracy with discretionary powers, and lack of transparent laws and processes. | ||
Computerisation of services, various central and state vigilance commissions, and the 2005 [[Right to Information Act]] – which requires government officials to furnish information requested by citizens or face punitive action – have considerably reduced corruption and opened avenues to redress grievances.<ref name="2005-TI-study">{{cite web|url=http://www.cmsindia.org/cms/events/corruption.pdf| title= India Corruption Study 2005| author=Transparency International India| publisher=Centre for Media Studies|access-date = 14 March 2008| archive-url = https://web.archive.org/web/20070415110720/http://www.cmsindia.org/cms/events/corruption.pdf| archive-date =15 April 2007}}</ref> | Computerisation of services, various central and state vigilance commissions, and the 2005 [[Right to Information Act]] – which requires government officials to furnish information requested by citizens or face punitive action – have considerably reduced corruption and opened avenues to redress grievances.<ref name="2005-TI-study">{{cite web|url=http://www.cmsindia.org/cms/events/corruption.pdf| title= India Corruption Study 2005| author=Transparency International India| publisher=Centre for Media Studies|access-date = 14 March 2008| archive-url = https://web.archive.org/web/20070415110720/http://www.cmsindia.org/cms/events/corruption.pdf| archive-date =15 April 2007}}</ref> | ||
In 2011, the Indian government concluded that most spending fails to reach its intended recipients, as the large and inefficient bureaucracy consumes budgets.<ref name="bajuraj">{{cite news|url=http://www.economist.com/displaystory.cfm?story_id=10804248|title= India's civil service: Battling the babu raj|newspaper=The Economist|date=6 March 2008|access-date=8 January 2011}}</ref> India's absence rates are among the worst in the world; one study found that 25% of public sector teachers and 40% of government-owned public-sector medical workers could not be found at the workplace.<ref>{{cite web|url=http://econ.ucsd.edu/~kamurali/teachers%20and%20medical%20worker%20incentives%20in%20india.pdf |title=Teachers and Medical Worker Incentives in India |first=Karthik|last=Muralidharan |publisher=University of California |access-date=21 June 2009 |url-status=dead |archive-url=https://web.archive.org/web/20090326211644/http://econ.ucsd.edu/~kamurali/teachers%20and%20medical%20worker%20incentives%20in%20india.pdf |archive-date=26 March 2009 }}</ref><ref>{{cite news|url=http://news.bbc.co.uk/1/hi/world/south_asia/4051353.stm|title=Combating India's truant teachers|publisher=BBC |date=29 November 2004|first=Kaushik|last=Basu|access-date=9 January 2011}}</ref> Similarly, many issues are facing Indian scientists, with demands for transparency, a [[meritocratic]] system, and an overhaul of the bureaucratic agencies that oversee science and technology.<ref name="Nature">{{cite journal|last= Jayaraman |first=K.S. |title=Report row ousts top Indian scientist |volume=462 |issue=7270 |page=152 |journal=Nature | date=9 November 2009 |pmid=19907467 |doi=10.1038/462152a |doi-access=free }}</ref> | In 2011, the Indian government concluded that most spending fails to reach its intended recipients, as the large and inefficient bureaucracy consumes budgets.<ref name="bajuraj">{{cite news|url=http://www.economist.com/displaystory.cfm?story_id=10804248|title=India's civil service: Battling the babu raj|newspaper=The Economist|date=6 March 2008|access-date=8 January 2011|archive-date=30 May 2008|archive-url=https://web.archive.org/web/20080530044857/http://www.economist.com/displayStory.cfm?story_id=10804248|url-status=live}}</ref> India's absence rates are among the worst in the world; one study found that 25% of public sector teachers and 40% of government-owned public-sector medical workers could not be found at the workplace.<ref>{{cite web|url=http://econ.ucsd.edu/~kamurali/teachers%20and%20medical%20worker%20incentives%20in%20india.pdf |title=Teachers and Medical Worker Incentives in India |first=Karthik|last=Muralidharan |publisher=University of California |access-date=21 June 2009 |url-status=dead |archive-url=https://web.archive.org/web/20090326211644/http://econ.ucsd.edu/~kamurali/teachers%20and%20medical%20worker%20incentives%20in%20india.pdf |archive-date=26 March 2009 }}</ref><ref>{{cite news|url=http://news.bbc.co.uk/1/hi/world/south_asia/4051353.stm|title=Combating India's truant teachers|publisher=BBC|date=29 November 2004|first=Kaushik|last=Basu|access-date=9 January 2011|archive-date=15 February 2009|archive-url=https://web.archive.org/web/20090215104757/http://news.bbc.co.uk/1/hi/world/south_asia/4051353.stm|url-status=live}}</ref> Similarly, many issues are facing Indian scientists, with demands for transparency, a [[meritocratic]] system, and an overhaul of the bureaucratic agencies that oversee science and technology.<ref name="Nature">{{cite journal|last= Jayaraman |first=K.S. |title=Report row ousts top Indian scientist |volume=462 |issue=7270 |page=152 |journal=Nature | date=9 November 2009 |pmid=19907467 |doi=10.1038/462152a |doi-access=free }}</ref> | ||
India has an [[underground economy]], with a 2006 report alleging that India topped the worldwide list for [[Indian black money|black money]] with almost $1,456 billion stashed in Swiss banks. This would amount to 13 times the country's total external debt.<ref>{{cite web|url=http://www.deccanherald.com/content/134580/laundering-black-money.html|title=Laundering black money|work=Deccan Herald |location=India|date=4 February 2011|author=Kuldip Nayar|access-date=6 February 2011|author-link=Kuldip Nayar}}</ref><ref>{{cite news|url=http://www.thehindubusinessline.in/2010/08/13/stories/2010081350370900.htm|title=Black, bold and bountiful|newspaper=Business Line|date=13 August 2010|author=V. Venkateswara Rao|access-date=6 February 2011|archive-url=https://web.archive.org/web/20110918110326/http://www.thehindubusinessline.in/2010/08/13/stories/2010081350370900.htm|archive-date=18 September 2011|url-status=dead}}</ref> These allegations have been denied by the [[Swiss Banking Association]]. James Nason, the Head of International Communications for the Swiss Banking Association, suggested "The (black money) figures were rapidly picked up in the Indian media and in Indian opposition circles, and circulated as gospel truth. However, this story was a complete fabrication. The Swiss Bankers Association never published such a report. Anyone claiming to have such figures (for India) should be forced to identify their source and explain the methodology used to produce them."<ref>{{cite news|title=No 'black money' statistics exist: Swiss banks|date=13 September 2009|url=http://articles.timesofindia.indiatimes.com/2009-09-13/india/28092452_1_james-nason-swiss-bankers-association-sba-s-head|archive-url=https://web.archive.org/web/20110912101749/http://articles.timesofindia.indiatimes.com/2009-09-13/india/28092452_1_james-nason-swiss-bankers-association-sba-s-head|url-status=dead|newspaper=[[The Times of India]]|archive-date=12 September 2011}}</ref><ref>{{cite news|title=Banking secrecy spices up Indian elections|publisher=SWISSINFO – A member of Swiss Broadcasting Corporation|date=14 May 2009|url=http://www.swissinfo.ch/eng/politics/foreign_affairs/Banking_secrecy_spices_up_Indian_elections.html?cid=7396340}}</ref> | India has an [[underground economy]], with a 2006 report alleging that India topped the worldwide list for [[Indian black money|black money]] with almost $1,456 billion stashed in Swiss banks. This would amount to 13 times the country's total external debt.<ref>{{cite web|url=http://www.deccanherald.com/content/134580/laundering-black-money.html|title=Laundering black money|work=Deccan Herald|location=India|date=4 February 2011|author=Kuldip Nayar|access-date=6 February 2011|author-link=Kuldip Nayar|archive-date=23 September 2015|archive-url=https://web.archive.org/web/20150923224835/http://www.deccanherald.com/content/134580/laundering-black-money.html|url-status=live}}</ref><ref>{{cite news|url=http://www.thehindubusinessline.in/2010/08/13/stories/2010081350370900.htm|title=Black, bold and bountiful|newspaper=Business Line|date=13 August 2010|author=V. Venkateswara Rao|access-date=6 February 2011|archive-url=https://web.archive.org/web/20110918110326/http://www.thehindubusinessline.in/2010/08/13/stories/2010081350370900.htm|archive-date=18 September 2011|url-status=dead}}</ref> These allegations have been denied by the [[Swiss Banking Association]]. James Nason, the Head of International Communications for the Swiss Banking Association, suggested "The (black money) figures were rapidly picked up in the Indian media and in Indian opposition circles, and circulated as gospel truth. However, this story was a complete fabrication. The Swiss Bankers Association never published such a report. Anyone claiming to have such figures (for India) should be forced to identify their source and explain the methodology used to produce them."<ref>{{cite news|title=No 'black money' statistics exist: Swiss banks|date=13 September 2009|url=http://articles.timesofindia.indiatimes.com/2009-09-13/india/28092452_1_james-nason-swiss-bankers-association-sba-s-head|archive-url=https://web.archive.org/web/20110912101749/http://articles.timesofindia.indiatimes.com/2009-09-13/india/28092452_1_james-nason-swiss-bankers-association-sba-s-head|url-status=dead|newspaper=[[The Times of India]]|archive-date=12 September 2011}}</ref><ref>{{cite news|title=Banking secrecy spices up Indian elections|publisher=SWISSINFO – A member of Swiss Broadcasting Corporation|date=14 May 2009|url=http://www.swissinfo.ch/eng/politics/foreign_affairs/Banking_secrecy_spices_up_Indian_elections.html?cid=7396340|access-date=28 June 2012|archive-date=26 September 2013|archive-url=https://web.archive.org/web/20130926182809/http://www.swissinfo.ch/eng/politics/foreign_affairs/Banking_secrecy_spices_up_Indian_elections.html?cid=7396340|url-status=live}}</ref> | ||
A Step was taken by Prime Minister Modi, on 8 November 2016, involved the demonetization of all 500 and 1000 rupee bank notes (replaced by new 500 and 2000 rupee notes) to return black money into the economy followed by criticism that the measure was deemed ineffective by economists and negatively affected the poorest people of India. This [[2016 Indian banknote demonetisation|demonetisation]] together with the introduction of The [[Goods and Services Tax (India)|goods and services tax(GST)]] is believed to be responsible for the slowdown in growth.<ref>{{Cite web |date=2020-01-20 |title=Understanding India's Economic Slowdown |url=https://www.theindiaforum.in/article/understanding-india-s-economic-slowdown |access-date=2022-06-14 |website=The India Forum |language=en}}</ref> | A Step was taken by Prime Minister Modi, on 8 November 2016, involved the demonetization of all 500 and 1000 rupee bank notes (replaced by new 500 and 2000 rupee notes) to return black money into the economy followed by criticism that the measure was deemed ineffective by economists and negatively affected the poorest people of India. This [[2016 Indian banknote demonetisation|demonetisation]] together with the introduction of The [[Goods and Services Tax (India)|goods and services tax(GST)]] is believed to be responsible for the slowdown in growth.<ref>{{Cite web |date=2020-01-20 |title=Understanding India's Economic Slowdown |url=https://www.theindiaforum.in/article/understanding-india-s-economic-slowdown |access-date=2022-06-14 |website=The India Forum |language=en |archive-date=11 June 2022 |archive-url=https://web.archive.org/web/20220611212419/https://www.theindiaforum.in/article/understanding-india-s-economic-slowdown |url-status=live }}</ref> | ||
=== Education === | === Education === | ||
{{Main|Education in India | Literacy in India}} | {{Main|Education in India | Literacy in India}} | ||
[[File:Calcutta university 1870.jpg|left|thumb | [[File:Calcutta university 1870.jpg|left|thumb|[[University of Calcutta]], established in 1857, was the first multidisciplinary and secular Western-style institution in Asia.]] | ||
India has made progress in increasing the primary education attendance rate and expanding [[Literacy in India|literacy]] to approximately three-fourths of the population.<ref name="wbie">{{cite web|url=http://go.worldbank.org/OSFVRGA240|title=Education in India|publisher=World Bank|access-date=13 January 2011}}</ref> India's literacy rate had grown from 52.2% in 1991 to 74.04% in 2011. The right to education at the elementary level has been made one of the fundamental rights under the Eighty-Sixth Amendment of 2002, and legislation has been enacted to further the objective of providing free education to all children.{{sfn|Economic Survey|2010|pp=280–281}} However, the literacy rate of 74% is lower than the worldwide average, and the country suffers from a high drop-out rate.<ref name="elephant">{{cite news|url=http://www.economist.com/specialreports/displayStory.cfm?story_id=12749735|title=A special report on India: An elephant, not a tiger|date=11 December 2008|newspaper=The Economist|access-date=17 January 2011}}</ref> Literacy rates and educational opportunities vary by region, gender, urban and rural areas, and among different social groups.<ref>{{Harvnb|Drèze|Sen|1996|pp=114–115}}</ref><ref>[http://censusindia.gov.in/2011-prov-results/data_files/india/Final_PPT_2011_chapter6.pdf Ranking of states and union territories by lireacy rate: 2011] Census of India, Ministry of Home Affairs, Government of India (2013)</ref> | India has made progress in increasing the primary education attendance rate and expanding [[Literacy in India|literacy]] to approximately three-fourths of the population.<ref name="wbie">{{cite web|url=http://go.worldbank.org/OSFVRGA240|title=Education in India|publisher=World Bank|access-date=13 January 2011}}</ref> India's literacy rate had grown from 52.2% in 1991 to 74.04% in 2011. The right to education at the elementary level has been made one of the fundamental rights under the Eighty-Sixth Amendment of 2002, and legislation has been enacted to further the objective of providing free education to all children.{{sfn|Economic Survey|2010|pp=280–281}} However, the literacy rate of 74% is lower than the worldwide average, and the country suffers from a high drop-out rate.<ref name="elephant">{{cite news|url=http://www.economist.com/specialreports/displayStory.cfm?story_id=12749735|title=A special report on India: An elephant, not a tiger|date=11 December 2008|newspaper=The Economist|access-date=17 January 2011|archive-date=25 December 2018|archive-url=https://web.archive.org/web/20181225053405/https://www.economist.com/special-report/2008/12/11/an-elephant-not-a-tiger|url-status=live}}</ref> Literacy rates and educational opportunities vary by region, gender, urban and rural areas, and among different social groups.<ref>{{Harvnb|Drèze|Sen|1996|pp=114–115}}</ref><ref>[http://censusindia.gov.in/2011-prov-results/data_files/india/Final_PPT_2011_chapter6.pdf Ranking of states and union territories by lireacy rate: 2011] {{Webarchive|url=https://web.archive.org/web/20150706191931/http://censusindia.gov.in/2011-prov-results/data_files/india/Final_PPT_2011_chapter6.pdf |date=6 July 2015 }} Census of India, Ministry of Home Affairs, Government of India (2013)</ref> | ||
=== Economic disparities === | === Economic disparities === | ||
{{Main|Economic disparities in India|Poverty in India}} | {{Main|Economic disparities in India|Poverty in India}} | ||
[[File:NSDP Per Capita of Indian States and UT's, 2018-19.png|thumb | [[File:NSDP Per Capita of Indian States and UT's, 2018-19.png|thumb|Economic disparities among the states and union territories of India, on GDP per capita, [[Purchasing power parity|PPP basis]], and GDP per capita basis in 2011]] | ||
{{Blockquote|Poverty rates in India's poorest states are three to four times higher than those in the more advanced states. While India's average annual per capita income was $1,410 in 2011 – placing it among the poorest of the world's middle-income countries – it was just $436 in Uttar Pradesh (which has more people than Brazil) and only $294 in Bihar, one of India's poorest states.|World Bank: India Country Overview 2013<ref name="wboverview">{{cite news|url=http://www.worldbank.org/en/country/india/overview|title=India Country Overview 2013|year=2014|newspaper=World Bank|access-date=28 July 2014}}</ref>}} | {{Blockquote|Poverty rates in India's poorest states are three to four times higher than those in the more advanced states. While India's average annual per capita income was $1,410 in 2011 – placing it among the poorest of the world's middle-income countries – it was just $436 in Uttar Pradesh (which has more people than Brazil) and only $294 in Bihar, one of India's poorest states.|World Bank: India Country Overview 2013<ref name="wboverview">{{cite news|url=http://www.worldbank.org/en/country/india/overview|title=India Country Overview 2013|year=2014|newspaper=World Bank|access-date=28 July 2014|archive-date=2 May 2017|archive-url=https://web.archive.org/web/20170502113421/http://www.worldbank.org/en/country/india/overview|url-status=live}}</ref>}} | ||
A critical problem facing India's economy is the sharp and growing regional variations among India's different states and territories in terms of poverty, availability of infrastructure, and socio-economic development.<ref name="Datt-13">{{Harvnb|Datt|Sundharam|2009|pp=474–475}}</ref> Six low-income states – [[Assam]], Chhattisgarh, [[Nagaland]], Madhya Pradesh, [[Odisha]], and [[Uttar Pradesh]] – are home to more than one-third of India's population.<ref name="wbstrategy">{{cite web|url=http://www.ukibc.com/ukindia2/files/India60.pdf |title=Country Strategy for India (CAS) 2009–2012 |publisher=World Bank |access-date=21 June 2009 |url-status=dead |archive-url=https://web.archive.org/web/20090114195859/http://www.ukibc.com/ukindia2/files/India60.pdf |archive-date=14 January 2009 }}</ref> Severe disparities exist among states in terms of income, literacy rates, life expectancy, and living conditions.<ref>{{Harvnb|Drèze|Sen|1996|pp=45–46}}</ref> The four states of Maharashtra, Tamil Nadu, Gujarat and Karnataka alone are projected to account for almost 50% of India's GDP by 2030; the five [[South India|South Indian states]] are projected to contribute 35% of India's GDP by 2030 despite currently having 20% of India's population.<ref>{{Cite news |date=2023-06-09 |title=Southern states to contribute 35% of | A critical problem facing India's economy is the sharp and growing regional variations among India's different states and territories in terms of poverty, availability of infrastructure, and socio-economic development.<ref name="Datt-13">{{Harvnb|Datt|Sundharam|2009|pp=474–475}}</ref> Six low-income states – [[Assam]], Chhattisgarh, [[Nagaland]], Madhya Pradesh, [[Odisha]], and [[Uttar Pradesh]] – are home to more than one-third of India's population.<ref name="wbstrategy">{{cite web|url=http://www.ukibc.com/ukindia2/files/India60.pdf |title=Country Strategy for India (CAS) 2009–2012 |publisher=World Bank |access-date=21 June 2009 |url-status=dead |archive-url=https://web.archive.org/web/20090114195859/http://www.ukibc.com/ukindia2/files/India60.pdf |archive-date=14 January 2009 }}</ref> Severe disparities exist among states in terms of income, literacy rates, life expectancy, and living conditions.<ref>{{Harvnb|Drèze|Sen|1996|pp=45–46}}</ref> The four states of Maharashtra, Tamil Nadu, Gujarat and Karnataka alone are projected to account for almost 50% of India's GDP by 2030; the five [[South India|South Indian states]] are projected to contribute 35% of India's GDP by 2030 despite currently having 20% of India's population.<ref>{{Cite news |date=2023-06-09 |title=Southern states to contribute 35% of India's $7 trillion economy by 2030 |work=The Times of India |url=https://timesofindia.indiatimes.com/city/chennai/southern-states-to-contribute-35-of-indias-7tn-economy-by-2030/articleshow/100862819.cms?from=mdr |access-date=2023-09-06 |issn=0971-8257 |archive-date=6 September 2023 |archive-url=https://web.archive.org/web/20230906030550/https://timesofindia.indiatimes.com/city/chennai/southern-states-to-contribute-35-of-indias-7tn-economy-by-2030/articleshow/100862819.cms?from=mdr |url-status=live }}</ref> | ||
The five-year plans, especially in the pre-liberalisation era, attempted to reduce regional disparities by encouraging industrial development in the interior regions and distributing industries across states. The results have been discouraging as these measures increased inefficiency and hampered effective industrial growth.<ref>{{Harvnb|Panagariya|2008|pp=164–165}}</ref> The more advanced states have been better placed to benefit from liberalisation, with well-developed infrastructure and an educated and skilled workforce, which attract the manufacturing and service sectors. Governments of less-advanced states have tried to reduce disparities by offering tax holidays and cheap land and focused on sectors like tourism, which can develop faster than other sectors.<ref name="understanding-2">{{cite web|author1=Sachs, D. Jeffrey |author2=Bajpai, Nirupam |author3=Ramiah, Ananthi |title=Understanding Regional Economic Growth in India|year=2002|work=Working paper 88|url=http://www2.cid.harvard.edu/cidwp/088.pdf|archive-url=https://web.archive.org/web/20070701042205/http://www2.cid.harvard.edu/cidwp/088.pdf|publisher=Harvard University|archive-date=1 July 2007}}</ref><ref name="planning-2">{{cite web|author=Kurian, N.J.|title=Regional disparities in india|url=http://planningcommission.nic.in/reports/sereport/ser/vision2025/regdsprty.doc|publisher=Planning Commission of India|access-date=6 August 2005|archive-date=5 November 2018|archive-url=https://web.archive.org/web/20181105050844/http://planningcommission.nic.in/reports/sereport/ser/vision2025/regdsprty.doc|url-status=dead}}</ref> India's income [[Gini coefficient]] is 33.9, according to the United Nations Development Program (UNDP), indicating overall income distribution to be more uniform than East Asia, Latin America, and Africa.<ref name="GINI index" /> The ''Global Wealth Migration Review'' ''2019'' report, published by New World Wealth, estimated that 48% of India's total wealth was held by high-net-worth individuals.<ref name="Global Wealth Migration Review" /> | The five-year plans, especially in the pre-liberalisation era, attempted to reduce regional disparities by encouraging industrial development in the interior regions and distributing industries across states. The results have been discouraging as these measures increased inefficiency and hampered effective industrial growth.<ref>{{Harvnb|Panagariya|2008|pp=164–165}}</ref> The more advanced states have been better placed to benefit from liberalisation, with well-developed infrastructure and an educated and skilled workforce, which attract the manufacturing and service sectors. Governments of less-advanced states have tried to reduce disparities by offering tax holidays and cheap land and focused on sectors like tourism, which can develop faster than other sectors.<ref name="understanding-2">{{cite web|author1=Sachs, D. Jeffrey |author2=Bajpai, Nirupam |author3=Ramiah, Ananthi |title=Understanding Regional Economic Growth in India|year=2002|work=Working paper 88|url=http://www2.cid.harvard.edu/cidwp/088.pdf|archive-url=https://web.archive.org/web/20070701042205/http://www2.cid.harvard.edu/cidwp/088.pdf|publisher=Harvard University|archive-date=1 July 2007}}</ref><ref name="planning-2">{{cite web|author=Kurian, N.J.|title=Regional disparities in india|url=http://planningcommission.nic.in/reports/sereport/ser/vision2025/regdsprty.doc|publisher=Planning Commission of India|access-date=6 August 2005|archive-date=5 November 2018|archive-url=https://web.archive.org/web/20181105050844/http://planningcommission.nic.in/reports/sereport/ser/vision2025/regdsprty.doc|url-status=dead}}</ref> India's income [[Gini coefficient]] is 33.9, according to the United Nations Development Program (UNDP), indicating overall income distribution to be more uniform than East Asia, Latin America, and Africa.<ref name="GINI index" /> The ''Global Wealth Migration Review'' ''2019'' report, published by New World Wealth, estimated that 48% of India's total wealth was held by high-net-worth individuals.<ref name="Global Wealth Migration Review" /> | ||
There is a continuing debate on whether India's economic expansion has been pro-poor or anti-poor.<ref name=darwb>Datt & Ravallion (2011), Has India's economic growth become more pro-poor in the wake of economic reforms?, The World Bank Economic Review, 25(2), pp 157–189</ref> Studies suggest that economic growth has been pro-poor and has reduced [[poverty in India]].<ref name=darwb /><ref>Tripathi, Sabyasachi (December 2013), [http://mpra.ub.uni-muenchen.de/52336/1/MPRA_paper_52336.pdf Has urban economic growth in Post-Reform India been pro-poor between 1993–94 and 2009–10?] Indian Council for Research on International Economic Relations, MPRA Paper No. 52336, Ludwig Maximilians Universität München</ref> | There is a continuing debate on whether India's economic expansion has been pro-poor or anti-poor.<ref name=darwb>Datt & Ravallion (2011), Has India's economic growth become more pro-poor in the wake of economic reforms?, The World Bank Economic Review, 25(2), pp 157–189</ref> Studies suggest that economic growth has been pro-poor and has reduced [[poverty in India]].<ref name=darwb /><ref>Tripathi, Sabyasachi (December 2013), [http://mpra.ub.uni-muenchen.de/52336/1/MPRA_paper_52336.pdf Has urban economic growth in Post-Reform India been pro-poor between 1993–94 and 2009–10?] {{Webarchive|url=https://web.archive.org/web/20181104083338/https://mpra.ub.uni-muenchen.de/52336/1/MPRA_paper_52336.pdf |date=4 November 2018 }} Indian Council for Research on International Economic Relations, MPRA Paper No. 52336, Ludwig Maximilians Universität München</ref> | ||
=== Climate change === | === Climate change === | ||
| Line 1,499: | Line 1,508: | ||
Change}} | Change}} | ||
{| class="wikitable" | {| class="wikitable" | ||
! colspan="3" |India External Debt – Historical Data<ref>{{Cite web |title=External Debt of India |url=https://dea.gov.in/external-debt |website=dea.gov.in}}</ref><ref>{{Cite web |title=Debt – World Bank Open Data |url=https://data.worldbank.org/indicator/GC.DOD.TOTL.GD.ZS?locations=IN |access-date=2023-05-29 |website=World Bank Open Data}}</ref><ref>{{Cite web |title=Debt |url=https://m.rbi.org.in//scripts/FS_PressRelease.aspx?prid=53948&fn=2759 |access-date=2023-05-29 |website=m.rbi.org.in}}</ref> | ! colspan="3" |India External Debt – Historical Data<ref>{{Cite web |title=External Debt of India |url=https://dea.gov.in/external-debt |website=dea.gov.in |access-date=29 May 2023 |archive-date=30 November 2022 |archive-url=https://web.archive.org/web/20221130001959/https://dea.gov.in/external-debt |url-status=live }}</ref><ref>{{Cite web |title=Debt – World Bank Open Data |url=https://data.worldbank.org/indicator/GC.DOD.TOTL.GD.ZS?locations=IN |access-date=2023-05-29 |website=World Bank Open Data |archive-date=30 May 2023 |archive-url=https://web.archive.org/web/20230530121930/https://data.worldbank.org/indicator/GC.DOD.TOTL.GD.ZS?locations=IN |url-status=live }}</ref><ref>{{Cite web |title=Debt |url=https://m.rbi.org.in//scripts/FS_PressRelease.aspx?prid=53948&fn=2759 |access-date=2023-05-29 |website=m.rbi.org.in |archive-date=29 May 2023 |archive-url=https://web.archive.org/web/20230529131711/https://m.rbi.org.in//scripts/FS_PressRelease.aspx?prid=53948&fn=2759 |url-status=live }}</ref> | ||
|- | |- | ||
!Year | !Year | ||
| Line 1,521: | Line 1,530: | ||
|1.87% | |1.87% | ||
|- | |- | ||
|2017 | |style="background:#FFB6C1;"|2017 | ||
|$511,472,593,374 | |style="background:#FFB6C1;"|$511,472,593,374 | ||
|12.29% | |style="background:#FFB6C1;"|12.29% | ||
|- | |- | ||
|2016 | |2016 | ||
| Line 1,724: | Line 1,733: | ||
* [[Startup India]] | * [[Startup India]] | ||
* [[Taxation in medieval India]] | * [[Taxation in medieval India]] | ||
* [[Political funding in India]] | |||
'''Events:''' | '''Events:''' | ||
| Line 1,757: | Line 1,767: | ||
* {{cite book|last=Alamgir| first=Jalal |title=India's Open-Economy Policy|publisher=[[Routledge]]|year=2008|isbn=978-0-415-77684-4| title-link=India's Open-Economy Policy }} | * {{cite book|last=Alamgir| first=Jalal |title=India's Open-Economy Policy|publisher=[[Routledge]]|year=2008|isbn=978-0-415-77684-4| title-link=India's Open-Economy Policy }} | ||
* {{cite book|last=Bharadwaj|first= Krishna|year=1991|chapter = Regional differentiation in India|editor=Sathyamurthy, T.V|title=Industry & agriculture in India since independence| pages=189–199|publisher=Oxford University Press| isbn=0-19-564394-1}} | * {{cite book|last=Bharadwaj|first= Krishna|year=1991|chapter = Regional differentiation in India|editor=Sathyamurthy, T.V|title=Industry & agriculture in India since independence| pages=189–199|publisher=Oxford University Press| isbn=0-19-564394-1}} | ||
* Malone, David M., C. Raja Mohan, and Srinath Raghavan, eds. ''The Oxford handbook of Indian foreign policy'' (2015) [https://www.amazon.com/Oxford-Handbook-Indian-Foreign-Policy/dp/0198799063/ excerpt] pp 609–649. | * Malone, David M., C. Raja Mohan, and Srinath Raghavan, eds. ''The Oxford handbook of Indian foreign policy'' (2015) [https://www.amazon.com/Oxford-Handbook-Indian-Foreign-Policy/dp/0198799063/ excerpt] {{Webarchive|url=https://web.archive.org/web/20210915060518/https://www.amazon.com/Oxford-Handbook-Indian-Foreign-Policy/dp/0198799063 |date=15 September 2021 }} pp 609–649. | ||
;Papers and reports | ;Papers and reports | ||
* Bahl, R., Heredia-Ortiz, E., Martinez-Vazquez, J., & Rider, M. (2005). ''[https://ideas.repec.org/p/ays/ispwps/paper05141.html India: Fiscal Condition of the States, International Experience, and Options for Reform: Volume 1]'' (No. paper05141). International Center for Public Policy, Andrew Young School of Policy Studies, Georgia State University. | * Bahl, R., Heredia-Ortiz, E., Martinez-Vazquez, J., & Rider, M. (2005). ''[https://ideas.repec.org/p/ays/ispwps/paper05141.html India: Fiscal Condition of the States, International Experience, and Options for Reform: Volume 1] {{Webarchive|url=https://web.archive.org/web/20161201221108/https://ideas.repec.org/p/ays/ispwps/paper05141.html |date=1 December 2016 }}'' (No. paper05141). International Center for Public Policy, Andrew Young School of Policy Studies, Georgia State University. | ||
* {{cite web|url=http://harrisschool.uchicago.edu/News/press-releases/IPP%20Economic%20Reform%20in%20India.pdf|publisher=University of Chicago|page=32|title=Economic reforms in India: Task force report|ref={{harvid|Task Force Report|2006}}|url-status=dead|archive-url=https://web.archive.org/web/20090207125338/http://harrisschool.uchicago.edu/News/press-releases/IPP%20Economic%20Reform%20in%20India.pdf|archive-date=7 February 2009}} | * {{cite web|url=http://harrisschool.uchicago.edu/News/press-releases/IPP%20Economic%20Reform%20in%20India.pdf|publisher=University of Chicago|page=32|title=Economic reforms in India: Task force report|ref={{harvid|Task Force Report|2006}}|url-status=dead|archive-url=https://web.archive.org/web/20090207125338/http://harrisschool.uchicago.edu/News/press-releases/IPP%20Economic%20Reform%20in%20India.pdf|archive-date=7 February 2009}} | ||
* {{cite web|url=http://indiabudget.nic.in/es2009-10/chapt2010/chapter.zip|title=Economic Survey 2009–10|publisher=Ministry of Finance, Government of India|page=294|ref={{harvid|Economic Survey|2010}}|access-date=22 November 2010|archive-url=https://web.archive.org/web/20101205025143/http://indiabudget.nic.in/es2009-10/chapt2010/chapter.zip|archive-date=5 December 2010|url-status=dead}} | * {{cite web|url=http://indiabudget.nic.in/es2009-10/chapt2010/chapter.zip|title=Economic Survey 2009–10|publisher=Ministry of Finance, Government of India|page=294|ref={{harvid|Economic Survey|2010}}|access-date=22 November 2010|archive-url=https://web.archive.org/web/20101205025143/http://indiabudget.nic.in/es2009-10/chapt2010/chapter.zip|archive-date=5 December 2010|url-status=dead}} | ||
| Line 1,766: | Line 1,776: | ||
;Articles | ;Articles | ||
* {{cite web|title=Growth of India|url=http://www.janderie.live.haverford.edu/wiki/index.php?title=India_growth|access-date=10 August 2005|url-status=dead|archive-url=https://web.archive.org/web/20130615234241/http://www.janderie.live.haverford.edu/wiki/index.php?title=India_growth|archive-date=15 June 2013}} | * {{cite web|title=Growth of India|url=http://www.janderie.live.haverford.edu/wiki/index.php?title=India_growth|access-date=10 August 2005|url-status=dead|archive-url=https://web.archive.org/web/20130615234241/http://www.janderie.live.haverford.edu/wiki/index.php?title=India_growth|archive-date=15 June 2013}} | ||
* {{cite web|title=Milton Friedman on the Nehru/Mahalanobis Plan|url=http://www.indiapolicy.org/debate/Notes/fried_opinion.html|access-date=16 July 2005}} | * {{cite web|title=Milton Friedman on the Nehru/Mahalanobis Plan|url=http://www.indiapolicy.org/debate/Notes/fried_opinion.html|access-date=16 July 2005|archive-date=31 March 2016|archive-url=https://web.archive.org/web/20160331032602/http://indiapolicy.org/debate/Notes/fried_opinion.html|url-status=live}} | ||
* {{cite web|title=Infrastructure in India: Requirements and favourable climate for foreign investment|url=http://www.asiatradehub.com/india/intro.asp|access-date=14 August 2005|url-status=dead|archive-url=https://web.archive.org/web/20050713073856/http://www.asiatradehub.com/india/intro.asp|archive-date=13 July 2005}} | * {{cite web|title=Infrastructure in India: Requirements and favourable climate for foreign investment|url=http://www.asiatradehub.com/india/intro.asp|access-date=14 August 2005|url-status=dead|archive-url=https://web.archive.org/web/20050713073856/http://www.asiatradehub.com/india/intro.asp|archive-date=13 July 2005}} | ||
* {{Cite journal |author1=Bernardi, Luigi|author2=Fraschini, Angela|title=Tax System And Tax Reforms in India|year=2005|version=Working paper n. 51|url=https://ideas.repec.org/p/uca/ucapdv/45.html |journal=Polis Working Papers}} | * {{Cite journal|author1=Bernardi, Luigi|author2=Fraschini, Angela|title=Tax System And Tax Reforms in India|year=2005|version=Working paper n. 51|url=https://ideas.repec.org/p/uca/ucapdv/45.html|journal=Polis Working Papers|access-date=14 November 2015|archive-date=29 June 2017|archive-url=https://web.archive.org/web/20170629132746/https://ideas.repec.org/p/uca/ucapdv/45.html|url-status=live}} | ||
* {{Cite report |author=Centre for Media Studies |title=India Corruption Study 2005: To Improve Governance Volume – I: Key Highlights |publisher=Transparency International India |year=2005 |url=http://www.prajanet.org/newsroom/internal/tii/ICS2k5_Vol1.pdf |access-date=21 June 2009 |archive-url=https://web.archive.org/web/20090326211644/http://www.prajanet.org/newsroom/internal/tii/ICS2k5_Vol1.pdf |archive-date=26 March 2009 |work=Transparenty International India|via=PrajaNet}} | * {{Cite report |author=Centre for Media Studies |title=India Corruption Study 2005: To Improve Governance Volume – I: Key Highlights |publisher=Transparency International India |year=2005 |url=http://www.prajanet.org/newsroom/internal/tii/ICS2k5_Vol1.pdf |access-date=21 June 2009 |archive-url=https://web.archive.org/web/20090326211644/http://www.prajanet.org/newsroom/internal/tii/ICS2k5_Vol1.pdf |archive-date=26 March 2009 |work=Transparenty International India |via=PrajaNet }} | ||
* {{cite web |author=Ghosh, Jayati |title=Bank Nationalisation: The Record |work=Macroscan |url=http://www.macroscan.com/cur/jul05/cur210705Bank_Nationalisation.htm |access-date=5 August 2005 |url-status=dead |archive-url=https://web.archive.org/web/20051023070928/http://www.macroscan.com/cur/jul05/cur210705Bank_Nationalisation.htm |archive-date=23 October 2005 }} | * {{cite web |author=Ghosh, Jayati |title=Bank Nationalisation: The Record |work=Macroscan |url=http://www.macroscan.com/cur/jul05/cur210705Bank_Nationalisation.htm |access-date=5 August 2005 |url-status=dead |archive-url=https://web.archive.org/web/20051023070928/http://www.macroscan.com/cur/jul05/cur210705Bank_Nationalisation.htm |archive-date=23 October 2005 }} | ||
* {{Cite conference |author1=Gordon, Jim|author2=Gupta, Poonam|title=Understanding India's Services Revolution |book-title=A Tale of Two Giants: India's and China's Experience with Reform and Growth |year=2003 |url=http://www.imf.org/external/np/apd/seminars/2003/newdelhi/gordon.pdf|access-date=21 June 2009}} | * {{Cite conference|author1=Gordon, Jim|author2=Gupta, Poonam|title=Understanding India's Services Revolution|book-title=A Tale of Two Giants: India's and China's Experience with Reform and Growth|year=2003|url=http://www.imf.org/external/np/apd/seminars/2003/newdelhi/gordon.pdf|access-date=21 June 2009|archive-date=26 March 2009|archive-url=https://web.archive.org/web/20090326211643/http://www.imf.org/external/np/apd/seminars/2003/newdelhi/gordon.pdf|url-status=live}} | ||
* {{Cite journal |author=Panagariya, Arvind|title=India in the 1980s and 1990s: A Triumph of Reforms |journal=International Trade |year=2004|url=https://ideas.repec.org/p/wpa/wuwpit/0403005.html}} | * {{Cite journal|author=Panagariya, Arvind|title=India in the 1980s and 1990s: A Triumph of Reforms|journal=International Trade|year=2004|url=https://ideas.repec.org/p/wpa/wuwpit/0403005.html|access-date=14 November 2015|archive-date=4 March 2016|archive-url=https://web.archive.org/web/20160304133045/https://ideas.repec.org/p/wpa/wuwpit/0403005.html|url-status=live}} | ||
* {{cite web |author1=Sachs, D. Jeffrey|author2=Bajpai, Nirupam|author3=Ramiah, Ananthi|title=Understanding Regional Economic Growth in India |website=Center for International Development at Harvard University |year=2002|version=Working paper 88|url=http://www2.cid.harvard.edu/cidwp/088.pdf|archive-url=https://web.archive.org/web/20070701042206/http://www.ksg.harvard.edu/CID/cidwp/088.pdf|archive-date=1 July 2007}} | * {{cite web|author1=Sachs, D. Jeffrey|author2=Bajpai, Nirupam|author3=Ramiah, Ananthi|title=Understanding Regional Economic Growth in India|website=Center for International Development at Harvard University|year=2002|version=Working paper 88|url=http://www2.cid.harvard.edu/cidwp/088.pdf|archive-url=https://web.archive.org/web/20070701042206/http://www.ksg.harvard.edu/CID/cidwp/088.pdf|archive-date=1 July 2007}} | ||
* {{cite web|author=Kurian, N.J.|title=Regional disparities in india|url=http://planningcommission.nic.in/reports/sereport/ser/vision2025/regdsprty.doc|access-date=6 August 2005|archive-date=5 November 2018|archive-url=https://web.archive.org/web/20181105050844/http://planningcommission.nic.in/reports/sereport/ser/vision2025/regdsprty.doc|url-status=dead}} | * {{cite web|author=Kurian, N.J.|title=Regional disparities in india|url=http://planningcommission.nic.in/reports/sereport/ser/vision2025/regdsprty.doc|access-date=6 August 2005|archive-date=5 November 2018|archive-url=https://web.archive.org/web/20181105050844/http://planningcommission.nic.in/reports/sereport/ser/vision2025/regdsprty.doc|url-status=dead}} | ||
* {{cite journal|url=https://www.academia.edu/3347336|title=India Inc. and its Moral Discontent|first=Ravinder|last=Kaur|journal=Economic and Political Weekly|year=2012}} | * {{cite journal|url=https://www.academia.edu/3347336|title=India Inc. and its Moral Discontent|first=Ravinder|last=Kaur|journal=Economic and Political Weekly|year=2012|access-date=10 May 2015|archive-date=27 March 2023|archive-url=https://web.archive.org/web/20230327062412/https://www.academia.edu/3347336|url-status=live}} | ||
* {{cite web |url=http://static-curis.ku.dk/portal/files/137464936/Good_Times_Brand_Modi_TVNM.pdf |title=Good Times, Brought to you by Brand Modi |first=Ravinder |last=Kaur |year=2015 }} | * {{cite web |url=http://static-curis.ku.dk/portal/files/137464936/Good_Times_Brand_Modi_TVNM.pdf |title=Good Times, Brought to you by Brand Modi |first=Ravinder |last=Kaur |year=2015 |access-date=20 February 2018 |archive-date=20 February 2018 |archive-url=https://web.archive.org/web/20180220212720/http://static-curis.ku.dk/portal/files/137464936/Good_Times_Brand_Modi_TVNM.pdf |url-status=live }} | ||
* {{citation|date=December 2004|title=Country Profile: India|edition=5th|work=[[Library of Congress Country Studies]]|publisher=[[Library of Congress]] [[Federal Research Division]]|url=https://lcweb2.loc.gov/frd/cs/profiles/India.pdf|archive-url=https://web.archive.org/web/20110927131058/https://lcweb2.loc.gov/frd/cs/profiles/India.pdf|archive-date=27 September 2011|access-date=30 September 2011|url-status=dead|ref={{sfnRef|Library of Congress|2004}}}} | * {{citation|date=December 2004|title=Country Profile: India|edition=5th|work=[[Library of Congress Country Studies]]|publisher=[[Library of Congress]] [[Federal Research Division]]|url=https://lcweb2.loc.gov/frd/cs/profiles/India.pdf|archive-url=https://web.archive.org/web/20110927131058/https://lcweb2.loc.gov/frd/cs/profiles/India.pdf|archive-date=27 September 2011|access-date=30 September 2011|url-status=dead|ref={{sfnRef|Library of Congress|2004}}}} | ||
| Line 1,783: | Line 1,793: | ||
* {{cite news |title=India says 21 of 29 states to launch new tax |date=25 March 2005 |newspaper=Daily Times |url=http://www.dailytimes.com.pk/default.asp?page=story_25-3-2005_pg5_13 |url-status=dead |archive-url=https://web.archive.org/web/20090116065316/http://www.dailytimes.com.pk/default.asp?page=story_25-3-2005_pg5_13 |archive-date=16 January 2009 }} | * {{cite news |title=India says 21 of 29 states to launch new tax |date=25 March 2005 |newspaper=Daily Times |url=http://www.dailytimes.com.pk/default.asp?page=story_25-3-2005_pg5_13 |url-status=dead |archive-url=https://web.archive.org/web/20090116065316/http://www.dailytimes.com.pk/default.asp?page=story_25-3-2005_pg5_13 |archive-date=16 January 2009 }} | ||
* {{cite news |title=Economic structure |date=6 October 2003 |newspaper=The Economist |url=http://www.economist.com/countries/India/profile.cfm?folder=Profile%2DEconomic%20Structure |url-status=dead |archive-url=https://web.archive.org/web/20080406030423/http://www.economist.com/countries/india/profile.cfm?folder=Profile-Economic%20Structure |archive-date=6 April 2008 }}a | * {{cite news |title=Economic structure |date=6 October 2003 |newspaper=The Economist |url=http://www.economist.com/countries/India/profile.cfm?folder=Profile%2DEconomic%20Structure |url-status=dead |archive-url=https://web.archive.org/web/20080406030423/http://www.economist.com/countries/india/profile.cfm?folder=Profile-Economic%20Structure |archive-date=6 April 2008 }}a | ||
* {{cite web|title=Regional stock exchanges – Bulldozed by the Big Two|url=http://www.thehindubusinessline.com/businessline/2001/07/20/stories/0420.62 billion.htm|access-date=10 August 2005}} {{dead link|date=September 2017 |bot=InternetArchiveBot |fix-attempted=yes }} | * {{cite web|title=Regional stock exchanges – Bulldozed by the Big Two|url=http://www.thehindubusinessline.com/businessline/2001/07/20/stories/0420.62 billion.htm|access-date=10 August 2005}}{{dead link|date=September 2017 |bot=InternetArchiveBot |fix-attempted=yes }} | ||
* {{cite news|url=http://news.indiamart.com/story/finmin-considers-three-single-brand-retail-fdi-proposals-169557.html|title=FinMin considers three single-brand retail FDI proposals|url-status=dead|archive-url=https://web.archive.org/web/20121021202322/http://news.indiamart.com/story/finmin-considers-three-single-brand-retail-fdi-proposals-169557.html|archive-date=21 October 2012}} | * {{cite news|url=http://news.indiamart.com/story/finmin-considers-three-single-brand-retail-fdi-proposals-169557.html|title=FinMin considers three single-brand retail FDI proposals|url-status=dead|archive-url=https://web.archive.org/web/20121021202322/http://news.indiamart.com/story/finmin-considers-three-single-brand-retail-fdi-proposals-169557.html|archive-date=21 October 2012}} | ||
{{Refend}} | {{Refend}} | ||
== External links == | == External links == | ||
<!-- {{No more links}} | |||
Please be cautious adding more external links. | |||
Bharatpedia is not a collection of links and should not be used for advertising. | |||
Excessive or inappropriate links will be removed. | |||
See [[Bharatpedia:External links]] and [[Bharatpedia:Spam]] for details. | |||
If there are already suitable links, propose additions or replacements on | |||
the article's talk page, or submit your link to the relevant category at | |||
the Open Directory Project (dmoz.org) and link there using {{Dmoz}}. | |||
--> | |||
* [http://finmin.nic.in/ Ministry of Finance] | * [http://finmin.nic.in/ Ministry of Finance] | ||
* [https://commerce.gov.in/ Ministry of Commerce and Industry] | * [https://commerce.gov.in/ Ministry of Commerce and Industry] | ||
| Line 1,804: | Line 1,829: | ||
{{World Trade Organization}} | {{World Trade Organization}} | ||
}} | }} | ||
{{Portal bar|India|Economics|Business and economics}} | |||
{{Authority control}} | |||
[[Category:Economy of India| ]] | [[Category:Economy of India| ]] | ||
[[Category:World Trade Organization member economies|India]] | [[Category:World Trade Organization member economies|India]] | ||
[[Category:Economy of Asia-related lists]] | [[Category:Economy of Asia-related lists]] | ||
Revision as of 18:04, 19 November 2023
| Economy | |
| Currency | Indian rupee (INR, ₹) |
|---|---|
| 1 April – 31 March | |
Trade organisations | WTO, WCO, SAFTA, BIMSTEC, WFTU, BRICS, G-20, BIS, AIIB, ADB and others |
Country group | |
| Statistics | |
| Population |  1,417,173,173 (2nd; 2022 est.)[5][6] 1,417,173,173 (2nd; 2022 est.)[5][6] |
| GDP | |
| GDP rank | |
GDP growth | |
GDP per capita | |
GDP per capita rank | |
GDP by sector |
|
GDP by component |
|
| |
 4.50% (18 August 2023)[12] 4.50% (18 August 2023)[12] | |
Population below poverty line | |
| |
Labour force | |
Labour force by occupation | |
| Unemployment | |
Main industries | |
| External | |
| Exports | $770.18 billion (FY2022-23)[27] |
Export goods |
|
Main export partners |
|
| Imports | $892.18 billion (FY2022-23)[27] |
Import goods |
|
Main import partners |
|
FDI stock | |
Gross external debt |
( |
 –$379.7 billion (June 2023)[35] –$379.7 billion (June 2023)[35] | |
| Public finances | |
| 6.4% of GDP (2022–23)[36] | |
| Revenues | |
| Expenses | |
| Economic aid |
|
Foreign reserves | $590.781 billion[lower-alpha 2][41] (4th) (as of 3 November 2023) |
All values, unless otherwise stated, are in US dollars. | |


The economy of India has transitioned from a mixed planned economy to a mixed middle-income developing social market economy with notable public sector in strategic sectors.[42] It is the world's fifth-largest economy by nominal GDP and the third-largest by purchasing power parity (PPP). According to the International Monetary Fund (IMF), on a per capita income basis, India ranked 139th by GDP (nominal) and 127th by GDP (PPP).[43] From independence in 1947 until 1991, successive governments followed Soviet model and promoted protectionist economic policies, with extensive Sovietization, state intervention, demand-side economics, natural resources, bureaucrat driven enterprises and economic regulation. This is characterised as dirigism, in the form of the Licence Raj.[44][45] The end of the Cold War and an acute balance of payments crisis in 1991 led to the adoption of a broad economic liberalisation in India and indicative planning.[46][47] Since the start of the 21st century, annual average GDP growth has been 6% to 7%.[42] The economy of the Indian subcontinent was the largest in the world for most of recorded history up until the onset of colonialism in early 19th century.[48][49][50] India accounts for 7.2% of the global economy in 2022 in PPP terms, and around 3.4% in nominal terms in 2022.[51][52]
India still has informal domestic economies; COVID-19 reversed both economic growth and poverty reduction; credit access weaknesses contributed to lower private consumption and inflation; and new social and infrastructure equity efforts.[53] Economic growth slowed down in 2017 due to the shocks of "demonetisation" in 2016 and the introduction of the Goods and Services Tax in 2017.[54] Nearly 70% of India's GDP is driven by domestic consumption.[55] The country remains the world's sixth-largest consumer market.[56] Apart from private consumption, India's GDP is also fueled by government spending, investments, and exports.[57] In 2022, India was the world's 6th-largest importer and the 9th-largest exporter.[58] India has been a member of the World Trade Organization since 1 January 1995.[59] It ranks 63rd on the Ease of doing business index and 40th on the Global Competitiveness Index.[60] Due to extreme rupee/dollar rate fluctuations India's nominal GDP fluctuates significantly.[61] With 476 million workers, the Indian labour force is the world's second-largest.[19] India has one of the world's highest number of billionaires and extreme income inequality.[62][63] The number of income tax returns filed has been increasing year on year reaching a record 6,77,00,000 income tax returns for the 2023-24 financial year filed by 31st July 2023; this was a 16.1% increase on the previous year when 5,83,00,000 tax returns were filed by 31 July 2022.[64] Income-Tax Department said that it was a "fair indication of widening of [the] tax base" that 53,67,000 of the tax returns were by people who had never filed a tax return before.[64]
During the 2008 global financial crisis, the economy faced a mild slowdown. India endorsed Keynesian policy and initiated stimulus measures (both fiscal and monetary) to boost growth and generate demand. In subsequent years, economic growth revived.[65] According to the World Bank, to achieve sustainable economic development, India must focus on public sector reform, infrastructure, agricultural and rural development, removal of land and labour regulations, financial inclusion, spur private investment and exports, education, and public health.[66] The period between 2004 and 2014 is referred to as India’s lost decade as India fell behind other BRIC economies.[67][68]
In 2022, India's ten largest trading partners were the United States, China, United Arab Emirates (UAE), Saudi Arabia, Russia, Germany, Hong Kong, Indonesia, South Korea, and Malaysia.[69] In 2021–22, the foreign direct investment (FDI) in India was $82 billion. The leading sectors for FDI inflows were the service sector, the computer industry, and the telecom industry.[70] India has free trade agreements with several nations and blocs, including ASEAN, SAFTA, Mercosur, South Korea, Japan, Australia, UAE, and several others which are in effect or under negotiating stage.[71][72]
The service sector makes up more than 50% of GDP and remains the fastest growing sector, while the industrial sector and the agricultural sector employs a majority of the labor force.[73] The Bombay Stock Exchange and National Stock Exchange are some of the world's largest stock exchanges by market capitalisation.[74] India is the world's sixth-largest manufacturer, representing 2.6% of global manufacturing output.[75] Nearly 65% of India's population is rural,[76] and contributes about 50% of India's GDP.[77] It has the world's fifth-largest foreign-exchange reserves worth $561 billion.[78] India has a high public debt with 83% of GDP, while its fiscal deficit stood at 6.4% of GDP.[79] India faces high unemployment, rising income inequality, and a drop in aggregate demand.[80][81] India's gross domestic savings rate stood at 29.3% of GDP in 2022.[82] In recent years, independent economists and financial institutions have accused the government of manipulating various economic data, especially GDP growth.[83][84] India's overall social spending as a share of GDP in 2021–22 will be 8.6%, which is much lower than the average for OECD nations.[85][86]
History


For a continuous duration of nearly 1700 years from the year 1 CE, India was the world's largest economy, constituting 35 to 40% of the world GDP.[89] The combination of protectionist, import-substitution, Fabian socialism, and social democratic-inspired policies governed India for sometime after the end of British rule. The economy was then characterised as Dirigism,[44][45] It had extensive regulation, protectionism, public ownership of large monopolies, pervasive corruption and slow growth.[46][47][90] Since 1991, continuing economic liberalisation has moved the country towards a market-based economy.[46][47] By 2008, India had established itself as one of the world's faster-growing economies.
Ancient and medieval eras
Indus Valley Civilisation
The citizens of the Indus Valley civilisation, a permanent settlement that flourished between 2800 BCE and 1800 BCE, practised agriculture, domesticated animals, used uniform weights and measures, made tools and weapons, and traded with other cities. Evidence of well-planned streets, a drainage system, and water supply reveals their knowledge of urban planning, which included the first-known urban sanitation systems and the existence of a form of municipal government.[91]
West Coast
Maritime trade was carried out extensively between South India and Southeast and West Asia from early times until around the fourteenth century CE. Both the Malabar and Coromandel Coasts were the sites of important trading centres from as early as the first century BCE, used for import and export as well as transit points between the Mediterranean region and southeast Asia.[92] Over time, traders organised themselves into associations which received state patronage. Historians Tapan Raychaudhuri and Irfan Habib claim this state patronage for overseas trade came to an end by the thirteenth century CE, when it was largely taken over by the local Parsi, Jewish, Syrian Christian, and Muslim communities, initially on the Malabar and subsequently on the Coromandel coast.[93]
Silk Route
Other scholars suggest trading from India to West Asia and Eastern Europe was active between the 14th and 18th centuries.[94][95][96] During this period, Indian traders settled in Surakhani, a suburb of greater Baku, Azerbaijan. These traders built a Hindu temple, which suggests commerce was active and prosperous for Indians by the 17th century.[97][98][99][100]
Further north, the Saurashtra and Bengal coasts played an important role in maritime trade, and the Gangetic plains and the Indus valley housed several centres of river-borne commerce. Most overland trade was carried out via the Khyber Pass connecting the Punjab region with Afghanistan and onward to the Middle East and Central Asia.[101] Although many kingdoms and rulers issued coins, barter was prevalent. Villages paid a portion of their agricultural produce as revenue to the rulers, while their craftsmen received a part of the crops at harvest time for their services.[102]


Mughal, Rajput, and Maratha eras (1526–1820)
The Indian economy was the largest and most prosperous throughout world history and would continue to be under the Mughal Empire, up until the 18th century.[103] Sean Harkin estimates that China and India may have accounted for 60 to 70 percent of world GDP in the 17th century. The Mughal economy functioned on an elaborate system of coined currency, land revenue and trade. Gold, silver and copper coins were issued by the royal mints which functioned on the basis of free coinage.[104] The political stability and uniform revenue policy resulting from a centralized administration under the Mughals, coupled with a well-developed internal trade network, ensured that India–before the arrival of the British–was to a large extent economically unified, despite having a traditional agrarian economy characterised by a predominance of subsistence agriculture.[105] Agricultural production increased under Mughal agrarian reforms,[103] with Indian agriculture being advanced compared to Europe at the time, such as the widespread use of the seed drill among Indian peasants before its adoption in European agriculture,[106] and possibly higher per-capita agricultural output and standards of consumption then 17 century Europe.[107]

The Mughal Empire had a thriving industrial manufacturing economy, with India producing about 25% of the world's industrial output up until 1750,[108] making it the most important manufacturing center in international trade.[109] Manufactured goods and cash crops from the Mughal Empire were sold throughout the world. Key industries included textiles, shipbuilding, and steel, and processed exports included cotton textiles, yarns, thread, silk, jute products, metalware, and foods such as sugar, oils and butter.[103] Cities and towns boomed under the Mughal Empire, which had a relatively high degree of urbanization for its time, with 15% of its population living in urban centres, higher than the percentage of the urban population in contemporary Europe at the time and higher than that of British India in the 19th century.[110]
In early modern Europe, there was significant demand for products from Mughal India, particularly cotton textiles, as well as goods such as spices, peppers, indigo, silks, and saltpeter (for use in munitions).[103] European fashion, for example, became increasingly dependent on Mughal Indian textiles and silks. From the late 17th century to the early 18th century, Mughal India accounted for 95% of British imports from Asia, and the Bengal Subah province alone accounted for 40% of Dutch imports from Asia.[111] In contrast, there was very little demand for European goods in Mughal India, which was largely self-sufficient.[103] Indian goods, especially those from Bengal, were also exported in large quantities to other Asian markets, such as Indonesia and Japan.[112] At the time, Mughal Bengal was the most important center of cotton textile production.[113]
In the early 18th century the Mughal Empire declined, as it lost western, central and parts of south and north India to the Maratha Empire, which integrated and continued to administer those regions.[114] The decline of the Mughal Empire led to decreased agricultural productivity, which in turn negatively affected the textile industry.[115] The subcontinent's dominant economic power in the post-Mughal era was the Bengal Subah in the east., which continued to maintain thriving textile industries and relatively high real wages.[116] However, the former was devastated by the Maratha invasions of Bengal[117][118] and then British colonization in the mid-18th century.[116] After the loss at the Third Battle of Panipat, the Maratha Empire disintegrated into several confederate states, and the resulting political instability and armed conflict severely affected economic life in several parts of the country – although this was mitigated by localised prosperity in the new provincial kingdoms.[114] By the late eighteenth century, the British East India Company had entered the Indian political theatre and established its dominance over other European powers. This marked a determinative shift in India's trade, and a less-powerful effect on the rest of the economy.[119]
British era (1793–1947)
There is no doubt that our grievances against the British Empire had a sound basis. As the painstaking statistical work of the Cambridge historian Angus Maddison has shown, India's share of world income collapsed from 22.6% in 1700, almost equal to Europe's share of 23.3% at that time, to as low as 3.8% in 1952. Indeed, at the beginning of the 20th century, "the brightest jewel in the British Crown" was the poorest country in the world in terms of per capita income.
From the beginning of the 19th century, the British East India Company's gradual expansion and consolidation of power brought a major change in taxation and agricultural policies, which tended to promote commercialisation of agriculture with a focus on trade, resulting in decreased production of food crops, mass impoverishment and destitution of farmers, and in the short term, led to numerous famines.[121] The economic policies of the British Raj caused a severe decline in the handicrafts and handloom sectors, due to reduced demand and dipping employment.[122] After the removal of international restrictions by the Charter of 1813, Indian trade expanded substantially with steady growth.[123] The result was a significant transfer of capital from India to England, which, due to the colonial policies of the British, led to a massive drain of revenue rather than any systematic effort at modernisation of the domestic economy.[124]
Under British rule, India's share of the world economy declined from 24.4% in 1700 down to 4.2% in 1950. India's GDP (PPP) per capita was stagnant during the Mughal Empire and began to decline prior to the onset of British rule.[49] India's share of global industrial output declined from 25% in 1750 down to 2% in 1900.[108] At the same time, United Kingdom's share of the world economy rose from 2.9% in 1700 up to 9% in 1870. The British East India Company, following their conquest of Bengal in 1757, had forced open the large Indian market to British goods, which could be sold in India without tariffs or duties, compared to local Indian producers who were heavily taxed, while in Britain protectionist policies such as bans and high tariffs were implemented to restrict Indian textiles from being sold there, whereas raw cotton was imported from India without tariffs to British factories which manufactured textiles from Indian cotton and sold them back to the Indian market. British economic policies gave them a monopoly over India's large market and cotton resources.[131][132][133] India served as both a significant supplier of raw goods to British manufacturers and a large captive market for British manufactured goods.[134]
British territorial expansion in India throughout the 19th century created an institutional environment that, on paper, guaranteed property rights among the colonisers, encouraged free trade, and created a single currency with fixed exchange rates, standardised weights and measures and capital markets within the company-held territories. It also established a system of railways and telegraphs, a civil service that aimed to be free from political interference, a common-law, and an adversarial legal system.[135] This coincided with major changes in the world economy – industrialisation, and significant growth in production and trade. However, at the end of colonial rule, India inherited an economy that was one of the poorest in the developing world,[136] with industrial development stalled, agriculture unable to feed a rapidly growing population, a largely illiterate and unskilled labour force, and extremely inadequate infrastructure.[137]
The 1872 census revealed that 91.3% of the population of the region constituting present-day India resided in villages.[138] This was a decline from the earlier Mughal era, when 85% of the population resided in villages and 15% in urban centers under Akbar's reign in 1600.[139] Urbanisation generally remained sluggish in British India until the 1920s, due to the lack of industrialisation and absence of adequate transportation. Subsequently, the policy of discriminating protection (where certain important industries were given financial protection by the state), coupled with the Second World War, saw the development and dispersal of industries, encouraging rural-urban migration, and in particular, the large port cities of Bombay, Calcutta and Madras grew rapidly. Despite this, only one-sixth of India's population lived in cities by 1951.[140]
The effect of British rule on India's economy is a controversial topic. Leaders of the Indian independence movement and economic historians have blamed colonial rule for India's poor economic performance following independence and argued that the wealth required for Britain's industrial development was derived from wealth taken from India. At the same time, right-wing historians have countered that India's poor economic performance was due to various sectors being in a state of growth and decline due to changes brought in by colonialism and a world that was moving towards industrialisation and economic integration.[141]
Several economic historians have argued that real wage decline occurred in the early 19th century, or possibly beginning in the very late 18th century, largely as a result of British imperialism. According to Prasannan Parthasarathi and Sashi Sivramkrishna, the grain wages of Indian weavers were likely comparable to that of their British counterparts and their average income was around five times the subsistence level, which was comparable to advanced parts of Europe.[142][143] However they concluded that due to the scarcity of data, it was hard to draw definitive conclusions and that more research was required.[109][143] It has also been argued that India went through a period of deindustrialization in the latter half of the 18th century as an indirect outcome of the collapse of the Mughal Empire.[108]
Pre-liberalisation period (1947–1991)
Indian economic policy after independence was influenced by the colonial experience, which was seen as exploitative by Indian leaders exposed to the planned economy of the Soviet Union.[137] Domestic policy tended towards protectionism, with a strong emphasis on import substitution industrialisation, economic interventionism, a large government-run public sector, business regulation, and central planning,[144] while trade and foreign investment policies were relatively liberal.[145] Five-Year Plans of India resembled central planning in the Soviet Union. Steel, mining, machine tools, telecommunications, insurance, and power plants, among other industries, were effectively nationalised in the mid-1950s.[146] The Indian economy of this period is characterised as Dirigism.[44][45]
.png)
Never talk to me about profit, Jeh, it is a dirty word.
— Nehru, India's Fabian Socialism-inspired first prime minister to industrialist J. R. D. Tata, when Tata suggested state-owned companies should be profitable[149]
Jawaharlal Nehru, the first prime minister of India, along with the statistician Prasanta Chandra Mahalanobis, formulated and oversaw economic policy during the initial years of the country's independence. They expected favourable outcomes from their strategy, involving the rapid development of heavy industry by both public and private sectors, and based on direct and indirect state intervention, rather than the more extreme Soviet-style central command system.[150][151] The policy of concentrating simultaneously on capital- and technology-intensive heavy industry and subsidising manual, low-skill cottage industries was criticised by economist Milton Friedman, who thought it would waste capital and labour, and retard the development of small manufacturers.[152]
I cannot decide how much to borrow, what shares to issue, at what price, what wages and bonus to pay, and what dividend to give. I even need the government's permission for the salary I pay to a senior executive.
— J. R. D. Tata, on the Indian regulatory system, 1969[149]
Since 1965, the use of high-yielding varieties of seeds, increased fertilisers and improved irrigation facilities collectively contributed to the Green Revolution in India, which improved the condition of agriculture by increasing crop productivity, improving crop patterns and strengthening forward and backward linkages between agriculture and industry.[153] However, it has also been criticised as an unsustainable effort, resulting in the growth of capitalistic farming, ignoring institutional reforms and widening income disparities.[154]
In 1984, Rajiv Gandhi promised economic liberalization, he made V. P. Singh the finance minister, who tried to reduce tax evasion and tax receipts rose due to this crackdown although taxes were lowered. This process lost its momentum during the later tenure of Mr. Gandhi as his government was marred by scandals.
Post-liberalisation period (since 1991)


The collapse of the Soviet Union, which was India's major trading partner, and the Gulf War, which caused a spike in oil prices, resulted in a major balance-of-payments crisis for India, which found itself facing the prospect of defaulting on its loans.[155] India asked for a $1.8 billion bailout loan from the International Monetary Fund (IMF), which in return demanded de-regulation.[156]
In response, the Narasimha Rao government, including Finance Minister Manmohan Singh, initiated economic reforms in 1991. The reforms did away with the Licence Raj, reduced tariffs and interest rates and ended many public monopolies, allowing automatic approval of foreign direct investment in many sectors.[157] Since then, the overall thrust of liberalisation has remained the same, although no government has tried to take on powerful lobbies such as trade unions and farmers, on contentious issues such as reforming labour laws and reducing agricultural subsidies.[158] This has been accompanied by increases in life expectancy, literacy rates, and food security, although urban residents have benefited more than rural residents.[159]


From 2010, India has risen from ninth-largest to the fifth-largest economies in the world by nominal GDP in 2019 by surpassing UK, France, Italy and Brazil.[160]
India started recovery in 2013–14 when the GDP growth rate accelerated to 6.4% from the previous year's 5.5%. The acceleration continued through 2014–15 and 2015–16 with growth rates of 7.5% and 8.0% respectively. For the first time since 1990, India grew faster than China which registered 6.9% growth in 2015.[needs update] However the growth rate subsequently decelerated, to 7.1% and 6.6% in 2016–17 and 2017–18 respectively,[161] partly because of the disruptive effects of 2016 Indian banknote demonetisation and the Goods and Services Tax (India).[162]
India is ranked 63rd out of 190 countries in the World Bank's 2020 ease of doing business index, up 14 points from the last year's 100 and up 37 points in just two years.[163] In terms of dealing with construction permits and enforcing contracts, it is ranked among the 10 worst in the world, while it has a relatively favourable ranking when it comes to protecting minority investors or getting credit.[164] The strong efforts taken by the Department of Industrial Policy and Promotion (DIPP) to boost ease of doing business rankings at the state level is said to affect the overall rankings of India.[165]
COVID-19 pandemic and aftermath (2020–present)
During the COVID-19 pandemic, numerous rating agencies downgraded India's GDP predictions for FY21 to negative figures,[166][167] signalling a recession in India, the most severe since 1979.[168][169] The Indian Economy contracted by 6.6 percent which was lower than the estimated 7.3 percent decline.[170] In 2022, the ratings agency Fitch Ratings upgraded India's outlook to stable similar to S&P Global Ratings and Moody's Investors Service's outlooks.[171] In the first quarter of financial year 2022–2023, the Indian economy grew by 13.5%.[172]
Data
 | This article needs to be updated. (October 2023) |
The following table shows the main economic indicators in 1980–2022 (with IMF staff estimates in 2023–2028). Inflation below 5% is in green.[173] The annual unemployment rate is extracted from the World Bank, although the International Monetary Fund finds them unreliable.[174]
| Year | GDP (in Bil. US$PPP) |
GDP per capita (in US$ PPP) |
GDP (in Bil. US$nominal) |
GDP per capita (in US$ nominal) |
GDP growth (real) |
Inflation rate (in Percent) |
Unemployment (in Percent) |
Government debt (in % of GDP) |
|---|---|---|---|---|---|---|---|---|
| 1980 | 371.9 | 532.0 | 189.4 | 271.0 | 6.74%
|
 11.3% 11.3%
|
n/a | n/a |
| 1981 | 431.5
|
603.2
|
196.5
|
274.7
|
6.01%
|
12.7%
|
n/a | n/a |
| 1982 | 474.1
|
647.5
|
203.5
|
278.0
|
3.5%
|
7.7%
|
n/a | n/a |
| 1983 | 528.6
|
705.3
|
222.0
|
296.3
|
7.3%
|
12.6%
|
n/a | n/a |
| 1984 | 568.6
|
741.4
|
 215.6 215.6
|
281.1
|
3.8%
|
5.2%
|
n/a | n/a |
| 1985 | 617.4
|
787.1
|
237.6
|
302.9
|
5.3%
|
5.56%[175]
|
n/a | n/a |
| 1986 | 659.9
|
822.8
|
252.8
|
315.2
|
4.8%
|
7.8%[176]
|
n/a | n/a |
| 1987 | 703.0
|
857.7
|
283.8
|
346.2
|
4.0%
|
9.1%
|
n/a | n/a |
| 1988 | 797.9
|
952.7
|
299.6
|
357.8
|
9.6%
|
7.2%
|
n/a | n/a |
| 1989 | 878.5
|
1,027.0
|
301.2
|
352.2
|
5.9%
|
4.6%
|
n/a | n/a |
| 1990 | 961.8
|
1,101.3
|
326.6
|
374.0
|
5.5%
|
11.2%
|
n/a | n/a |
| 1991 | 1,004.8
|
1,127.4
|
274.8
|
308.4
|
1.1%
|
13.5%
|
5.6% | 75.3% |
| 1992 | 1,084.1
|
1,192.2
|
293.3
|
322.5
|
5.5%
|
9.9%
|
5.7%
|
77.4%
|
| 1993 | 1,162.5
|
1,253.5
|
284.2
|
306.4
|
4.8%
|
7.3%
|
 5.7% 5.7%
|
77.0%
|
| 1994 | 1,266.4
|
1,339.2
|
333.0
|
352.2
|
6.7%
|
10.3%
|
5.7%
|
73.5%
|
| 1995 | 1,390.8
|
1,442.9
|
366.6
|
380.3
|
7.6%
|
10.0%
|
5.8%
|
69.7%
|
| 1996 | 1,523.2
|
1,550.6
|
399.8
|
407.0
|
7.6%
|
9.4%
|
5.7%
|
66.0%
|
| 1997 | 1,612.3
|
1,610.8
|
423.2
|
422.8
|
4.1%
|
6.8%
|
5.6%
|
67.8%
|
| 1998 | 1,731.2
|
1,698.1
|
428.8
|
420.6
|
6.2%
|
13.1%
|
5.7%
|
68.1%
|
| 1999 | 1,904.2
|
1,834.4
|
466.9
|
449.8
|
8.5%
|
5.7%
|
5.7%
|
70.0%
|
| 2000 | 2,024.7
|
1,916.3
|
476.6
|
451.1
|
4.0%
|
3.8%
|
5.6%
|
73.6%
|
| 2001 | 2,172.7
|
2,021.1
|
494.0
|
459.5
|
4.9%
|
4.3%
|
5.6%
|
78.7%
|
| 2002 | 2,292.8
|
2,097.1
|
524.0
|
479.2
|
3.9%
|
4.0%
|
5.5%
|
82.9%
|
| 2003 | 2,523.8
|
2,270.6
|
618.4
|
556.3
|
7.9%
|
3.9%
|
5.6%
|
84.4%
|
| 2004 | 2,795.0
|
2,474.2
|
721.6
|
638.8
|
7.8%
|
3.8%
|
5.6%
|
83.4%
|
| 2005 | 3,150.3
|
2,745.1
|
834.2
|
726.9
|
9.3%
|
4.4%
|
5.6%
|
81.0%
|
| 2006 | 3,548.3
|
3,044.5
|
949.1
|
814.4
|
9.3%
|
6.7%
|
5.6%
|
77.2%
|
| 2007 | 4,001.4
|
3,381.8
|
1,238.7
|
1,046.9
|
9.8%
|
6.2%
|
5.6%
|
74.1%
|
| 2008 | 4,236.8
|
3,528.7
|
1,224.1
|
1,019.5
|
3.9%
|
9.1%
|
5.4%
|
72.8%
|
| 2009 | 4,625.5
|
3,798.5
|
1,365.4
|
1,121.2
|
8.5%
|
12.3%
|
5.5%
|
71.5%
|
| 2010 | 5,161.4
|
4,181.7
|
1,708.5
|
1,384.2
|
10.3%
|
10.5%
|
5.5%
|
66.4%
|
| 2011 | 5,618.4
|
4,493.7
|
1,823.1
|
1,458.1
|
6.6%
|
9.5%
|
5.4%
|
68.6%
|
| 2012 | 6,153.2
|
4,861.2
|
1,827.6
|
1,443.9
|
5.5%
|
10.0%
|
5.4%
|
68.0%
|
| 2013 | 6,477.5
|
5,057.2
|
1,856.7
|
1,449.6
|
6.4%
|
9.4%
|
5.4%
|
67.7%
|
| 2014 | 6,781.0
|
5,233.9
|
2,039.1
|
1,573.9
|
7.4%
|
5.8%
|
5.4%
|
67.1%
|
| 2015 | 7,159.8
|
5,464.9
|
2,103.6
|
1,605.6
|
8.0%
|
4.9%
|
5.4%
|
69.0%
|
| 2016 | 7,735.0
|
5,839.9
|
2,294.8
|
1,732.6
|
8.3%
|
4.5%
|
5.4%
|
68.9%
|
| 2017 | 8,276.9
|
6,112.1
|
2,702.9
|
1,958.0
|
6.8%
|
3.6%
|
5.4%
|
69.7%
|
| 2018 | 9,023.0
|
6,590.9
|
2,702.9
|
1,974.4
|
6.5%
|
3.4%
|
5.3%
|
70.4%
|
| 2019 | 9,540.4
|
6,897.8
|
2,835.6
|
2,050.2
|
4.2%
|
4.8%
|
5.3%
|
75.0%
|
| 2020 | 9,101.3
|
6,517.8
|
2,671.6
|
1,913.2
|
-5.8%
|
6.1%
|
8.0%
|
88.5%
|
| 2021 | 10,370.8
|
7,355.4
|
3,150.3
|
2,234.3
|
9.1%
|
5.5%
|
6.0%
|
84.7%
|
| 2022 | 11,855.4
|
8,329.3
|
3,386.4
|
2,379.2
|
7.2%
|
6.7%
|
n/a | 83.1%
|
| 2023 | 13,033.4
|
9,073.0
|
3,736.9
|
2,601.4
|
6.5%
|
4.9%
|
n/a | 83.2%
|
| 2024 | 14,165.5
|
9,773.0
|
4,062.2
|
2,802.5
|
6.3%
|
4.4%
|
n/a | 83.7%
|
| 2025 | 15,330.6
|
10,484.8
|
4,547.2
|
3,146.8
|
6.9%
|
4.1%
|
n/a | 83.8%
|
| 2026 | 16,563.8
|
11,232.6
|
4,765.5
|
3,231.7
|
6.1%
|
4.1%
|
n/a | 83.8%
|
| 2027 | 17,877.0
|
12,024.0
|
5,153.0
|
3,465.9
|
6.0%
|
4.0%
|
n/a | 83.7%
|
Sectors
| This article needs to be updated. (August 2022) |
- Agriculture (16.4%)
- Industry (29.4%)
- Service (54.3%)
Historically, India has classified and tracked its economy and GDP in three sectors: agriculture, industry, and services. Agriculture includes crops, horticulture, milk and animal husbandry, aquaculture, fishing, sericulture, aviculture, forestry, and related activities. Industry includes various manufacturing sub-sectors. India's definition of services sector includes its construction, retail, software, IT, communications, hospitality, infrastructure operations, education, healthcare, banking and insurance, and many other economic activities.[177][178]
Agriculture
| This article needs to be updated. (June 2023) |
Agriculture and allied sectors like forestry, logging and fishing accounted for 17% of the GDP, the sector employed 49% of its total workforce in 2014.[179] Agriculture accounted for 23% of GDP, and employed 59% of the country's total workforce in 2016.[180] India ranks second globally in food and agricultural production, while agricultural exports were $35.09 billion.[77][181] As the Indian economy has diversified and grown, agriculture's contribution to GDP has steadily declined from 1951 to 2011, yet it is still the country's largest employment source and a significant piece of its overall socio-economic development.[182] Crop-yield-per-unit-area of all crops has grown since 1950, due to the special emphasis placed on agriculture in the five-year plans and steady improvements in irrigation, technology, application of modern agricultural practices and provision of agricultural credit and subsidies since the Green Revolution in India. However, international comparisons reveal the average yield in India is generally 30% to 50% of the highest average yield in the world.[183] The states of Uttar Pradesh, Punjab, Haryana, Madhya Pradesh, Andhra Pradesh, Telangana, Bihar, West Bengal, Gujarat and Maharashtra are key contributors to Indian agriculture.


India receives an average annual rainfall of 1,208 millimetres (47.6 in) and a total annual precipitation of 4,000 billion cubic metres, with the total utilisable water resources, including surface and groundwater, amounting to 1,123 billion cubic metres.[185] 546,820 square kilometres (211,130 sq mi) of the land area, or about 39% of the total cultivated area, is irrigated.[186] India's inland water resources and marine resources provide employment to nearly 6 million people in the fisheries sector. In 2010, India had the world's sixth-largest fishing industry.[187]

India is the largest producer of milk, jute and pulses, and has the world's second-largest cattle population with 170 million animals in 2011.[189] It is the second-largest producer of rice, wheat, sugarcane, cotton and groundnuts, as well as the second-largest fruit and vegetable producer, accounting for 10.9% and 8.6% of the world fruit and vegetable production, respectively. India is also the second-largest producer and the largest consumer of silk, producing 77,000 tonnes (76,000 long tons; 85,000 short tons) in 2005.[190] India is the largest exporter of cashew kernels and cashew nut shell liquid (CNSL). Foreign exchange earned by the country through the export of cashew kernels during 2011–12 reached ₹43.9 billion (equivalent to ₹67 billion or US$930 million in 2019) based on statistics from the Cashew Export Promotion Council of India (CEPCI). 131,000 tonnes (129,000 long tons; 144,000 short tons) of kernels were exported during 2011–12.[191] There are about 600 cashew processing units in Kollam, Kerala.[188]


India's foodgrain production remained stagnant at approximately 252 megatonnes (248 million long tons; 278 million short tons) during both the 2015–16 and 2014–15 crop years (July–June).[192] India exports several agriculture products, such as Basmati rice, wheat, cereals, spices, fresh fruits, dry fruits, buffalo beef meat, cotton, tea, coffee and other cash crops particularly to the Middle East, Southeast and East Asian countries. About 10 percent of its export earnings come from this trade.[193]

At around 1,530,000 square kilometres (590,000 sq mi), India has the second-largest amount of arable land, after US, with 52% of total land under cultivation. Although the total land area of the country is only slightly more than one-third of China or US, India's arable land is marginally smaller than that of US, and marginally larger than that of China. However, agricultural output lags far behind its potential.[194] The low productivity in India is a result of several factors.Over-regulation of agriculture has increased costs, price risks and uncertainty, and governmental intervention in labour, land, and credit are hurting the market. Infrastructure such as rural roads, electricity, ports, food storage, retail markets and services remain inadequate.[195] The average size of land holdings is very small, with 70% of holdings being less than 1 hectare (2.5 acres)* in size.[196] Irrigation facilities are inadequate, as revealed by the fact that only 46% of the total cultivable land was irrigated as of 2016,[update][186] resulting in farmers still being dependent on rainfall, specifically the monsoon season, which is often inconsistent and unevenly distributed across the country.[197] In an effort to bring an additional 20,000,000 hectares (49,000,000 acres) of land under irrigation, various schemes have been attempted, including the Accelerated Irrigation Benefit Programme (AIBP) which was provided ₹800 billion (equivalent to ₹930 billion or US$13 billion in 2019) in the Union Budget.[198] Farming incomes are also hampered by lack of food storage and distribution infrastructure; a third of India's agricultural production is lost from spoilage.[199]
Manufacturing and industry
| This article needs to be updated. (June 2023) |
Industry accounts for 26% of GDP and employs 22% of the total workforce, and Mumbai is generally considered the industrial capital.[200] According to the World Bank, India's industrial manufacturing GDP output in 2015 was 6th largest in the world on current US dollar basis ($559 billion),[201] and 9th largest on inflation-adjusted constant 2005 US dollar basis ($197.1 billion).[202] The industrial sector underwent significant changes due to the 1991 economic reforms, which removed import restrictions, brought in foreign competition, led to the privatisation of certain government-owned public-sector industries, liberalised the foreign direct investment (FDI) regime,[203] improved infrastructure and led to an expansion in the production of fast-moving consumer goods.[204] Post-liberalisation, the Indian private sector was faced with increasing domestic and foreign competition, including the threat of cheaper Chinese imports. It has since handled the change by squeezing costs, revamping management, and relying on cheap labour and new technology. However, this has also reduced employment generation, even among smaller manufacturers who previously relied on labour-intensive processes.[205] Manufacturing and tech industries are geographically located in industrial regions in India,[206] It is also the world's second-largest coal producer, the second-largest agrochemical producer, the second-largest cement producer, the second-largest steel producer, and the third-largest electricity producer.[207][208]
Agrochemicals and Fertilizers

At present, 57 large fertilizer units are manufacturing a wide number of nitrogen fertilizers. These include 29 urea-producing units and 9 ammonia sulfate-producing units as a by-product. Besides, there are 64 small-scale producing units of single super phosphate.[209]
According to the latest data released by the WTO, India has emerged as the second largest exporter of agrochemicals in the world. The rank was sixth, 10 years ago.The Indian agrochemical industry fetches valuable trade surplus every year. The trade surplus sharply increased from Rs. 8,030 crores in 2017–18 to Rs. 28,908 crores in the last fiscal. India's agrochemicals export has doubled in the last 6 years from $2.6 bn in 2017–18 to $5.4 bn in the last financial year according to the data recently released by Ministry of Commerce. It has grown at an impressive CAGR of 13% which is among the highest in the manufacturing sector.[210]
Millions of farmers in over 130 countries trust Indian agrochemicals for their high quality and affordable prices, said an industry observer. With the global agrochemicals market estimated at $78 billion, predominantly comprising post-patent products, India is rapidly becoming a preferred global hub for sourcing such agrochemicals. To bolster domestic production and reduce imports, the Crop Care Federation of India (CCFI) has recommended specific measures to the Government of India.[211]
Defence sector

With strength of over 1.3 million active personnel, Indian Army is the third-largest military force and the largest volunteer army. Defence expenditure was pegged at US$70.12 billion for fiscal year 2022–23 and, increased 9.8% than previous fiscal year.[212] India is the world's second largest arms importer; between 2016 and 2020, it accounted for 9.5% of the total global arms imports.[213] India exported military hardware worth ₹159.2 billion (US$2.2 billion) in the financial year 2022–23, the highest ever and a notable tenfold increase since 2016–17.[214]
Energy sector


Primary energy consumption of India is the third-largest after China and US with 5.3% global share in the year 2015.[215] Coal and crude oil together account for 85% of the primary energy consumption of India. India's oil reserves meet 25% of the country's domestic oil demand.[216][217] As of April 2015,[update] India's total proven crude oil reserves are 763.476 megatonnes (751.418 million long tons; 841.588 million short tons), while gas reserves stood at 1,490 billion cubic metres (53 trillion cubic feet).[218] Oil and natural gas fields are located offshore at Ashoknagar Oil Field, Bombay High, Krishna Godavari Basin, Mangala Area and the Cauvery Delta, and onshore mainly in the states of West Bengal, Assam, Gujarat and Rajasthan. India is the fourth-largest consumer of oil and net oil imports were nearly ₹8.2 trillion (US$110 billion) in 2014–15,[218] which had an adverse effect on the country's current account deficit. The petroleum industry in India mostly consists of public sector companies such as Oil and Natural Gas Corporation (ONGC), Hindustan Petroleum Corporation Limited (HPCL), Bharat Petroleum Corporation Limited (BPCL) and Indian Oil Corporation Limited (IOCL). There are some major private Indian companies in the oil sector such as Reliance Industries Limited (RIL) which operates the world's largest oil refining complex.[219]
India became the world's third-largest producer of electricity in 2013 with a 4.8% global share in electricity generation, surpassing Japan and Russia.[220] By the end of calendar year 2015, India had an electricity surplus with many power stations idling for want of demand.[221] The utility electricity sector had an installed capacity of 303 GW as of May 2016[update] of which thermal power contributed 69.8%, hydroelectricity 15.2%, other sources of renewable energy 13.0%, and nuclear power 2.1%.[222] India meets most of its domestic electricity demand through its 106 gigatonnes (104 billion long tons; 117 billion short tons) of proven coal reserves.[223] India is also rich in certain alternative sources of energy with significant future potential such as solar, wind and biofuels (jatropha, sugarcane). India's dwindling uranium reserves stagnated the growth of nuclear energy in the country for many years.[224] Recent discoveries in the Tummalapalle belt may be among the top 20 natural uranium reserves worldwide,[225][226][227][needs update] and an estimated reserve of 846,477 tonnes (833,108 long tons; 933,081 short tons) of thorium[228] – about 25% of world's reserves – are expected to fuel the country's ambitious nuclear energy program in the long-run. The Indo-US nuclear deal has also paved the way for India to import uranium from other countries.[229]
Transport sector


The Indian Railways contributes to ~3% of the country's gross domestic product (GDP) and has social obligations pegged at $5.3 Billion annually. Indian Railways revenue has grown at 5% CAGR in the past 5 years but profitability has reduced drastically in the past 4 years, due to growing infrastructure and modernization expenses. With a workforce of 1.31 million people, the IR is also one of the country's largest employers. The railways is a major contributor to jobs, GDP, and mobility.
Indian Railways has decided to revise its 2022–23 rolling stock production plan upwards. The Ministry's new plan targets the production of 8,429 units for the coming financial year. Production for 2022–23 has been raised by 878 units from the earlier planned 7,551, according to the revised targets.[230] Indian Railways has targeted to manufacture 475 new Vande Bharat trainsets for the next four years as a part of its modernization plan.[231] It is about Rs 40,000 crore(5 billion $) business opportunity that would also create 15,000 jobs and several spin -off benefits.[232] Indian Railway's CORE aims to electrify all of its broad gauge network by 31 March 2024.[233] The entire electrified mainline rail network in India uses 25 kV AC; DC is used only for metros.As of July 2023, India currently has 90% of total train tracks fully electrified.[234]
Under the eleventh Five Year Plan of India (2007–12), the Ministry of Railways started constructing a new Dedicated Freight Corridor (DFC) in two long routes, namely the Eastern and Western freight corridors.[235] The two routes cover a total length of 3,260 kilometres (2,030 mi), with the Eastern Dedicated Freight Corridor stretching from Ludhiana in Punjab to Dankuni in West Bengal and the Western Dedicated Freight Corridor from Jawaharlal Nehru Port in Mumbai (Maharashtra) to Dadri in Uttar Pradesh.[236] The DFC will generate around 42,000 jobs and provide long term employment to many people in public sector and private sector.
India is developing modern mass rapid transit systems to meet present and future urban requirements. A modern metro rail system is already in place in the cities of Delhi, Mumbai, Bangalore, Kolkata, Hyderabad, Kochi, Gurgaon, Jaipur, Noida, Pune, Nagpur, Kanpur, Ahmedabad and Lucknow. Similar mass transit systems are intended for Agra, Bhopal, Indore, Surat, Patna, Bhubaneswar Tri-city , Chandigarh Tri-city, Gwalior, Mysore, Nashik, Prayagraj, Varanasi, Ranchi, Thane, Trivandrum and Navi Mumbai. Former Prime Minister Atal Bihari Vajpayee has been credited with success of the metro systems in India and every metro has followed Delhi Metro model generating lot of real estate wealth in India specially in smaller cities like Gurgaon and Noida. For Elevated corridor, there is no need for land acquisition as pillars are built above Median strip of a road.[237] Land prices in tier-II cities such as Lucknow, Patna, Jaipur, Ahmedabad, Pune, Kochi, and Coimbatore have gone up by almost 8-10 percent following the introduction of a metro corridor in these cities, an assessment by JLL has said.[238]
India is also developing modern RRTS system to replace the old MRTS system which will provide connectivity in Delhi Metropolitan Area and Mumbai Metropolitan Region which will serve the suburbs of these big cities at 80–100 km of distance from city center.

Engineering
_front_view.png)

Engineering is the largest sub-sector of India's industrial sector, by GDP, and the third-largest by exports.[239] It includes transport equipment, machine tools, capital goods, transformers, switchgear, furnaces, and cast and forged parts for turbines, automobiles, and railways. The industry employs about 4 million workers. On a value-added basis, India's engineering subsector exported $67 billion worth of engineering goods in the 2013–14 fiscal year, and served part of the domestic demand for engineering goods.[240] As of 2023, India is the 3rd largest automotive market in the world in terms of sales.[241] The Indian automobile industry is the world's fourth-largest by production.[242][243]

The engineering industry of India includes its growing car, trainsets, rail wagons, motorcycle and scooters industry, and productivity machinery such as steel equipment, nuclear equipment, shovel, dump trucks, tractors. India manufactured and assembled about 18 million passenger and utility vehicles in 2011, of which 2.3 million were exported.[244] Indian Railways has made a new record of manufacturing 10,000 coaches for both domestic and export purposes.[245] India is the largest producer and the largest market for tractors, accounting for 29% of global tractor production in 2013.[244][246] India is the 12th-largest producer and 7th-largest consumer of machine tools.[244]
The rolling stock market in India will be worth 4 billion $ approx. in 2023 will reach 5 billion $ in 2025.The automotive manufacturing industry contributed $79 billion (4% of GDP) and employed 6.76 million people (2% of the workforce) in 2016.[180]
Iron and steel


India surpassed Japan as the second largest steel producer in January 2019.[247] As per worldsteel, India's crude steel production in 2018 was at 106.5 tonnes (104.8 long tons; 117.4 short tons), 4.9% increase from 101.5 tonnes (99.9 long tons; 111.9 short tons) in 2017, which means that India overtook Japan as the world's second largest steel production country.
According to data presented by PIB(FY2021-22), there are more than 900 steel plants in India that produce crude steel. These are owned by PSUs, large-scale companies as well as small and medium enterprises (SMEs). In the year 2021-22, the total capacity of these plants stood at 154.06 million tonnes.[248]
India plans to build 12 new steel plants with a capacity of 60 megatonnes (59 million long tons; 66 million short tons) per year. Indian Ministry of Steel instructed public sector integrated steel plants to increase capacity by at least 80%, to 45 megatonnes (44 million long tons; 50 million short tons) per year by 2030. The current capacity is 25 megatonnes (25 million long tons; 28 million short tons) per year.[249]
Steel products produced by large and well established companies such as JSW Group, Jindal Steel and Power, Tata Steel, RINL and SAIL have extremely diversified steel product lines such as TMT Bars, steel pipes, railway tracks, rail wheels etc.
The total market value of the Indian steel sector stood at US$57.8 billion in 2011 and is predicted to touch US$95.3 billion by 2016.Growth of crude steel production in India has not kept pace with the growth in capacity of production, according to the report. As per this report, steel sector contributes 2 per cent to India's GDP and employs half a million people directly and 2 million people indirectly. The Indian steel sector has been vibrant, growing at a compounded rate of 6% year-on-year.[250]
Business-to-Business commerce
Business-to-Business (B2B) marketplaces are likely to hit gross merchandise value (GMV) of $125 billion in the next five years, growing at a compound annual growth rate (CAGR) of 45%, according to a report by Avendus Capital. [251]
India's B2B e-commerce startups sees 3-6x growth, India's B2B (business-to-business) market is twice the size of B2C (business-to-consumer) and contributes roughly two-thirds to India $3 trillion economy.India has seen the rise of several B2B unicorns too and, they are going after what's potentially a $2 trillion opportunity.These companies are fuelling the engines of Indian economy — the micro-, small- and medium-sized enterprises (MSMEs). The addressable market is big with over 65 million MSMEs all ready to go digital, but only about six to 10 million of them actively buy and sell online.[252]
As per Airtel, 5G will make more B2B Revenues than B2C.[253]
Government e Marketplace is an online platform for public procurement within Government departments/organizations in India under Government of India also knows as G2G commerce, The initiative was launched on August 9, 2016, by the Ministry of Commerce and Industry. GeM's B2B procurement crosses Rs 2 lakh-crore mark($30.76 Billion).The business through GeM has grown from around Rs 35,000 crore two years ago and tripled last year to Rs 1 lakh 6 thousand crores.[254]
Gems and jewellery

India is one of the largest centres for polishing diamonds and gems and manufacturing jewellery; it is also one of the two largest consumers of gold.[255][256] After crude oil and petroleum products, the export and import of gold, precious metals, precious stones, gems and jewellery accounts for the largest portion of India's global trade. The industry contributes about 7% of India's GDP, employs hundreds of thousands, and is a major source of its foreign-exchange earnings.[257] The gems and jewellery industry created $80.84 billion in economic output on value-added basis in 2023.[258]
The gems and jewellery industry has been economically active in India for several thousand years.[259] Until the 18th century, India was the only major reliable source of diamonds.[255] Now, South Africa and Australia are the major sources of diamonds and precious metals, but along with Antwerp, New York City, and Ramat Gan, Indian cities such as Surat and Mumbai are the hubs of world's jewellery polishing, cutting, precision finishing, supply and trade. Unlike other centres, the gems and jewellery industry in India is primarily artisan-driven; the sector is manual, highly fragmented, and almost entirely served by family-owned operations.
The particular strength of this sub-sector is in precision cutting, polishing and processing small diamonds (below one carat).[255] India is also a hub for processing of larger diamonds, pearls, and other precious stones. Statistically, 11 out of 12 diamonds set in any jewellery in the world are cut and polished in India.[260]
Infrastructure
| This article needs to be updated. (June 2023) |

India's infrastructure and transport sector contributes about 5% of its GDP. India has a road network of over 5,472,144 kilometres (3,400,233 mi) as of 31 March 2015,[update] the second-largest road network in the world only behind United States. At 1.66 km of roads per square kilometre of land (2.68 miles per square mile), the quantitative density of India's road network is higher than that of Japan (0.91) and United States (0.67), and far higher than that of China (0.46), Brazil (0.18) or Russia (0.08).[261] Qualitatively, India's roads are a mix of modern highways and narrow, unpaved roads, and are being improved.[262] As of 31 March 2015,[update] 87.05% of Indian roads were paved.[261] It is upgrading its infrastructure. As of May 2014,[update] India had completed over 22,600 kilometres (14,000 mi) of 4- or 6-lane highways, connecting most of its major manufacturing, commercial and cultural centres.[263] India's road infrastructure carries 60% of freight and 87% of passenger traffic.[264]
.jpg)
India has a coastline of 7,500 kilometres (4,700 mi) with 13 major ports, 15 big private ports and 60 operational non-major ports, which together handle 95% of the country's external trade by volume and 70% by value (most of the remainder handled by air).[265] Kandla Port, New Kandla is the largest public port established in early 1960's, while Mundra is the largest private sea port.[266] The airport infrastructure of India includes 125 airports,[267] of which 66 airports are licensed to handle both passengers and cargo.[268]
Petroleum products and chemicals

Petroleum products and chemicals are a major contributor to India's industrial GDP, and together they contribute over 34% of its export earnings. India hosts many oil refinery and petrochemical operations developed with help of Soviet technology such as Barauni Refinery and Gujarat Refinery , it also includes the world's largest refinery complex in Jamnagar that processes 1.24 million barrels of crude per day.[269] By volume, the Indian chemical industry was the third-largest producer in Asia, and contributed 5% of the country's GDP. India is one of the five-largest producers of agrochemicals, polymers and plastics, dyes and various organic and inorganic chemicals.[270] Despite being a large producer and exporter, India is a net importer of chemicals due to domestic demands.[271] India's chemical industry is extremely diversified and estimated at $178 billion.[272]
The chemical industry contributed $163 billion to the economy in FY18 and is expected to reach $300–400 billion by 2025.[273][274] The industry employed 17.33 million people (4% of the workforce) in 2016.[180]
Engineers India, a consulting firm which designs refinery and other petrochemical complex is currently executing the construction of Barmer Refinery to be completed by 2024.
Pharmaceuticals
The Indian pharmaceutical industry has grown in recent years to become a major manufacturer of health care products for the world. India holds a 20% market share in the global supply of generics by volume.[275] The Indian pharmaceutical sector also supplies over 62% of the global demand for various vaccines.[276] India's pharmaceutical exports stood at $17.27 billion in 2017–18 and are expected to reach $20 billion by 2020.[275] The industry grew from $6 billion in 2005 to $36.7 billion in 2016, a compound annual growth rate (CAGR) of 17.46%. It is expected to grow at a CAGR of 15.92% to reach $55 billion in 2020. India is expected to become the sixth-largest pharmaceutical market in the world by 2020.[277] India is the world's largest manufacturer of generic drugs, and its pharmaceutical sector fulfills over 50% of the global demand for vaccines.[278] It is one of the fastest-growing industrial sub-sectors and a significant contributor to India's export earnings. The state of Gujarat has become a hub for the manufacture and export of pharmaceuticals and active pharmaceutical ingredients (APIs).[279]
Textile
The textile and apparel market in India was estimated to be $108.5 billion in 2015. It is expected to reach a size of $226 billion by 2023. The industry employees over 35 million people. By value, the textile industry accounts for 7% of India's industrial, 2% of GDP and 15% of the country's export earnings. India exported $39.2 billion worth of textiles in the 2017–18 fiscal year.[280] The Indian textiles industry is estimated at $100 billion and contributes 13% of industrial output and 2.3% of India's GDP while employs over 45 million people directly.[281]
India's textile industry has transformed in recent years from a declining sector to a rapidly developing one. After freeing the industry in 2004–2005 from a number of limitations, primarily financial, the government permitted massive investment inflows, both domestic and foreign. From 2004 to 2008, total investment into the textile sector increased by $27 billion. Ludhiana produces 90% of woollens in India and is known as the Manchester of India. Tirupur has gained universal recognition as the leading source of hosiery, knitted garments, casual wear, and sportswear. Expanding textile centres such as Ichalkaranji enjoy one of the highest per-capita incomes in the country.[282] India's cotton farms, fibre and textile industry provides employment to 45 million people in India,[283] including some child labour (1%). The sector is estimated to employ around 400,000 children under the age of 18.[284]
Pulp and paper
The pulp and paper industry in India is one of the major producers of paper in the world and has adopted new manufacturing technology.[285] The paper market in India was estimated to be worth ₹600 billion (US$8.4 billion) in 2017–18 recording a CAGR of 6–7%. Domestic demand for paper almost doubled from around 9 megatonnes (8.9 million long tons; 9.9 million short tons) in the 2007–08 fiscal to over 17 megatonnes (17 million long tons; 19 million short tons) in 2017–18. The per capita consumption of paper in India is around 13–14 kg annually, lower than the global average of 57 kg.[286]
Mining

Mining contributed $63 billion (3% of GDP) and employed 20.14 million people (5% of the workforce) in 2016.[180] India's mining industry was the fourth-largest producer of minerals in the world by volume, and eighth-largest producer by value in 2009.[287] In 2013, it mined and processed 89 minerals, of which four were fuel, three were atomic energy minerals, and 80 non-fuel.[288] The public sector accounted for 68% of mineral production by volume in 2011–12.[289] India has the world's fourth-largest natural resources, with the mining sector contributing 11% of the country's industrial GDP and 2.5% of total GDP.
Nearly 50% of India's mining industry, by output value, is concentrated in eight states: Odisha, Rajasthan, Chhattisgarh, Andhra Pradesh, Telangana, Jharkhand, Madhya Pradesh and Karnataka. Another 25% of the output by value comes from offshore oil and gas resources.[289] India operated about 3,000 mines in 2010, half of which were coal, limestone and iron ore.[290] On output-value basis, India was one of the five largest producers of mica, chromite, coal, lignite, iron ore, bauxite, barite, zinc and manganese; while being one of the ten largest global producers of many other minerals.[287][289] India was the fourth-largest producer of steel in 2013,[291] and the seventh-largest producer of aluminium.[292]
India's mineral resources are vast.[293] However, its mining industry has declined – contributing 2.3% of its GDP in 2010 compared to 3% in 2000, and employed 2.9 million people – a decreasing percentage of its total labour. India is a net importer of many minerals including coal. India's mining sector decline is because of complex permit, regulatory and administrative procedures, inadequate infrastructure, shortage of capital resources, and slow adoption of environmentally sustainable technologies.[289][294]
Construction
The construction industry contributed $288 billion (13% of GDP) and employed 60.42 million people (14% of the workforce) in 2016.[180] The construction and real estate sector ranks third among the 14 major sectors in terms of direct, indirect, and induced effects in all sectors of the economy.[295]
The real estate sector will provide huge business opportunities, employment and big avenues for startup ecosystem. The 2023 Union budget of India also focused significantly on infrastructure with nearly ₹10 trillion direct investment of central government.[296]
Services and Consulting industry

The services sector has the largest share of India's GDP, accounting for 57% in 2012, up from 15% in 1950.[200] It is the seventh-largest services sector by nominal GDP, and third largest when purchasing power is taken into account. The services sector provides employment to 27% of the workforce. Information technology and business process outsourcing are among the fastest-growing sectors, having a cumulative growth rate of revenue 33.6% between fiscal years 1997–98 and 2002–03, and contributing to 25% of the country's total exports in 2007–08.[297][needs update]
Aviation

India is the fourth-largest civil aviation market in the world recording an air traffic of 158 million passengers in 2017.[298][299] The market is estimated to have 800 aircraft by 2020, which would account for 4.3% of global volumes,[300] and is expected to record annual passenger traffic of 520 million by 2037.[299] IATA estimated that aviation contributed $30 billion to India's GDP in 2017, and supported 7.5 million jobs – 390,000 directly, 570,000 in the value chain, and 6.2 million through tourism.[299]
Civil aviation in India traces its beginnings to 18 February 1911, when Henri Pequet, a French aviator, carried 6,500 pieces of mail on a Humber biplane from Allahabad (present-day Prayagraj) to Naini.[301] Later on 15 October 1932, J.R.D. Tata flew a consignment of mail from Karachi to Juhu Airport. His airline later became Air India and was the first Asian airline to cross the Atlantic Ocean as well as first Asian airline to fly jets.[302]
Nationalisation
In March 1953, the Indian Parliament passed the Air Corporations Act to streamline and nationalise the then existing privately owned eight domestic airlines into Indian Airlines for domestic services and the Tata group-owned Air India for international services.[301] The International Airports Authority of India (IAAI) was constituted in 1972 while the National Airports Authority was constituted in 1986. The Bureau of Civil Aviation Security was established in 1987 following the crash of Air India Flight 182.
De-regulation
The government de-regularised the civil aviation sector in 1991 when the government allowed private airlines to operate charter and non-scheduled services under the 'Air Taxi' Scheme until 1994, when the Air Corporation Act was repealed and private airlines could now operate scheduled services. Private airlines including Jet Airways, Air Sahara, Modiluft, Damania Airways and NEPC Airlines commenced domestic operations during this period.[301]
The aviation industry experienced a rapid transformation following deregulation. Several low-cost carriers entered the Indian market in 2004–05. Major new entrants included Air Deccan, Air Sahara, Kingfisher Airlines, SpiceJet, GoAir, Paramount Airways and IndiGo. Kingfisher Airlines became the first Indian air carrier on 15 June 2005 to order Airbus A380 aircraft worth US$3 billion.[303][304] However, Indian aviation would struggle due to an economic slowdown and rising fuel and operation costs. This led to consolidation, buyouts and discontinuations. In 2007, Air Sahara and Air Deccan were acquired by Jet Airways and Kingfisher Airlines respectively. Paramount Airways ceased operations in 2010 and Kingfisher shut down in 2012. Etihad Airways agreed to acquire a 24% stake in Jet Airways in 2013. AirAsia India, a low-cost carrier operating as a joint venture between Air Asia and Tata Sons launched in 2014. As of 2013[update]–14, only IndiGo and GoAir were generating profits.[305][needs update] The average domestic passenger air fare dropped by 70% between 2005 and 2017, after adjusting for inflation.[299]
Banking and financial services


The financial services industry contributed $809 billion (37% of GDP) and employed 14.17 million people (3% of the workforce) in 2016, and the banking sector contributed $407 billion (19% of GDP) and employed 5.5 million people (1% of the workforce) in 2016.[180] The Indian money market is classified into the organised sector, comprising private, public and foreign-owned commercial banks and cooperative banks, together known as 'scheduled banks'; and the unorganised sector, which includes individual or family-owned indigenous bankers or money lenders and non-banking financial companies.[306] The unorganised sector and microcredit are preferred over traditional banks in rural and sub-urban areas, especially for non-productive purposes such as short-term loans for ceremonies.[307]
Prime Minister Indira Gandhi nationalised 14 banks in 1969, followed by six others in 1980, and made it mandatory for banks to provide 40% of their net credit to priority sectors including agriculture, small-scale industry, retail trade and small business, to ensure that the banks fulfilled their social and developmental goals. Since then, the number of bank branches has increased from 8,260 in 1969 to 72,170 in 2007 and the population covered by a branch decreased from 63,800 to 15,000 during the same period. The total bank deposits increased from ₹59.1 billion (equivalent to ₹2.3 trillion or US$32 billion in 2019) in 1970–71 to ₹38.31 trillion (equivalent to ₹78 trillion or US$1.1 trillion in 2019) in 2008–09. Despite an increase of rural branches – from 1,860 or 22% of the total in 1969 to 30,590 or 42% in 2007 – only 32,270 of 500,000 villages are served by a scheduled bank.[308][309]
India's gross domestic savings in 2006–07 as a percentage of GDP stood at a high 32.8%.[310] More than half of personal savings are invested in physical assets such as land, houses, cattle, and gold.[311] The government-owned public-sector banks hold over 75% of total assets of the banking industry, with the private and foreign banks holding 18.2% and 6.5% respectively.[312] Since liberalisation, the government has approved significant banking reforms. While some of these relate to nationalised banks – such as reforms encouraging mergers, reducing government interference and increasing profitability and competitiveness – other reforms have opened the banking and insurance sectors to private and foreign companies.[216][313]
Financial technology
According to the report of The National Association of Software and Services Companies (NASSCOM), India has a presence of around 400 companies in the fintech space, with an investment of about $420 million in 2015.[314] The Indian fintech landscape is segmented as follows – 34% in payment processing, followed by 32% in banking and 12% in the trading, public and private markets.[315]
The Fintech growing at a compound annual growth rate (CAGR) of 22 percent during 2022 and 2030. The overall fintech market in estimated to grow to about 2.1 trillion dollars.
Information technology


The information technology (IT) industry in India consists of two major components: IT Services and business process outsourcing (BPO). The sector has increased its contribution to India's GDP from 1.2% in 1998 to 7.5% in 2012.[316] According to NASSCOM, the sector aggregated revenues of US$147 billion in 2015, where export revenue stood at US$99 billion and domestic at US$48 billion, growing by over 13%.[316] The Indian IT industry is a major exporter of IT services with $227 billion in revenue and employs over 5 million people.[317]
The growth in the IT sector is attributed to increased specialisation, and an availability of a large pool of low-cost, highly skilled, fluent English-speaking workers – matched by increased demand from foreign consumers interested in India's service exports, or looking to outsource their operations. The share of the Indian IT industry in the country's GDP increased from 4.8% in 2005–06 to 7% in 2008.[318] In 2009, seven Indian firms were listed among the top 15 technology outsourcing companies in the world.[319]
The business process outsourcing services in the outsourcing industry in India caters mainly to Western operations of multinational corporations. As of 2012,[update] around 2.8 million people work in the outsourcing sector.[320] Annual revenues are around $11 billion,[320] around 1% of GDP. Around 2.5 million people graduate in India every year. Wages are rising by 10–15 percent as a result of skill shortages.[320]
Insurance

India became the tenth-largest insurance market in the world in 2013, rising from 15th in 2011.[321][322] At a total market size of US$66.4 billion in 2013, it remains small compared to world's major economies,[323] and the Indian insurance market accounted for just 2% of the world's insurance business in 2017. India's life and non-life insurance industry collected ₹6.1 trillion (US$86 billion) in total gross insurance premiums in 2018. Life insurance accounts for 75.41% of the insurance market and the rest is general insurance.[324] Of the 52 insurance companies in India, 24 are active in life-insurance business.[323]
Specialised insurers Export Credit Guarantee Corporation and Agriculture Insurance Company (AIC) offer credit guarantee and crop insurance. It has introduced several innovative products such as weather insurance and insurance related to specific crops. The premium underwritten by the non-life insurers during 2010–11 was ₹425 billion (equivalent to ₹700 billion or US$9.9 billion in 2019) against ₹346 billion (equivalent to ₹620 billion or US$8.8 billion in 2019) in 2009–10. The growth was satisfactory,[according to whom?] particularly given across-the-broad cuts in the tariff rates. The private insurers underwrote premiums of ₹174 billion (equivalent to ₹290 billion or US$4.0 billion in 2019) against ₹140 billion (equivalent to ₹250 billion or US$3.5 billion in 2019) in 2009–10.
Life Insurance Corporation, a Government owned Public sector company has an asset of US$570 billion which greater than Apple Inc.'s US$332.16 billion.
Retail


The retail industry, excluding wholesale, contributed $793 billion (10% of GDP) and employed 35 million people (8% of the workforce) in 2020. The industry is the second largest employer in India, after agriculture.[325][326][327][328] The Indian retail market is estimated to be US$600 billion and one of the top-five retail markets in the world by economic value. India has one of the fastest-growing retail markets in the world,[329][330] and is projected to reach $1.3 trillion by 2020.[331][332] India has retail market worth $1.17 trillion, which contributes over 10% of India's GDP. It also has one of the world's fastest growing e-commerce markets.[333] The e-commerce retail market in India was valued at $32.7 billion in 2018, and is expected to reach $71.9 billion by 2022.[334]
India's retail industry mostly consists of local mom-and-pop stores, owner-staffed shops and street vendors. Retail supermarkets are expanding, with a market share of 4% in 2008.[335] In 2012, the government permitted 51% FDI in multi-brand retail and 100% FDI in single-brand retail. However, a lack of back-end warehouse infrastructure and state-level permits and red tape continue to limit growth of organised retail.[336] Compliance with over thirty regulations such as "signboard licences" and "anti-hoarding measures" must be made before a store can open for business. There are taxes for moving goods from state to state, and even within states.[335] According to The Wall Street Journal, the lack of infrastructure and efficient retail networks cause a third of India's agriculture produce to be lost from spoilage.[199]

Tourism


The World Travel & Tourism Council calculated that tourism generated ₹15.24 trillion (US$210 billion) or 9.4% of the nation's GDP in 2017 and supported 41.622 million jobs, 8% of its total employment. The sector is predicted to grow at an annual rate of 6.9% to ₹32.05 trillion (US$450 billion) by 2028 (9.9% of GDP).[337] Over 10 million foreign tourists arrived in India in 2017 compared to 8.89 million in 2016, recording a growth of 15.6%.[338] The tourism industry contributes about 9.2% of India's GDP and employs over 42 million people.[339] India earned $21.07 billion in foreign exchange from tourism receipts in 2015.[340] International tourism to India has seen a steady growth from 2.37 million arrivals in 1997 to 8.03 million arrivals in 2015. Bangladesh is the largest source of international tourists to India, while European Union nations and Japan are other major sources of international tourists.[341][342] Less than 10% of international tourists visit the Taj Mahal, with the majority visiting other cultural, thematic and holiday circuits.[343] Over 12 million Indian citizens take international trips each year for tourism, while domestic tourism within India adds about 740 million Indian travellers.[341] India has a fast-growing medical tourism sector of its health care economy, offering low-cost health services and long-term care.[344][345] In October 2015, the medical tourism sector was estimated to be worth US$3 billion. It is projected to grow to $7–8 billion by 2020.[346] In 2014, 184,298 foreign patients traveled to India to seek medical treatment.[347]
Healthcare and Travel Healthcare


India's healthcare sector is expected to grow at a CAGR of 29% between 2015 and 2020, to reach US$280 billion, buoyed by rising incomes, greater health awareness, increased precedence of lifestyle diseases, and improved access to health insurance.[277] The India hospital market size was valued at USD 93.6 billion in 2022, driven by the rise in the prevalence of chronic and infectious diseases across India. The market size is anticipated to grow at a CAGR of 5.75% during the forecast period of 2023-2031 to achieve a value of USD 154.8 billion by 2031.[348][349][350]
Travel Healthcare is a growing sector in India. In 2022,According to Federation of Indian Chambers of Commerce and Industry (FICCI) report, India's travel healthcare sector was estimated to be worth US$9 billion.[351][352] Approximately 2 million patients visit India each year from 78 countries for medical, wellness and IVF treatments, generating $6 billion for the industry which is expected to reach $13 billion by 2026 backed by the government’s Heal in India initiative.[353]
The ayurveda industry in India recorded a market size of $4.4 billion in 2018. The Confederation of Indian Industry estimates that the industry will grow at a CAGR 16% until 2025. Nearly 75% of the market comprises over-the-counter personal care and beauty products, while ayurvedic well-being or ayurvedic tourism services accounted for 15% of the market.[354]
Logistics
The logistics industry in India was worth over $160 billion in 2016, and grew at a CAGR of 7.8% in the previous five-year period. The industry employs about 22 million people.[355][356] It is expected to reach of a size of $215 billion by 2020.[357] India was ranked 35th out of 160 countries in the World Bank's 2016 Logistics Performance Index.[358]
Media and Press
An ASSOCHAM-PwC joint study projected that the Indian media and entertainment industry would grow from a size of $30.364 billion in 2017 to $52.683 billion by 2022, recording a CAGR of 11.7%. The study also predicted that television, satellite dish, over-the-top services would account for nearly half of the overall industry growth during the period.[359]
India has very popular newspaper and media outlets such as The Times of India, Hindustan Times and Zee TV.
Films, entertainment and music industry
The Indian cinema industry is expected to garner a revenue of around Rs 16,198 crore by 2026, of which Rs 15,849 would be Box office revenue and the rest Rs 349 crore from advertising, the report added.[360] India's Recorded Music industry (which is a key sub-segment) is making steady progress at a CAGR of 13.6 percent, thanks to streaming models.[360]
India has many popular music recording houses such as T-series.
Telecommunications

The telecommunication sector generated ₹2.20 trillion (US$31 billion) in revenue in 2014–15, accounting for 1.94% of total GDP.[361] India is the second-largest market in the world by number of telephone users (both fixed and mobile phones) with 1.053 billion subscribers as of 31 August 2016.[update] It has one of the lowest call-tariffs in the world, due to fierce competition among telecom operators. India has the world's third-largest Internet user-base. As of 31 March 2016,[update] there were 342.65 million Internet subscribers in the country.[362] India's telecommunication industry is the world's second largest by the number of mobile phone, smartphone, and internet users. It is the world's 24th-largest oil producer and the third-largest oil consumer.[363]
Industry estimates indicate that there are over 554 million TV consumers in India as of 2012.[update][364] India is the largest direct-to-home (DTH) television market in the world by number of subscribers. As of May 2016,[update] there were 84.80 million DTH subscribers in the country.[365]
Security markets
.jpg)

The development of Indian security markets began with the launch of the Bombay Stock Exchange (BSE) in July 1875 and the Ahmedabad Stock Exchange in 1894. Since then, 22 other exchanges have traded in Indian cities. In 2014, India's stock exchange market became the 10th largest in the world by market capitalisation, just above those of South Korea and Australia.[367] India's two major stock exchanges, BSE and the National Stock Exchange of India, had a market capitalisation of US$1.71 trillion and US$1.68 trillion as of February 2015,[update] according to the World Federation of Exchanges, which grew to $3.36 trillion and $3.31 trillion respectively by September 2021.[368][369]
The initial public offering (IPO) market in India has been small compared to NYSE and NASDAQ, raising US$300 million in 2013 and US$1.4 billion in 2012. Ernst & Young stated[370] that the low IPO activity reflects market conditions, slow government approval processes, and complex regulations. Before 2013, Indian companies were not allowed to list their securities internationally without first completing an IPO in India. In 2013, these security laws were reformed and Indian companies can now choose where they want to list first: overseas, domestically, or both concurrently.[371] Further, security laws have been revised to ease overseas listings of already-listed companies, to increase liquidity for private equity and international investors in Indian companies.[370]
Foreign trade and investment

Foreign trade
| This article needs to be updated. (January 2023) |
India's foreign trade by year
| Year | Exports (in USD billion) | Imports (in USD billion) | Trade Deficit (in USD billion) |
|---|---|---|---|
| 2021 | 420 | 612 | -192 |
| 2020 | 314.31 | 467.19 | -158.88 |
| 2019 | 330.07 | 514.07 | -184 |
| 2018 | 303.52 | 465.58 | -162.05 |
| 2017 | 275.8 | 384.3 | -108.5 |
| 2016 | 262.3 | 381 | -118.7 |
| 2015 | 310.3 | 447.9 | -137.6 |
| 2014 | 318.2 | 462.9 | -144.7 |
| 2013 | 313.2 | 467.5 | -154.3 |
| 2012 | 298.4 | 500.4 | -202.0 |
| 2011 | 299.4 | 461.4 | -162.0 |
| 2010 | 201.1 | 327.0 | -125.9 |
| 2009 | 168.2 | 274.3 | -106.1 |
| 2008 | 176.4 | 305.5 | -129.1 |
| 2007 | 112.0 | 100.9 | 11.1 |
| 2006 | 76.23 | 113.1 | -36.87 |
| 2005 | 69.18 | 89.33 | -20.15 |
| 2004 | 57.24 | 74.15 | -16.91 |
| 2003 | 48.3 | 61.6 | -13.3 |
| 2002 | 44.5 | 53.8 | -9.3 |
| 2001 | 42.5 | 54.5 | -12.0 |
| 2000 | 43.1 | 60.8 | -17.7 |
| 1999 | 36.3 | 50.2 | -13.9 |
Until the liberalisation of 1991, India was largely and intentionally isolated from world markets, to protect its economy and to achieve self-reliance. Foreign trade was subject to import tariffs, export taxes and quantitative restrictions, while foreign direct investment (FDI) was restricted by upper-limit equity participation, restrictions on technology transfer, export obligations and government approvals; these approvals were needed for nearly 60% of new FDI in the industrial sector. The restrictions ensured that FDI averaged only around $200 million annually between 1985 and 1991; a large percentage of the capital flows consisted of foreign aid, commercial borrowing and deposits of non-resident Indians.[372] India's exports were stagnant for the first 15 years after independence, due to general neglect of trade policy by the government of that period; imports in the same period, with early industrialisation, consisted predominantly of machinery, raw materials and consumer goods.[373] Since liberalisation, the value of India's international trade has increased sharply,[374] with the contribution of total trade in goods and services to the GDP rising from 16% in 1990–91 to 47% in 2009–10.[375][376] Foreign trade accounted for 48.8% of India's GDP in 2015.[377] Globally, India accounts for 1.44% of exports and 2.12% of imports for merchandise trade and 3.34% of exports and 3.31% of imports for commercial services trade.[376] India's major trading partners are the European Union, China, United States and United Arab Emirates.[378] In 2006–07, major export commodities included engineering goods, petroleum products, chemicals and pharmaceuticals, gems and jewellery, textiles and garments, agricultural products, iron ore and other minerals. Major import commodities included crude oil and related products, machinery, electronic goods, gold and silver.[379] In November 2010, exports increased 22.3% year-on-year to ₹851 billion (equivalent to ₹1.5 trillion or US$22 billion in 2019), while imports were up 7.5% at ₹1.25 trillion (equivalent to ₹2.3 trillion or US$32 billion in 2019). The trade deficit for the same month dropped from ₹469 billion (equivalent to ₹950 billion or US$13 billion in 2019) in 2009 to ₹401 billion (equivalent to ₹720 billion or US$10 billion in 2019) in 2010.[380]
India is a founding-member of General Agreement on Tariffs and Trade (GATT) and its successor, the WTO. While participating actively in its general council meetings, India has been crucial in voicing the concerns of the developing world. For instance, India has continued its opposition to the inclusion of labour, environmental issues and other non-tariff barriers to trade in WTO policies.[381]
India secured 43rd place in competitiveness index.[382]
Balance of payments

Since independence, India's balance of payments on its current account has been negative. Since economic liberalisation in the 1990s, precipitated by a balance-of-payment crisis, India's exports rose consistently, covering 80.3% of its imports in 2002–03, up from 66.2% in 1990–91.[383] However, the global economic slump followed by a general deceleration in world trade saw the exports as a percentage of imports drop to 61.4% in 2008–09.[384] India's growing oil import bill is seen as the main driver behind the large current account deficit,[385] which rose to $118.7 billion, or 11.11% of GDP, in 2008–09.[386] Between January and October 2010, India imported $82.1 billion worth of crude oil.[385] The Indian economy has run a trade deficit every year from 2002 to 2012, with a merchandise trade deficit of US$189 billion in 2011–12.[387] Its trade with China has the largest deficit, about $31 billion in 2013.[388]
India's reliance on external assistance and concessional debt has decreased since liberalisation of the economy, and the debt service ratio decreased from 35.3% in 1990–91 to 4.4% in 2008–09.[389] In India, external commercial borrowings (ECBs), or commercial loans from non-resident lenders, are being permitted by the government for providing an additional source of funds to Indian corporates. The Ministry of Finance monitors and regulates them through ECB policy guidelines issued by the Reserve Bank of India (RBI) under the Foreign Exchange Management Act of 1999.[390] India's foreign exchange reserves have steadily risen from $5.8 billion in March 1991 to ₹38,832.21 billion (US$540 billion) in July 2020.[78][391] In 2012, United Kingdom announced an end to all financial aid to India, citing the growth and robustness of Indian economy.[392][393]
India's current account deficit reached an all-time high in 2013.[394] India has historically funded its current account deficit through borrowings by companies in the overseas markets or remittances by non-resident Indians and portfolio inflows. From April 2016 to January 2017, RBI data showed that, for the first time since 1991, India was funding its deficit through foreign direct investment inflows. The Economic Times noted that the development was "a sign of rising confidence among long-term investors in Prime Minister Narendra Modi's ability to strengthen the country's economic foundation for sustained growth".[395]
Foreign direct investment
| This section needs to be updated. (October 2015) |
| Rank | Country | Inflows (million US$) |
Inflows (%) |
|---|---|---|---|
| 1 | Mauritius | 50,164 | 42.00 |
| 2 | Singapore | 11,275 | 9.00 |
| 3 | US | 8,914 | 7.00 |
| 4 | UK | 6,158 | 5.00 |
| 5 | Netherlands | 4,968 | 4.00 |
As the third-largest economy in the world in PPP terms, India has attracted foreign direct investment (FDI).[397] During the year 2011, FDI inflow into India stood at $36.5 billion, 51.1% higher than the 2010 figure of $24.15 billion. India has strengths in telecommunication, information technology and other significant areas such as auto components, chemicals, apparels, pharmaceuticals, and jewellery. Despite a surge in foreign investments, rigid FDI policies[398] were a significant hindrance. Over time, India has adopted a number of FDI reforms.[397] India has a large pool of skilled managerial and technical expertise. The size of the middle-class population stands at 300 million and represents a growing consumer market.[399]
India liberalised its FDI policy in 2005, allowing up to a 100% FDI stake in ventures. Industrial policy reforms have substantially reduced industrial licensing requirements, removed restrictions on expansion and facilitated easy access to foreign technology and investment. The upward growth curve of the real-estate sector owes some credit to a booming economy and liberalised FDI regime. In March 2005, the government amended the rules to allow 100% FDI in the construction sector, including built-up infrastructure and construction development projects comprising housing, commercial premises, hospitals, educational institutions, recreational facilities, and city- and regional-level infrastructure.[400] Between 2012 and 2014, India extended these reforms to defence, telecom, oil, retail, aviation, and other sectors.[401][402]
From 2000 to 2010, the country attracted $178 billion as FDI.[403] The inordinately high investment from Mauritius is due to routing of international funds through the country given significant tax advantages – double taxation is avoided due to a tax treaty between India and Mauritius, and Mauritius is a capital gains tax haven, effectively creating a zero-taxation FDI channel.[404] FDI accounted for 2.1% of India's GDP in 2015.[377]
As the government has eased 87 foreign investment direct rules across 21 sectors in the last three years, FDI inflows hit $60.1 billion between 2016 and 2017 in India.[405][406]
Outflows
Since 2000, Indian companies have expanded overseas, investing FDI and creating jobs outside India. From 2006 to 2010, FDI by Indian companies outside India amounted to 1.34 per cent of its GDP.[407] Indian companies have deployed FDI and started operations in United States,[408] Europe and Africa.[409] The Indian conglomerate Tata Group is United Kingdom's largest manufacturer and private-sector employer.[410][411]
Remittances
In 2015, a total of US$68.91 billion was made in remittances to India from other countries, and a total of US$8.476 billion was made in remittances by foreign workers in India to their home countries. UAE, US, and Saudi Arabia were the top sources of remittances to India, while Bangladesh, Pakistan, and Nepal were the top recipients of remittances from India.[412] Remittances to India accounted for 3.32% of the country's GDP in 2015.[377]
Mergers and acquisitions
Between 1985 and 2018 20,846 deals have been announced in, into (inbound) and out of (outbound) India. This cumulates to a value of US$618 billion. In terms of value, 2010 has been the most active year with deals worth almost 60 bil. USD. Most deals have been conducted in 2007 (1,510).[413]
Here is a list of the top 10 deals with Indian companies participating:
| Acquiror Name | Acquiror Mid Industry | Acquiror Nation | Target Name | Target Mid Industry | Target Nation | Value of Transaction ($mil) |
| Petrol Complex Pte Ltd | Oil & Gas | Singapore | Essar Oil Ltd | Oil & Gas | India | 12,907.25 |
| Vodafone Grp Plc | Wireless | United Kingdom | Hutchison Essar Ltd | Telecommunications Services | India | 12,748.00 |
| Vodafone Grp PLC-Vodafone Asts | Wireless | India | Idea Cellular Ltd-Mobile Bus | Wireless | India | 11,627.32 |
| Bharti Airtel Ltd | Wireless | India | MTN Group Ltd | Wireless | South Africa | 11,387.52 |
| Bharti Airtel Ltd | Wireless | India | Zain Africa BV | Wireless | Nigeria | 10,700.00 |
| BP PLC | Oil & Gas | United Kingdom | Reliance Industries Ltd-21 Oil | Oil & Gas | India | 9,000.00 |
| MTN Group Ltd | Wireless | South Africa | Bharti Airtel Ltd | Wireless | India | 8,775.09 |
| Shareholders | Other Financials | India | Reliance Inds Ltd-Telecom Bus | Telecommunications Services | India | 8,063.01 |
| Oil & Natural Gas Corp Ltd | Oil & Gas | India | Hindustan Petro Corp Ltd | Petrochemicals | India | 5,784.20 |
| Reliance Commun Ventures Ltd | Telecommunications Services | India | Reliance Infocomm Ltd | Telecommunications Services | India | 5,577.18 |
Currency

• EXCHANGE RATES
| Year | INR₹ per US$ (annual average)[414] |
INR₹ per Pound(£) (annual average)[415] |
|---|---|---|
| 1947 | 3.31 | 13.33 |
| 1950 | 4.76 | N/A |
| 1967 | 7.50 | 17.76 |
| 1975 | 9.4058 | N/A |
| 1980 | 7.88 | N/A |
| 1985 | 12.364 | N/A |
| 1987 | N/A | 21.18 |
| 1990 | 17.4992 | 31.07 |
| 1995 | 32.4198 | 51.17 |
| 2000 | 44.9401 | 67.99 |
| 2005 | 44.1000 | 80.15 |
| 2010 | 45.7393 | 70.65 |
| 2015 | 64.05 | 98.0101 |
| 2016 | 67.09 | 90.72 |
| 2017 | 64.14 | 87.56 |
| 2018 | 69.71 | 98.51 |
| 2019 | 70.394 | 95.06 |
| 2020 | 72.97 | 100.05 |
| 2021 | 74.98 | 101.56 |
The Indian rupee (₹) is the only legal tender in India, and is also accepted as legal tender in neighbouring Nepal and Bhutan, both of which peg their currency to that of the Indian rupee. The rupee previously was divided into 100 paise, which no longer exist. The highest-denomination banknote is the ₹2,000 note until 30 September 2023 after which it will be scrapped and ₹500 note will become the highest denomination; the lowest-denomination coin in circulation is the ₹1 coin.[417] In 2017, demonetisation was announced in which ₹500 and ₹1000 notes were withdrawn and new ₹500 notes were issued. India's monetary system is managed by the Reserve Bank of India (RBI), the country's central bank.[418] Established on 1 April 1935 and nationalised in 1949, the RBI serves as the nation's monetary authority, regulator and supervisor of the monetary system, banker to the government, custodian of foreign exchange reserves, and as an issuer of currency. It is governed by a central board of directors, headed by a governor who is appointed by the Government of India.[419] The benchmark interest rates are set by the Monetary Policy Committee.
The rupee was linked to the British pound from 1927 to 1946, and then to US dollar until 1975 through a fixed exchange rate. It was devalued in September 1975 and the system of fixed par rate was replaced with a basket of four major international currencies: the British pound, US dollar, the Japanese yen and the Deutsche Mark.[420] In 1991, after the collapse of its largest trading partner, the Soviet Union, India faced the major foreign exchange crisis and the rupee was devalued by around 19% in two stages on 1 and 2 July. In 1992, a Liberalized Exchange Rate Mechanism (LERMS) was introduced. Under LERMS, exporters had to surrender 40 percent of their foreign exchange earnings to the RBI at the RBI-determined exchange rate; the remaining 60% could be converted at the market-determined exchange rate. In 1994, the rupee was convertible on the current account, with some capital controls.[421]
After the sharp devaluation in 1991 and transition to current account convertibility in 1994, the value of the rupee has been largely determined by market forces. The rupee has been fairly stable during the decade 2000–2010. In October 2022, rupee touched an all-time low 83.29 to US dollar.[422] [423]
Income and consumption
| This article needs to be updated. (March 2022) |
India's gross national income per capita had experienced high growth rates since 2002. It tripled from ₹19,040 in 2002–03 to ₹53,331 in 2010–11, averaging 13.7% growth each of these eight years, with peak growth of 15.6% in 2010–11[426] and, growth in the inflation-adjusted per-capita income of the nation slowed to 5.6% in 2010–11, down from 6.4% in the previous year. These consumption levels are on an individual basis.[427] The average family income in India was $6,671 per household in 2011.[428]
According to 2011 census data, India has about 330 million houses and 247 million households. The household size in India has dropped in recent years, the 2011 census reporting 50% of households have four or fewer members, with an average of 4.8 members per household including surviving grandparents.[429][430] These households produced a GDP of about $1.7 trillion.[431] Consumption patterns note: approximately 67% of households use firewood, crop residue, or cow-dung cakes for cooking purposes; 53% do not have sanitation or drainage facilities on premises; 83% have water supply within their premises or 100 metres (330 ft) from their house in urban areas and 500 metres (1,600 ft) from the house in rural areas; 67% of the households have access to electricity; 63% of households have landline or mobile telephone service; 43% have a television; 26% have either a two- or four-wheel motor vehicle. Compared to 2001, these income and consumption trends represent moderate to significant improvements.[429] One report in 2010 claimed that high-income households outnumber low-income households.[432]
New World Wealth publishes reports tracking the total wealth of countries, which is measured as the private wealth held by all residents of a country. According to New World Wealth, India's total wealth increased from $3,165 billion in 2007 to $8,230 billion in 2017, a growth rate of 160%. India's total wealth decreased by 1% from $8.23 trillion in 2017 to $8.148 trillion in 2018, making it the sixth wealthiest nation in the world. There are 20,730 multimillionaires (7th largest in the world)[434] and 118 billionaires in India (3rd largest in the world). With 327,100 high net-worth individuals (HNWI), India is home to the 9th highest number of HNWIs in the world. Mumbai is the wealthiest Indian city and the 12th wealthiest in the world, with a total net worth of $941 billion in 2018. Twenty-eight billionaires reside in the city, ranked ninth worldwide.[435] As of December 2016,[update] the next wealthiest cities in India were Delhi ($450 billion), Bengaluru ($320 billion), Hyderabad ($310 billion), Kolkata ($290 billion), Chennai ($200 billion), and Gurugram ($110 billion).[436][437]
The Global Wealth Migration Review 2019 report, published by New World Wealth, found that 5,000 HNWI's emigrated from India in 2018, or about 2% of all HNWIs in the country. Australia, Canada, and United States were among the top destination countries.[438] The report also projected that private wealth in India would grow by around 180% to reach $22,814 billion by 2028.[435]
Poverty

In May 2014, the World Bank reviewed and proposed revisions to its poverty calculation methodology of 2005 and purchasing-power-parity basis for measuring poverty. According to the revised methodology, the world had 872.3 million people below the new poverty line, of which 179.6 million lived in India. With 17.5% of the total world's population, India had a 20.6% share of the world's poorest in 2013.[439] According to a 2005–2006 survey,[440] India had about 61 million children under the age of 5 who were chronically malnourished. A 2011 UNICEF report stated that between 1990 and 2010, India achieved a 45 percent reduction in mortality rates under the age of 5, and now ranks 46th of 188 countries on this metric.[441]
Since the early 1960s, successive governments have implemented various schemes to alleviate poverty, under central planning, that have met with partial success.[442] In 2005, the government enacted the Mahatma Gandhi National Rural Employment Guarantee Act (MGNREGA), guaranteeing 100 days of minimum wage employment to every rural household in all the districts of India.[443] In 2011, it was widely criticised and beset with controversy for corrupt officials, deficit financing as the source of funds, poor quality of infrastructure built under the programme, and unintended destructive effects.[444][445][446] Other studies suggest that the programme has helped reduce rural poverty in some cases.[447][448] Yet other studies report that India's economic growth has been the driver of sustainable employment and poverty reduction, though a sizeable population remains in poverty.[449][450] India lifted 271 million people out of poverty between 2006 and 2016, recording the fastest reductions in the multidimensional poverty index values during the period with strong improvements in areas such as assets, cooking fuel, sanitation, and nutrition.[451]
On the 2019 Global Hunger Index India ranked 102nd (out of 117 countries), being categorized as 'serious' in severity.
Employment

Agricultural and allied sectors accounted for about 52% of the total workforce in 2009–10. While agriculture employment has fallen over time in percentage of labour employed, services which include construction and infrastructure have seen a steady growth accounting for 20.3% of employment in 2012–13.[452] Of the total workforce, 7% is in the organised sector, two-thirds of which are in the government-controlled public sector.[453] About 51.2% of the workforce in India is self-employed.[452] According to a 2005–06 survey, there is a gender gap in employment and salaries. In rural areas, both men and women are primarily self-employed, mostly in agriculture. In urban areas, salaried work was the largest source of employment for both men and women in 2006.[454]
Unemployment
Unemployment in India is characterised by chronic (disguised) unemployment. Government schemes that target eradication of both poverty and unemployment – which in recent decades has sent millions of poor and unskilled people into urban areas in search of livelihoods – attempt to solve the problem by providing financial assistance for starting businesses, honing skills, setting up public sector enterprises, reservations in governments, etc. The decline in organised employment, due to the decreased role of the public sector after liberalisation, has further underlined the need for focusing on better education and created political pressure for further reforms.[455][456] India's labour regulations are heavy, even by developing country standards, and analysts have urged the government to abolish or modify them to make the environment more conducive for employment generation.[457][458] The 11th five-year plan has also identified the need for a congenial environment to be created for employment generation, by reducing the number of permissions and other bureaucratic clearances required.[459] Inequalities and inadequacies in the education system have been identified as an obstacle, which prevents the benefits of increased employment opportunities from reaching all sectors of society.[460]
Child labour
Child labour is a complex problem that is rooted in poverty. Since the 1990s, the government has implemented a variety of programs to eliminate child labour. These have included setting up schools, launching free school lunch programs, creating special investigation cells, etc.[461][462] Author Sonalde Desai stated that recent studies on child labour in India have found some pockets of industries in which children are employed, but overall, relatively few Indian children are employed. Child labour below the age of 10 is now rare. In the 10–14 age group, the latest surveys find only 2% of children working for wage, while another 9% work within their home or rural farms assisting their parents in times of high work demand such as sowing and harvesting of crops.[463]
Diaspora employment
India has the largest diaspora around the world, an estimated 32 million people according to the Ministry of External Affairs (India),[464] many of whom work overseas and remit funds back to their families. The Middle East region is the largest source of employment for expat Indians. The crude oil production and infrastructure industry of Saudi Arabia employs over 2 million expat Indians. Cities such as Dubai and Abu Dhabi in United Arab Emirates have employed another 2 million Indians during the construction boom in recent decades.[465] In 2009–10, remittances from Indian migrants overseas stood at ₹2.5 trillion (equivalent to ₹4.5 trillion or US$63 billion in 2019), the highest in the world, but their share in FDI remained low at around 1%.[466]
Trade unions
In India, the Trade Union movement is generally divided on political lines. According to provisional statistics from the Ministry of Labour, trade unions had a combined membership of 24,601,589 in 2002. As of 2008, there are 12 Central Trade Union Organisations (CTUO) recognized by the Ministry of Labour.[467] The forming of these unions was a big deal in India. It led to a big push for more regulatory laws which gave workers a lot more power.[468]
AITUC is the oldest trade union in India. It is a left supported organization. A trade union with nearly 2,000,000 members is the Self Employed Women's Association (SEWA) which protects the rights of Indian women working in the informal economy. In addition to the protection of rights, SEWA educates, mobilizes, finances, and exalts their members' trades.[469] Multiple other organizations represent workers. These organizations are formed upon different political groups. These different groups allow different groups of people with different political views to join a Union.[470]
Economic issues
Corruption
.svg)
Corruption has been a pervasive problem in India.[471] A 2005 study by Transparency International (TI) found that more than half of those surveyed had first-hand experience of paying a bribe or peddling influence to get a job done in a public office in the previous year.[472] A follow-up study in 2008 found this rate to be 40 percent.[473] In 2011, TI ranked India at 95th place amongst 183 countries in perceived levels of public sector corruption.[474] By 2016, India saw a reduction in corruption, and its ranking improved to 79th place.[475]
In 1996, red tape, bureaucracy, and the Licence Raj were suggested as a cause for the institutionalised corruption and inefficiency.[476] More recent reports[477][478][479] suggest the causes of corruption include excessive regulations and approval requirements, mandated spending programs, monopoly of certain goods and service providers by government-controlled institutions, bureaucracy with discretionary powers, and lack of transparent laws and processes.
Computerisation of services, various central and state vigilance commissions, and the 2005 Right to Information Act – which requires government officials to furnish information requested by citizens or face punitive action – have considerably reduced corruption and opened avenues to redress grievances.[472]
In 2011, the Indian government concluded that most spending fails to reach its intended recipients, as the large and inefficient bureaucracy consumes budgets.[480] India's absence rates are among the worst in the world; one study found that 25% of public sector teachers and 40% of government-owned public-sector medical workers could not be found at the workplace.[481][482] Similarly, many issues are facing Indian scientists, with demands for transparency, a meritocratic system, and an overhaul of the bureaucratic agencies that oversee science and technology.[483]
India has an underground economy, with a 2006 report alleging that India topped the worldwide list for black money with almost $1,456 billion stashed in Swiss banks. This would amount to 13 times the country's total external debt.[484][485] These allegations have been denied by the Swiss Banking Association. James Nason, the Head of International Communications for the Swiss Banking Association, suggested "The (black money) figures were rapidly picked up in the Indian media and in Indian opposition circles, and circulated as gospel truth. However, this story was a complete fabrication. The Swiss Bankers Association never published such a report. Anyone claiming to have such figures (for India) should be forced to identify their source and explain the methodology used to produce them."[486][487] A Step was taken by Prime Minister Modi, on 8 November 2016, involved the demonetization of all 500 and 1000 rupee bank notes (replaced by new 500 and 2000 rupee notes) to return black money into the economy followed by criticism that the measure was deemed ineffective by economists and negatively affected the poorest people of India. This demonetisation together with the introduction of The goods and services tax(GST) is believed to be responsible for the slowdown in growth.[488]
Education

India has made progress in increasing the primary education attendance rate and expanding literacy to approximately three-fourths of the population.[489] India's literacy rate had grown from 52.2% in 1991 to 74.04% in 2011. The right to education at the elementary level has been made one of the fundamental rights under the Eighty-Sixth Amendment of 2002, and legislation has been enacted to further the objective of providing free education to all children.[490] However, the literacy rate of 74% is lower than the worldwide average, and the country suffers from a high drop-out rate.[491] Literacy rates and educational opportunities vary by region, gender, urban and rural areas, and among different social groups.[492][493]
Economic disparities

Poverty rates in India's poorest states are three to four times higher than those in the more advanced states. While India's average annual per capita income was $1,410 in 2011 – placing it among the poorest of the world's middle-income countries – it was just $436 in Uttar Pradesh (which has more people than Brazil) and only $294 in Bihar, one of India's poorest states.
— World Bank: India Country Overview 2013[494]
A critical problem facing India's economy is the sharp and growing regional variations among India's different states and territories in terms of poverty, availability of infrastructure, and socio-economic development.[495] Six low-income states – Assam, Chhattisgarh, Nagaland, Madhya Pradesh, Odisha, and Uttar Pradesh – are home to more than one-third of India's population.[496] Severe disparities exist among states in terms of income, literacy rates, life expectancy, and living conditions.[497] The four states of Maharashtra, Tamil Nadu, Gujarat and Karnataka alone are projected to account for almost 50% of India's GDP by 2030; the five South Indian states are projected to contribute 35% of India's GDP by 2030 despite currently having 20% of India's population.[498]
The five-year plans, especially in the pre-liberalisation era, attempted to reduce regional disparities by encouraging industrial development in the interior regions and distributing industries across states. The results have been discouraging as these measures increased inefficiency and hampered effective industrial growth.[499] The more advanced states have been better placed to benefit from liberalisation, with well-developed infrastructure and an educated and skilled workforce, which attract the manufacturing and service sectors. Governments of less-advanced states have tried to reduce disparities by offering tax holidays and cheap land and focused on sectors like tourism, which can develop faster than other sectors.[500][501] India's income Gini coefficient is 33.9, according to the United Nations Development Program (UNDP), indicating overall income distribution to be more uniform than East Asia, Latin America, and Africa.[16] The Global Wealth Migration Review 2019 report, published by New World Wealth, estimated that 48% of India's total wealth was held by high-net-worth individuals.[435]
There is a continuing debate on whether India's economic expansion has been pro-poor or anti-poor.[502] Studies suggest that economic growth has been pro-poor and has reduced poverty in India.[502][503]
Climate change
Debt
External Debt
>10% Annual Change >20% Annual Change >30% Annual Change
| India External Debt – Historical Data[507][508][509] | ||
|---|---|---|
| Year | Current US $ | Annual % Change |
| 2021 | $612,865,853,448 | 8.46% |
| 2020 | $565,052,687,177 | 0.75% |
| 2019 | $560,870,595,481 | 7.65% |
| 2018 | $521,030,333,410 | 1.87% |
| 2017 | $511,472,593,374 | 12.29% |
| 2016 | $455,502,090,499 | -4.87% |
| 2015 | $478,825,585,025 | 4.66% |
| 2014 | $457,507,409,077 | 7.08% |
| 2013 | $427,245,079,806 | 8.83% |
| 2012 | $392,576,050,360 | 17.40% |
| 2011 | $334,399,298,473 | 15.14% |
| 2010 | $290,427,544,563 | 13.31% |
| 2009 | $256,312,241,333 | 12.86% |
| 2008 | $227,111,768,435 | 11.30% |
| 2007 | $204,057,539,300 | 27.92% |
| 2006 | $159,525,518,911 | 31.63% |
| 2005 | $121,195,478,445 | -1.98% |
| 2004 | $123,644,485,822 | 4.00% |
| 2003 | $118,884,622,370 | 12.43% |
| 2002 | $105,741,601,402 | 6.27% |
| 2001 | $99,500,093,586 | -1.61% |
| 2000 | $101,131,491,180 | 1.35% |
| 1999 | $99,779,510,346 | 1.47% |
| 1998 | $98,333,648,295 | 4.54% |
| 1997 | $94,059,291,709 | 0.10% |
| 1996 | $93,966,076,366 | 0.17% |
| 1995 | $93,808,975,940 | -4.18% |
| 1994 | $97,898,626,999 | 7.19% |
| 1993 | $91,330,328,768 | 4.05% |
| 1992 | $87,775,440,182 | 3.44% |
| 1991 | $84,852,336,186 | 1.65% |
| 1990 | $83,471,522,909 | 13.23% |
| 1989 | $73,721,064,976 | 24.34% |
| 1988 | $59,288,500,301 | 10.98% |
| 1987 | $53,424,896,489 | 18.96% |
| 1986 | $44,909,442,697 | 15.35% |
| 1985 | $38,934,813,159 | 18.83% |
| 1984 | $32,763,961,315 | 6.90% |
| 1983 | $30,649,492,455 | 13.76% |
| 1982 | $26,942,860,601 | 19.85% |
| 1981 | $22,480,074,709 | 8.48% |
| 1980 | $20,723,360,696 | 13.92% |
| 1979 | $18,190,384,895 | 10.11% |
| 1978 | $16,520,249,175 | 7.17% |
| 1977 | $15,414,657,570 | 5.68% |
| 1976 | $14,586,390,286 | 5.20% |
| 1975 | $13,865,614,019 | 9.20% |
| 1974 | $12,696,953,186 | 15.79% |
| 1973 | $10,965,917,520 | 9.34% |
| 1972 | $10,029,268,977 | 7.51% |
| 1971 | $9,328,742,282 | 10.73% |
| 1970 | $8,425,121,119 | 10.73% |
See also

- Economic Advisory Council
- Economic development in India
- List of megaprojects in India
- Make in India – a government program to encourage manufacturing in India
- NITI Aayog
- Startup India
- Taxation in medieval India
- Political funding in India
Events:
- Great Recession
- World oil market chronology from 2003
- Demonetization
- Economic impact of the COVID-19 pandemic in India
Lists:
- List of companies of India
- List of largest companies in India
- List of the largest trading partners of India
- List of megaprojects in India
- Trade unions in India
- Natural resources of India
Notes
- ↑ 1.0 1.1 Excluded territories
- ↑ Indian reports are released on a weekly basis rather than the traditional monthly basis with the figures being of the previous week, by Reserve Bank of India.
References
- ↑ "Information About Maharashtra, Industries, Economy, Exports of Maharashtra". India Brand Equity Foundation. Archived from the original on 4 August 2016. Retrieved 12 April 2014.
- ↑ Sudalaimuthu, S.; Raj, S. A. (2009). Logistics Management for International Business: Text and Cases. PHI Learning. ISBN 9788120337923.
- ↑ "World Economic and Financial Surveys World Economic Outlook Database—WEO Groups and Aggregates Information April 2020". IMF.org. International Monetary Fund. Archived from the original on 22 December 2019. Retrieved 2 September 2020.
- ↑ "World Bank Country and Lending Groups". World Bank. Archived from the original on 28 October 2019. Retrieved 29 September 2019.
- ↑ "India Population 1950–2023". www.macrotrends.net. Archived from the original on 19 September 2022. Retrieved 8 September 2022.
- ↑ "United Nations, Department of Economic and Social Affairs, Population Division (2019). World Population Prospects 2019, Online Edition. Rev. 1". population.un.org. United Nations. Row 137, column BZ. Archived from the original on 18 February 2020. Retrieved 24 June 2021.
- ↑ 7.0 7.1 7.2 7.3 7.4 "World Economic Outlook Database: October 2023". International Monetary Fund. October 2023. Archived from the original on 11 October 2023. Retrieved 10 October 2023.
- ↑ "The outlook is uncertain again amid financial sector turmoil, high inflation, ongoing effects of Russia's invasion of Ukraine, and three years of COVID". International Monetary Fund. 11 April 2023. Archived from the original on 13 April 2023. Retrieved 24 July 2023.
- ↑ "GDP by Sector– India FY2020-21". statisticstimes.com. Archived from the original on 3 October 2021. Retrieved 3 October 2021.
- ↑ "Press note on the First Advanced Estimates for the year 2022–23" (PDF). MoSPI. p. 4. Archived (PDF) from the original on 10 February 2023. Retrieved 6 January 2023.
- ↑ "CPI inflation rate ease to 5.62% in August;" (PDF). September 2023. Archived (PDF) from the original on 28 May 2023. Retrieved 14 September 2023.
- ↑ "Weekly Statistical Supplement – Ratio and Rates". Reserve Bank of India. Archived from the original on 30 August 2023. Retrieved 30 August 2023.
- ↑ "Poverty and Inequality Platform". World Bank. Archived from the original on 30 January 2023. Retrieved 17 May 2022.
- ↑ "National Multidimensional Poverty". Archived from the original on 21 July 2023. Retrieved 18 July 2023.
- ↑ "India". CIA.gov. Central Intelligence Agency. Archived from the original on 18 March 2021. Retrieved 10 August 2023.
- ↑ 16.0 16.1 "Income Gini coefficient". United Nations Development Program. Archived from the original on 10 June 2010. Retrieved 14 January 2017.
- ↑ "Human Development Report 2021/2022" (PDF). United Nations Development Programme. 8 September 2022. Archived (PDF) from the original on 8 September 2022. Retrieved 9 September 2022.
- ↑ "India". hdr.undp.org. UNDP. Retrieved 22 May 2023.
{{cite web}}: CS1 maint: deprecated archival service (link) - ↑ 19.0 19.1 "Labor force, total – India". World Bank & ILO. Archived from the original on 30 January 2023. Retrieved 22 December 2022.
- ↑ "Employment to population ratio, 15+, total (%) (national estimate) – India". World Bank. Archived from the original on 29 September 2019. Retrieved 29 September 2019.
- ↑ "Employment in agriculture (% of total employment) (modeled ILO estimate) – India | Data". data.worldbank.org. Archived from the original on 7 June 2019. Retrieved 14 September 2019.
- ↑ "Employment in industry (% of total employment) (modeled ILO estimate) – India | Data". data.worldbank.org. Archived from the original on 26 January 2020. Retrieved 14 September 2019.
- ↑ "Employment in services (% of total employment) (modeled ILO estimate) – India | Data". data.worldbank.org. Archived from the original on 26 January 2020. Retrieved 14 September 2019.
- ↑ "CMIE Official Unemployment in India". CMIE. Archived from the original on 10 November 2021.
- ↑ "Archived copy". Archived from the original on 29 September 2023. Retrieved 16 September 2023.
{{cite web}}: CS1 maint: archived copy as title (link) - ↑ Library of Congress 2004.
- ↑ 27.0 27.1 "INDIA'S FOREIGN TRADE: March 2023" (PDF). Ministry of commerce and Industry: Government of India. Archived (PDF) from the original on 13 April 2023. Retrieved 13 April 2023.
- ↑ 28.0 28.1 28.2 "India – WTO Statistics Database" (PDF). World Trade Organization. Archived (PDF) from the original on 31 January 2022. Retrieved 29 March 2022.
- ↑ "Up to 788% rise! India's imports from these countries spiked sharply in last 10 years". Business Today. 14 March 2023. Archived from the original on 14 March 2023. Retrieved 14 March 2023.
- ↑ "Foreign investment in India – Santandertrade.com". santandertrade.com. Archived from the original on 24 July 2023. Retrieved 24 July 2023.
- ↑ "Invest in India". international.groupecreditagricole.com. Archived from the original on 24 July 2023. Retrieved 24 July 2023.
- ↑ 32.0 32.1 32.2 32.3 "Report for Selected Countries and Subjects". IMF. Archived from the original on 13 October 2023. Retrieved 10 October 2023.
- ↑ "Reserve Bank of India – Press Releases". www.rbi.org.in. Archived from the original on 8 July 2022. Retrieved 8 July 2022.
- ↑ "Reserve Bank of India – Press Releases". Archived from the original on 2 September 2023. Retrieved 2 September 2023.
- ↑ "Reserve Bank of India – Press Releases". www.rbi.org.in. Archived from the original on 13 October 2023. Retrieved 10 October 2023.
- ↑ Batra, Shubham; Ohri, Nikunj; Acharya, Shivangi (1 February 2023). "India hikes spending, shuns 'outright populism' in last pre-election budget". Reuters. Archived from the original on 1 February 2023. Retrieved 1 February 2023 – via www.reuters.com.
- ↑ 37.0 37.1 "Union Budget 2023–24 Analysis". Archived from the original on 20 March 2023. Retrieved 11 April 2023.
- ↑ "Lines of Credit for Development Projects". Wristband.com. 1 April 2017. Archived from the original on 19 January 2022. Retrieved 14 February 2022.
- ↑ 39.0 39.1 39.2 "India: Sovereign credit ratings". TheGlobalEconomy.com. Archived from the original on 28 October 2020. Retrieved 26 May 2020.
- ↑ "DBRS" (PDF). 15 May 2019. Archived from the original (PDF) on 15 May 2019.
- ↑ "Reserve Bank of India – Weekly Statistical Supplement". Reserve Bank of India. Archived from the original on 8 June 2021. Retrieved 10 November 2023.
- ↑ 42.0 42.1 * "Indian Economic policy: View: India needn't worry about the 'middle-income trap'". The Economic Times. Archived from the original on 5 April 2023. Retrieved 5 December 2020.
- Alamgir, Jalal (2008). India's Open-Economy Policy: Globalism, Rivalry, Continuity. Routledge. p. 176. ISBN 978-1-135-97056-7. Archived from the original on 9 November 2023. Retrieved 10 November 2020.
- Kanungo, Rama P.; Rowley, Chris; Banerjee, Anurag N. (2018). Changing the Indian Economy: Renewal, Reform and Revival. Elsevier. p. 24. ISBN 978-0-08-102014-2.[permanent dead link]
- Kaushik, Surendra K. (1997). "India's Evolving Economic Model: A Perspective on Economic and Financial Reforms". The American Journal of Economics and Sociology. 56 (1): 69–84. doi:10.1111/j.1536-7150.1997.tb03452.x. ISSN 0002-9246. JSTOR 3487351.
- ↑ "IMF DataMapper / Datasets / World Economic Outlook (October 2022) / GDP per capita, current prices / List (2022) – Analytical group: European Union, World". IMF.org. International Monetary Fund. 11 October 2022. Archived from the original on 14 November 2022. Retrieved 17 November 2022.
- ↑ 44.0 44.1 44.2 Chandrasekhar, C. P. (2012), Kyung-Sup, Chang; Fine, Ben; Weiss, Linda (eds.), "From Dirigisme to Neoliberalism: Aspects of the Political Economy of the Transition in India" (PDF), Developmental Politics in Transition: The Neoliberal Era and Beyond, International Political Economy Series, London: Palgrave Macmillan UK, pp. 140–165, doi:10.1057/9781137028303_8, ISBN 978-1-137-02830-3, archived (PDF) from the original on 15 July 2021, retrieved 4 September 2020
{{citation}}: CS1 maint: work parameter with ISBN (link) - ↑ 45.0 45.1 45.2 Mazumdar, Surajit (2012). "Industrialization, Dirigisme and Capitalists: Indian Big Business from Independence to Liberalization". mpra.ub.uni-muenchen.de. Archived from the original on 18 April 2021. Retrieved 4 September 2020.
- ↑ 46.0 46.1 46.2 "Economic survey of India 2007: Policy Brief" (PDF). OECD. Archived from the original (PDF) on 6 June 2011. Retrieved 21 June 2009.
- ↑ 47.0 47.1 47.2 Edward A. Gargan (15 August 1992). "India Stumbles in Rush to a Free Market Economy". The New York Times. Archived from the original on 8 February 2011. Retrieved 17 January 2011.
- ↑ 48.0 48.1 Maddison, Angus (2007). Contours of the World Economy 1–2030 AD: Essays in Macro-Economic History. Oxford University Press. p. 379. ISBN 978-0-19-164758-1. Archived from the original on 9 November 2023. Retrieved 10 November 2020.
- ↑ 49.0 49.1 Maddison, Angus (2003): Development Centre Studies The World Economy Historical Statistics: Historical Statistics, OECD Publishing, ISBN 9264104143, page 261
- ↑ Paul Bairoch (1995). Economics and World History: Myths and Paradoxes. University of Chicago Press. p. 95. ISBN 978-0-226-03463-8.
- ↑ "Global Economy Watch – Projections > Real GDP / Inflation > Share of 2016 world GDP". PWC. Archived from the original on 19 October 2015. Retrieved 23 June 2017.
- ↑ Naill, Aaron. "India's share of global gross domestic product". Statiata. Archived from the original on 14 October 2022. Retrieved 14 October 2022.
- ↑ "Field Listing: GDP – Composition, by Sector of Origin". Central Intelligence Agency World Factbook. Central Intelligence Agency. Archived from the original on 18 March 2021. Retrieved 3 April 2022.
- ↑ Nagaraj, R (20 January 2020). "Understanding India's Economic Slowdown". The India Forum. Archived from the original on 11 June 2022. Retrieved 11 May 2022.
- ↑ "Final consumption expenditure (% of GDP) – India". World Bank. Archived from the original on 18 May 2022. Retrieved 11 March 2022.
- ↑ "Household final consumption expenditure (current US$) | Data". World Bank. Archived from the original on 11 November 2020. Retrieved 7 April 2018.
- ↑ "Is your debt dragging the economy down?". The Times of India. 11 September 2019. Archived from the original on 8 July 2022. Retrieved 11 September 2019.
- ↑ "World Trade Statistical Review 2022" (PDF). World Trade Organization. p. 58. Archived (PDF) from the original on 13 March 2023. Retrieved 11 March 2023.
- ↑ "India – Member information". WTO. Archived from the original on 21 May 2022. Retrieved 5 September 2019.
- ↑ "Singapore falls one spot to 4th in 2023 global competitiveness index, India ranks 40th". The Economic Times. ANI. 26 June 2023. Archived from the original on 29 September 2023. Retrieved 19 September 2023.
- ↑ Debroy, Bibek (6 July 2019). "Opinion – We can strike the GDP target, provided economy does well, rupee appreciates". livemint.com. Mint. Archived from the original on 20 May 2022.
- ↑ "Wealth of India's richest 1% more than 4-times of total for 70% poorest: Oxfam". The Economic Times. Archived from the original on 20 April 2021. Retrieved 20 January 2020.
- ↑ Rowlatt, Justin (2 May 2016). "Indian inequality still hidden". BBC. Archived from the original on 14 July 2020. Retrieved 22 January 2020.
- ↑ 64.0 64.1 "New record of over 6.77 crore Income Tax Returns (ITRs) filed till 31st July, 2023; record growth of 16.1% Year-on-Year". pib.gov.in. 1 August 2023. Archived from the original on 29 September 2023. Retrieved 19 September 2023.
- ↑ "Govt announces stimulus package, including tax cuts". Live Mint. Archived from the original on 21 June 2022. Retrieved 7 December 2008.
- ↑ "India Country Overview". World Bank. Archived from the original on 18 November 2021. Retrieved 20 January 2019.
- ↑ "Archived copy". Archived from the original on 19 October 2023. Retrieved 12 October 2023.
{{cite web}}: CS1 maint: archived copy as title (link) - ↑ "Archived copy". Archived from the original on 11 October 2023. Retrieved 12 October 2023.
{{cite web}}: CS1 maint: archived copy as title (link) - ↑ "Total Trade". commerce.gov.in/. Department of Commerce. 2019–2020. Archived from the original on 9 November 2023. Retrieved 27 December 2020.
- ↑ "FDI Statistics" (PDF). Department for Promotion of Industry and Internal Trade, MoCI, GoI. Archived (PDF) from the original on 27 July 2022. Retrieved 31 May 2022.
- ↑ "By Country/Economy – Free Trade Agreements". aric.adb.org. Archived from the original on 11 November 2020. Retrieved 30 August 2019.
- ↑ "ASIA REGIONAL INTEGRATION CENTER". ASIA REGIONAL INTEGRATION CENTER. Archived from the original on 29 August 2019. Retrieved 29 August 2019.
- ↑ "India has second fastest growing services sector". The Hindu. Archived from the original on 16 May 2016. Retrieved 18 June 2015.
- ↑ "Monthly Reports – World Federation of Exchanges". WFE. Archived from the original on 12 September 2019. Retrieved 31 August 2019.
- ↑ "Manufacturing, value added (current US$) | Data". World Bank. Archived from the original on 7 January 2020. Retrieved 11 November 2018.
- ↑ "Rural Population (% of Total Population)". World Bank. 1 May 2016. Archived from the original on 14 July 2020. Retrieved 14 July 2020.
- ↑ 77.0 77.1 "India: An agricultural powerhouse of the world". Business Standard India. 1 May 2016. Archived from the original on 28 June 2022. Retrieved 8 January 2019.
- ↑ 78.0 78.1 "Weekly statistical supplement". Reserve Bank of India. Archived from the original on 29 March 2019. Retrieved 2 December 2022.
- ↑ "Fiscal deficit for FY22 at 6.7% of GDP lower than earlier estimate". Business Standard India. Press Trust of India. 31 May 2022. Archived from the original on 9 June 2022. Retrieved 15 June 2022.
- ↑ "Unemployment Rate in India". Centre for Monitoring Indian Economy. Archived from the original on 10 November 2021. Retrieved 1 October 2019.
- ↑ "Digging Deeper, Is India's economy losing its way?". moneycontrol.com. 11 September 2019. Archived from the original on 14 April 2021. Retrieved 9 November 2019.
- ↑ "Reserve Bank of India – Publications". Reserve Bank of India. Archived from the original on 8 July 2022. Retrieved 8 July 2022.
- ↑ Kumar, Manoj (9 May 2019). "India's incredulous data: Economists create own benchmarks". Reuters. Archived from the original on 9 May 2019. Retrieved 9 May 2019.
- ↑ Sharma, Mihir S. (13 June 2019). "GDP data under cloud: Govt should know that this is a crisis of credibility". Business Standard. Archived from the original on 13 June 2019. Retrieved 13 June 2019.
- ↑ Government's spending on Social Services increased significantly during the pandemic Archived 7 November 2022 at the Wayback Machine Press Information Bureau. Government of India, Ministry of Finance 31 January 2022. Retrieved 29 November 2022.
- ↑ "Page 377 – economic_survey_2021-2022". www.indiabudget.gov.in. Archived from the original on 7 November 2022. Retrieved 7 November 2022.
- ↑ Donkin, Robin A. (August 2003). Between East and West: The Moluccas and the Traffic in Spices Up to the Arrival of Europeans. Diane Publishing Company. ISBN 0-87169-248-1.
- ↑ M. K. Kuriakose, History of Christianity in India: Source Materials, (Bangalore: United Theological College, 1982), pp. 10–12. Kuriakose gives a translation of the related but later copper plate grant to Iravi Kortan on pp. 14–15. For earlier translations, see S. G. Pothan, The Syrian Christians of Kerala, (Bombay: Asia Publishing House, 1963), pp. 102–105.
- ↑ "2000 years economic history one chart". Archived from the original on 9 September 2017. Retrieved 29 August 2017.
- ↑ "India's Rising Growth Potential" (PDF). Goldman Sachs. 2007. Archived from the original (PDF) on 24 July 2011. Retrieved 21 June 2009.
- ↑ Nehru, Jawaharlal (1946). The Discovery of India. Penguin Books. ISBN 0-14-303103-1.
- ↑ Raychaudhuri & Habib 2004, pp. 17–18
- ↑ Raychaudhuri & Habib 2004, pp. 40–41
- ↑ Hanway, Jonas (1753), An Historical Account of the British Trade Over the Caspian Sea, Sold by Mr. Dodsley, archived from the original on 9 November 2023, retrieved 14 November 2015,
... The Persians have very little maritime strength ... their ship carpenters on the Caspian were mostly Indians ... there is a little temple, in which the Indians now worship
- ↑ Stephen Frederic Dale (2002), Indian Merchants and Eurasian Trade, 1600–1750, Cambridge University Press, ISBN 0-521-52597-7, archived from the original on 9 November 2023, retrieved 14 November 2015,
... The Russian merchant, F.A. Kotov ... saw in Isfahan in 1623, both Hindus and Muslims, as Multanis.
- ↑ Scott Cameron Levi (2002), The Indian diaspora in Central Asia and its trade, 1550–1900, BRILL, ISBN 90-04-12320-2,
... George Forster ... On the 31st of March, I visited the Atashghah or place of fire; and on making myself known to the Hindoo mendicants, who resided there, I was received among these sons of Brihma as a brother
[permanent dead link] - ↑ Abraham Valentine Williams Jackson (1911), From Constantinople to the home of Omar Khayyam: travels in Transcaucasia and northern Persia for historic and literary research, The Macmillan company, archived from the original on 26 March 2023, retrieved 14 November 2015
- ↑ George Forster (1798), A journey from Bengal to England: through the northern part of India, Kashmire, Afghanistan, and Persia, and into Russia, by the Caspian-Sea, R. Faulder, archived from the original on 9 November 2023, retrieved 14 November 2015,
... A society of Moultan Hindoos, which has long been established in Baku, contributes largely to the circulation of its commerce; and with the Armenians, they may be accounted the principal merchants of Shirwan ...
- ↑ James Justinian Morier (1818), A Second Journey through Persia, Armenia, and Asia Minor, to Constantinople, between the Years 1810 and 1816, A. Strahan
- ↑ United States Bureau of Foreign Commerce (1887), Reports from the consuls of the United States, 1887, United States Government, archived from the original on 9 November 2023, retrieved 14 November 2015,
... Six or 7 miles southeast is Surakhani, the location of a very ancient monastery of the fire-worshippers of India ...
- ↑ Raychaudhuri & Habib 2004, pp. 10–13
- ↑ Datt & Sundharam 2009, p. 14
- ↑ 103.0 103.1 103.2 103.3 103.4 Karl J. Schmidt (2015), An Atlas and Survey of South Asian History, page 100 Archived 22 September 2023 at the Wayback Machine, Routledge
- ↑ Raychaudhuri & Habib 2004, pp. 360–361
- ↑ Kumar 2005, p. 3
- ↑ Irfan Habib; Dharma Kumar; Tapan Raychaudhuri (1987). The Cambridge Economic History of India (PDF). Vol. 1. Cambridge University Press. p. 214. Archived (PDF) from the original on 4 August 2017. Retrieved 5 August 2017.
- ↑ Vivek Suneja (2000). Understanding Business: A Multidimensional Approach to the Market Economy. Psychology Press. p. 13. ISBN 978-0-415-23857-1. Archived from the original on 22 September 2023. Retrieved 26 August 2017.
- ↑ 108.0 108.1 108.2 108.3 Jeffrey G. Williamson, David Clingingsmith (August 2005). "India's Deindustrialization in the 18th and 19th Centuries" (PDF). Harvard University. Archived (PDF) from the original on 13 December 2016. Retrieved 18 May 2017.
- ↑ 109.0 109.1 Parthasarathi, Prasannan (2011), Why Europe Grew Rich and Asia Did Not: Global Economic Divergence, 1600–1850, Cambridge University Press, p. 2, ISBN 978-1-139-49889-0
- ↑ Eraly, Abraham (2007). The Mughal World: Life in India's Last Golden Age. Penguin Books India. p. 5. ISBN 978-0-14-310262-5.
- ↑ Om Prakash, "Empire, Mughal Archived 18 November 2022 at the Wayback Machine", History of World Trade Since 1450, edited by John J. McCusker, vol. 1, Macmillan Reference USA, 2006, pp. 237–240, World History in Context. Retrieved 3 August 2017
- ↑ Richards, John F. (1995). The Mughal Empire. Cambridge University Press. p. 202. ISBN 978-0-521-56603-2.
- ↑ Richard Maxwell Eaton (1996), The Rise of Islam and the Bengal Frontier, 1204–1760, page 202 Archived 4 April 2023 at the Wayback Machine, University of California Press
- ↑ 114.0 114.1 Kumar 2005, pp. 5–8
- ↑ Jeffrey G. Williamson (2011). Trade and Poverty: When the Third World Fell Behind. MIT Press. p. 91. ISBN 978-0-262-29518-5. Archived from the original on 22 September 2023. Retrieved 15 August 2017.
- ↑ 116.0 116.1 Parthasarathi, Prasannan (2011), Why Europe Grew Rich and Asia Did Not: Global Economic Divergence, 1600–1850, Cambridge University Press, ISBN 978-1-139-49889-0
- ↑ Kirti N. Chaudhuri (2006). The Trading World of Asia and the English East India Company: 1660–1760. Cambridge University Press. p. 253. ISBN 978-0-521-03159-2.
- ↑ P. J. Marshall (2006). Bengal: The British Bridgehead: Eastern India 1740–1828. Cambridge University Press. p. 73. ISBN 978-0-521-02822-6.
- ↑ Kumar 2005, p. 26
- ↑ "Of Oxford, economics, empire, and freedom". The Hindu. Chennai. 2 October 2005. Archived from the original on 27 October 2005. Retrieved 6 December 2010.
- ↑ Roy 2006, pp. 158–160
- ↑ Kumar 2005, pp. 538–540
- ↑ Kumar 2005, pp. 826–827
- ↑ Kumar 2005, pp. 876–877
- ↑ Maddison A (2007), Contours of the World Economy I-2030AD, Oxford University Press, ISBN 978-0199227204. The data tables from this book are available online here [1] Archived 16 February 2019 at the Wayback Machine
- ↑ Andre Gunder Frank, Robert A. Denemark (2015). Reorienting the 19th Century: Global Economy in the Continuing Asian Age. Routledge. pp. 83–85. ISBN 978-1-317-25293-1.
- ↑ Paul Bairoch (1995). Economics and World History: Myths and Paradoxes. University of Chicago Press. pp. 95–104. Archived from the original on 12 October 2017. Retrieved 9 August 2017.
- ↑ Chris Jochnick, Fraser A. Preston (2006), Sovereign Debt at the Crossroads: Challenges and Proposals for Resolving the Third World Debt Crisis, pages 86–87 Archived 9 November 2023 at the Wayback Machine, Oxford University Press
- ↑ Parthasarathi, Prasannan (2011), Why Europe Grew Rich and Asia Did Not: Global Economic Divergence, 1600–1850, Cambridge University Press, pp. 38–45, ISBN 978-1-139-49889-0, archived from the original on 4 April 2023, retrieved 26 August 2017
- ↑ Kumar 2005, p. 422
- ↑ James Cypher (2014). The Process of Economic Development. Routledge. ISBN 978-1-136-16828-4. Archived from the original on 9 November 2023. Retrieved 26 August 2017.
- ↑ Broadberry, Stephen; Gupta, Bishnupriya (2005). "Cotton textiles and the great divergence: Lancashire, India and shifting competitive advantage, 1600–1850" (PDF). International Institute of Social History. Department of Economics, University of Warwick. Archived (PDF) from the original on 10 September 2016. Retrieved 5 December 2016.
- ↑ Paul Bairoch (1995). Economics and World History: Myths and Paradoxes. University of Chicago Press. p. 89. Archived from the original on 12 October 2017. Retrieved 9 August 2017.
- ↑ Henry Yule, A. C. Burnell (2013). Hobson-Jobson: The Definitive Glossary of British India. Oxford University Press. p. 20. ISBN 978-1-317-25293-1.
- ↑ Roy 2006, pp. 291–292
- ↑ Roy 2006, p. 1
- ↑ 137.0 137.1 Datt & Sundharam 2009, p. 179
- ↑ Kumar 2005, p. 519
- ↑ Irfan Habib; Dharma Kumar; Tapan Raychaudhuri (1987). The Cambridge Economic History of India (PDF). Vol. 1. Cambridge University Press. p. 165. Archived (PDF) from the original on 4 August 2017. Retrieved 5 August 2017.
- ↑ Kumar 2005, pp. 520–521
- ↑ Roy 2006, pp. 22–24
- ↑ Parthasarathi, Prasannan (2011). Why Europe Grew Rich and Asia Did Not: Global Economic Divergence, 1600–1850. p. 45.
- ↑ 143.0 143.1 Sivramkrishna, Sashi (2009). "Ascertaining Living Standards in Erstwhile Mysore, Southern India, from Francis Buchanan's Journey of 1800-01: An Empirical Contribution to the Great Divergence". Journal of the Economic and Social History. 52 (4): 729. doi:10.1163/002249909X12574071689177.
- ↑ Panagariya 2008, pp. 31–32
- ↑ Panagariya 2008, p. 24
- ↑ Staley, Sam (2006). "The Rise and Fall of Indian Socialism: Why India embraced economic reform". Reason. Archived from the original on 14 January 2009. Retrieved 17 January 2011.
- ↑ Data Source: Tables of Prof. Angus Maddison (2010). The per capita GDP over various years and population data can be downloaded in a spreadsheet from here [2] Archived 16 February 2019 at the Wayback Machine.
- ↑ The 2015 estimate is retrieved from the International Monetary Fund.
- ↑ 149.0 149.1 Das, Gurcharan (2002). India Unbound. Anchor Books. pp. 167–174. ISBN 978-0-385-72074-8.
- ↑ Datt & Sundharam 2009, pp. 185–187
- ↑ Cameron, John; Ndhlovu, P Tidings (September 2001). "Cultural Influences on Economic Thought in India: Resistance to diffusion of neo-classical economics and the principles of Hinduism" (PDF). Economic Issues. 6 (2). Archived from the original (PDF) on 23 August 2006. Retrieved 17 January 2011.
- ↑ Roy, Subroto (22 September 1998). "Milton Friedman on the Nehru/Mahalanobis Plan". India Policy Institute. Archived from the original on 31 March 2016. Retrieved 16 July 2005.
- ↑ Datt & Sundharam 2009, pp. 504–506
- ↑ Datt & Sundharam 2009, p. 507
- ↑ Ghosh, Arunabha (1 June 2004). "India's pathway through economic crisis(which makes failer of mixed economy)" (PDF). GEG Working Paper 2004/06. Global Economic Governance Programme. Archived from the original (PDF) on 12 November 2011. Retrieved 12 December 2009.
- ↑ Task Force Report 2006, p. 7.
- ↑ Task Force Report 2006, pp. 7–8.
- ↑ "That old Gandhi magic". The Economist. 27 November 1997. Archived from the original on 6 May 2009. Retrieved 17 January 2011.
- ↑ Task Force Report 2006, pp. 17–20.
- ↑ "Where does India stand in the list of world's largest economies?". Times Now. 2 April 2020. Archived from the original on 17 June 2022. Retrieved 17 June 2022.
- ↑ "PRESS NOTE ON SECOND ADVANCE ESTIMATES OF NATIONAL INCOME 2017–18" (PDF). Ministry of Statistics and Programme Implementation. Archived (PDF) from the original on 16 May 2018. Retrieved 26 May 2018.
- ↑ "Demonetisation, GST impact: IMF lowers India's 2017 growth forecast to 6.7%". Hindustan Times. 10 October 2017. Archived from the original on 26 May 2018. Retrieved 26 May 2018.
- ↑ Economy Profile India Archived 14 July 2020 at the Wayback Machine Doing Business 2020
- ↑ "Rankings & Ease of Doing Business Score". DoingBusiness.org. Archived from the original on 15 September 2018. Retrieved 31 October 2018.
- ↑ "Business Reforms Action Plan". Business Reforms Action Plan. Archived from the original on 15 February 2017. Retrieved 8 July 2016.
- ↑ "A Bigger Hit on the Economy?". The Economic Times (ET Graphics). 21 May 2020. p. 1. Archived from the original on 17 June 2020. Retrieved 21 May 2020.
- ↑ Noronha, Gaurav (2 May 2020). "India's GDP to see 5% contraction in FY21, says Icra". The Economic Times. Archived from the original on 26 June 2020. Retrieved 21 May 2020.
- ↑ Nagarajan, Shalini (21 May 2020). "Goldman Sachs: India's economy will shrink 45% this quarter and suffer a brutal recession this year". Business Insider. Archived from the original on 3 June 2020. Retrieved 21 May 2020.
- ↑ "Goldman report most damning". The Daily Telegraph. 19 May 2020. Archived from the original on 25 May 2020. Retrieved 21 May 2020.
- ↑ "Indian economy contracts by 6.6 pc in 2020–21". The Economic Times. Press Trust of India. 31 January 2021. Archived from the original on 31 January 2022. Retrieved 3 September 2022.
- ↑ Dhasmana, Indivjal; Choudhury, Shrimi (6 October 2021). "Moody's upgrades India's rating outlook to 'stable' from 'negative'". Business Standard. Archived from the original on 16 August 2022. Retrieved 3 September 2022.
- ↑ Dhoot, Vikas (31 August 2022). "India's GDP grows at 13.5% in April–June quarter". The Hindu. Archived from the original on 3 September 2022. Retrieved 3 September 2022.
- ↑ "Report for Selected Countries and Subjects". Imf. Archived from the original on 13 October 2023. Retrieved 10 October 2023.
- ↑ "Unemployment, total (% of total labor force) (modeled ILO estimate) | Data". data.worldbank.org. Archived from the original on 12 June 2019. Retrieved 1 March 2022.
- ↑ "Archived copy". Archived from the original on 17 October 2023. Retrieved 16 October 2023.
{{cite web}}: CS1 maint: archived copy as title (link) - ↑ "Archived copy" (PDF). Archived (PDF) from the original on 15 August 2022. Retrieved 16 October 2023.
{{cite web}}: CS1 maint: archived copy as title (link) - ↑ Indian Economy Archived 5 July 2014 at the Wayback Machine Government of India (2013)
- ↑ Employment across various sectors Archived 23 November 2018 at the Wayback Machine, NSSO 66th Nationwide Survey, Planning Commission, Government of India (3 June 2014)
- ↑ "Indian Economy At a Glance". Archived from the original on 15 May 2016. Retrieved 9 October 2015.
- ↑ 180.0 180.1 180.2 180.3 180.4 180.5 "BENCHMARK REPORT 2017 – INDI" (PDF). World Travel and Tourism Council. Archived from the original (PDF) on 12 April 2018. Retrieved 11 April 2018.
- ↑ "Agriculture in India: Information About Indian Agriculture & Its Importance". ibef.org. Archived from the original on 6 March 2022. Retrieved 22 June 2019.
- ↑ Economic Survey 2010, p. 180.
- ↑ Datt & Sundharam 2009, pp. 499–501
- ↑ The Government of Punjab (2004). Human Development Report 2004, Punjab (PDF) (Report). Archived (PDF) from the original on 8 July 2011. Retrieved 9 August 2011. Section: "The Green Revolution", pp. 17–20.
- ↑ "India – Land and Water Resources at a glance". Central Water Commission, Government of India. Archived from the original on 19 November 2010. Retrieved 18 November 2010.
- ↑ 186.0 186.1 "State-Wise Details of Net Irrigated Area (NIA), Net Sown Area (NSA) And Percentage of NIA To NSA" (PDF). Ministry of Water Resources, Government of India. Archived from the original (PDF) on 21 July 2011. Retrieved 18 November 2010.
- ↑ "Fishery – Global Comparison". Archived from the original on 14 September 2016. Retrieved 9 October 2015.
- ↑ 188.0 188.1 "Cashew industry : Challenges and Opportunities" (PDF). Archived (PDF) from the original on 28 May 2016. Retrieved 22 March 2016.
- ↑ "Economist – Global livestock counts". Archived from the original on 15 July 2016. Retrieved 9 October 2015.
- ↑ "Major Food And Agricultural Commodities And Producers – Countries By Commodity". FAO. Archived from the original on 28 March 2012. Retrieved 12 December 2009.
- ↑ "Rise in earnings from cashew kernel exports – The Hindu". Archived from the original on 7 January 2020. Retrieved 22 March 2016.
- ↑ "Govt eyes bumper agriculture production on good monsoon hopes". Archived from the original on 15 June 2016. Retrieved 22 June 2016.
- ↑ Foreign Trade Performance of India Annual Report Archived 26 July 2014 at the Wayback Machine Directorate General of Commercial Intelligence and Statistics, Ministry of Commerce and Industry, Government of India (2012)
- ↑ Sengupta, Somini (22 June 2008). "The Food Chain in Fertile India, Growth Outstrips Agriculture". The New York Times. Archived from the original on 12 May 2011. Retrieved 29 March 2010.
- ↑ "India: Priorities for Agriculture and Rural Development". World Bank. Retrieved 8 January 2011.
- ↑ Panagariya 2008, p. 318
- ↑ Datt & Sundharam 2009, p. 502
- ↑ "Agriculture production to double with Rs 80000 crore irrigation scheme, others: Nitin Gadkari". Daily News and Analysis. Archived from the original on 7 May 2017. Retrieved 22 June 2016.
- ↑ 199.0 199.1 "India's Food Transportation Ordeal". The Wall Street Journal. 11 January 2013. Archived from the original on 22 April 2017. Retrieved 13 March 2017.
- ↑ 200.0 200.1 "India – All Economic Indicators on Quandl". Archived from the original on 7 January 2013. Retrieved 8 October 2013.
- ↑ GDP and its breakdown at current prices in US Dollars Archived 21 January 2018 at the Wayback Machine United Nations Statistics Division (2013)
- ↑ GDP and its breakdown at constant 2005 prices in US Dollars Archived 21 January 2018 at the Wayback Machine United Nations Statistics Division (2013)
- ↑ "FDI reforms to push India-US trade: USIBC". 21 August 2016. Archived from the original on 21 August 2016.
- ↑ Task Force Report 2006, pp. 9–10.
- ↑ Kumar 2005, pp. 1040–1041
- ↑ "Industrial Regions in India". Jagranjosh.com. 28 November 2018. Archived from the original on 26 February 2022. Retrieved 5 March 2022.
- ↑ "BP Statistical Review of World Energy June 2019" (PDF). Archived (PDF) from the original on 26 December 2019. Retrieved 10 September 2019.
- ↑ "World Crude Steel Production" (PDF). WorldSteel. 2 January 2019. Archived from the original (PDF) on 2 February 2019. Retrieved 1 February 2019.
- ↑ "Top 15 Fertilizer Companies in India: Nurturing Agricultural Growth". 8 June 2023. Archived from the original on 17 August 2023. Retrieved 17 August 2023.
- ↑ "India gains global prominence in agrochemicals export". sundayguardianlive.com. 28 May 2023. Archived from the original on 28 July 2023. Retrieved 28 July 2023.
- ↑ S. Saini, P. "India Emerges as Global Powerhouse in Agrochemical Exports, Setting New Industry Standards". krishijagran.com. Archived from the original on 28 July 2023. Retrieved 28 July 2023.
- ↑ "Ministry wise Summary of Budget Provisions, 2022–23" (PDF). Ministry of Finance, Government of India. Archived (PDF) from the original on 2 February 2022. Retrieved 3 February 2022.
- ↑ Pandit, Rajat (16 March 2021). "India's weapon imports fell by 33% in last five years but remains world's second-largest arms importer". The Times of India. Archived from the original on 7 June 2023. Retrieved 26 April 2022.
- ↑ "India's defence exports reach ₹15,920 cr in 2022–23, tenfold jump in 6 years". April 2023. Archived from the original on 12 April 2023. Retrieved 13 April 2023.
- ↑ "BP Statistical Review 2016" (PDF). Archived from the original (PDF) on 20 October 2016. Retrieved 29 May 2016.
- ↑ 216.0 216.1 "CIA – The World Factbook – India". CIA. 20 September 2007. Archived from the original on 18 March 2021. Retrieved 2 October 2007.
- ↑ Datt & Sundharam 2009, p. 104
- ↑ 218.0 218.1 "Indian Petroleum & Natural Gas Statistics, 2014–15" (PDF). Archived from the original (PDF) on 5 December 2014. Retrieved 19 January 2016.
- ↑ "Reliance Net Beats Estimate After Boosting Natural Gas Sales". Bloomberg BusinessWeek. 27 January 2010. Archived from the original on 15 September 2011. Retrieved 5 April 2010.
- ↑ "BP Statistical Review of world electric energy, 2015" (PDF). Archived from the original (PDF) on 4 July 2015. Retrieved 17 June 2015.
- ↑ "Vidyut Pravah – See FAQ section for more information". Archived from the original on 13 October 2016. Retrieved 3 June 2016.
- ↑ "All India Installed Capacity (In MW) Of Power Stations" (PDF). Archived from the original (PDF) on 5 July 2016. Retrieved 9 June 2016.
- ↑ "Inventory of Coal Resources of India". Ministry of Coal, Government of India. Archived from the original on 19 April 2010. Retrieved 18 November 2010.
- ↑ "Uranium shortage holding back India's nuclear power drive". Mint. 30 June 2008. Archived from the original on 3 December 2010. Retrieved 5 April 2010.
- ↑ Subramanian, T. S. (20 March 2011). "Massive uranium deposits found in Andhra Pradesh". The Hindu. Chennai, India. Archived from the original on 24 October 2012. Retrieved 19 February 2014.
- ↑ Thakur, Monami (19 July 2011). "Massive uranium deposits found in Andhra Pradesh". International Business Times. US. Archived from the original on 18 October 2017. Retrieved 19 February 2014.
- ↑ Bedi, Rahul (19 July 2011). "Largest uranium reserves found in India". The Telegraph. New Delhi, India. Archived from the original on 10 January 2022.
- ↑ "Availability of Thorium". Press Information Bureau, Government of India. 10 August 2011. Archived from the original on 10 September 2012. Retrieved 27 March 2012.
- ↑ "Bush signs India-US nuclear deal into law". Mint. 9 October 2008. Archived from the original on 20 July 2020. Retrieved 5 April 2010.
- ↑ News Desk, RailPost (22 February 2022). "Indian Railways Revises FY23 Rolling Stock Production Plan, Will Boost Output To 8,000+ Coaches". RailPost.in. Archived from the original on 11 July 2023. Retrieved 11 July 2023.
- ↑ "Race on to Meet Vande Bharat Targets". 10 March 2023. Archived from the original on 23 June 2023. Retrieved 23 June 2023.
- ↑ "Archived copy". Archived from the original on 29 September 2023. Retrieved 25 September 2023.
{{cite web}}: CS1 maint: archived copy as title (link) - ↑ "Mission Electrification to save railways power bill by Rs 10K crore". The New Indian Express. 4 November 2016. Archived from the original on 11 April 2023. Retrieved 18 April 2023.
- ↑ "Railways on track to meet target of 100% electrification by Dec". Archived from the original on 6 October 2023. Retrieved 4 October 2023.
- ↑ "DFC – as revolutionary as the Golden Quadrilateral" (PDF). Indian Railways. Archived (PDF) from the original on 6 March 2016. Retrieved 13 September 2016.
- ↑ "Dedicated Freight Corridors: Paradigm Shift Coming in Indian Railways' Freight Operations". Press Information Bureau. Archived from the original on 3 January 2017. Retrieved 13 September 2016.
- ↑ Jacob, Nidhi (31 December 2020). "Did Atal Bihari Vajpayee First Launch The Delhi Metro ?". factchecker.in. Archived from the original on 3 July 2023. Retrieved 3 July 2023.
- ↑ "Metro corridors in tier-II cities led to 8-10% increase in land prices: JLL". 27 June 2022. Archived from the original on 16 April 2023. Retrieved 23 June 2023.
- ↑ Engineering industry of India Archived 15 July 2014 at the Wayback Machine IBEF, Ministry of Commerce and Industry, Government of India (April 2014)
- ↑ "Making a case for higher engineering exports". The Financial Express. 24 July 2014. Retrieved 25 July 2014.
{{cite news}}: CS1 maint: deprecated archival service (link) - ↑ www.ETAuto.com. "India surpasses Japan to become 3rd largest auto market globally, Auto News, ET Auto". ETAuto.com. Archived from the original on 29 May 2023. Retrieved 11 January 2023.
- ↑ 2018 Production Statistics Archived 2 December 2020 at the Wayback Machine, Organisation Internationale des Constructeurs d'Automobiles
- ↑ "Automobile Industry in India, Indian Automobile Industry, Sector, Trends, Statistics". www.ibef.org. Archived from the original on 24 February 2021. Retrieved 30 August 2019.
- ↑ 244.0 244.1 244.2 Engineering industry of India Archived 28 July 2014 at the Wayback Machine MECCANICA AND BENI STRUMENTALI, Government of Italy (2013)
- ↑ "Indian Railways' MCF, Raebareli sets record of manufacturing 10,000 coaches; PM Modi lauds milestone". 5 May 2023. Archived from the original on 23 June 2023. Retrieved 23 June 2023.
- ↑ Global Tractor Market Analysis Available to AEM Members from Agrievolution Alliance Archived 8 December 2015 at the Wayback Machine Association of Equipment Manufacturers, Milwaukee, Wisconsin, US (2014)
- ↑ "India replaces Japan as second top steel producer: Worldsteel – ET Auto". Archived from the original on 11 April 2023. Retrieved 13 April 2023.
- ↑ "Archived copy". Archived from the original on 1 June 2023. Retrieved 16 October 2023.
{{cite web}}: CS1 maint: archived copy as title (link) - ↑ "India wants to build 12 new steel plants — News — GMK Center". Archived from the original on 12 April 2023. Retrieved 13 April 2023.
- ↑ Agarwal, Mehak. "Steel industry can steer India towards $5 tn economy by 2025: EY-CII report". businesstoday.in. Archived from the original on 7 July 2023. Retrieved 6 July 2023.
- ↑ "B2B commerce GMV to hit $125 billion by 2027: Avendus". 12 April 2023. Archived from the original on 6 May 2023. Retrieved 5 July 2023.
- ↑ "Unicorn Health Check | India's B2B e-commerce startups sees 3-6x growth". 29 March 2023. Archived from the original on 17 April 2023. Retrieved 5 July 2023.
- ↑ "Airtel Executive Says 5G will Make More B2B Revenues than B2C Soon". Archived from the original on 11 June 2023. Retrieved 5 July 2023.
- ↑ "Government e Marketplace procurement crosses Rs 2 lakh-crore mark". 2 April 2023. Archived from the original on 12 April 2023. Retrieved 5 July 2023.
- ↑ 255.0 255.1 255.2 India's gem and Jewellery Sector Archived 28 August 2013 at the Wayback Machine Dun and Bradstreet (2012)
- ↑ Consumer demand for gold up 53% in Q2 2013 led by strong growth in China and India Archived 2 April 2015 at the Wayback Machine World Gold Council (August 2013)
- ↑ Gems and Jewellery Industry in India Archived 8 August 2013 at the Wayback Machine IBEF, Ministry of Commerce and Industry, Government of India (2013)
- ↑ Khanna, Pankaj. "How Gems & Jewellery Sector Plays A Significant Role In The Indian Economy". BW Businessworld. Archived from the original on 26 November 2018. Retrieved 26 November 2018.
- ↑ Oppi Untracht (1997), Traditional jewellery of India, ISBN 978-0810938861, pp 1–23
- ↑ Indian diamond cutting and polishing sector Archived 3 February 2015 at the Wayback Machine Rough and Polished (6 March 2013)
- ↑ 261.0 261.1 "Basic Road Statistics of India 2013–14 and 2014–15". Ministry of Road Transport & Highways. Archived from the original on 11 February 2018. Retrieved 12 November 2016.
- ↑ "India Transport Sector". World Bank. Archived from the original on 19 November 2015. Retrieved 29 November 2016.
- ↑ "National Highway Development Project (NHDP)". NHAI, Ministry of Roads Transport, Govt of India. July 2014. Archived from the original on 15 May 2016.
- ↑ "Annual report 2010–2011". Ministry of Road transport and highways. Archived from the original on 24 January 2012. Retrieved 7 February 2012.
- ↑ India Infrastructure Summit 2012 Ernst & Young (2013), pp 4 Archived 27 July 2014 at the Wayback Machine
- ↑ Ports Archived 21 August 2014 at the Wayback Machine Business Resources, Govt of India (2013)
- ↑ Airports Archived 18 June 2014 at the Wayback Machine AAI, Govt of India (2013)
- ↑ LIST OF LICENSED AERODROME Archived 26 September 2019 at the Wayback Machine Directorate General of Commercial Aviation, Govt of India (May 2014)
- ↑ Top ten large oil refineries Archived 11 July 2014 at the Wayback Machine Hydrocarbon Technologies (September 2013)
- ↑ Indian Chemical Industry Archived 27 July 2014 at the Wayback Machine IBEF, Ministry of Commerce and Industry, Government of India (March 2014)
- ↑ Indian Chemical Industry Archived 2 November 2013 at the Wayback Machine IBEF, Ministry of Commerce and Industry, Government of India (August 2013)
- ↑ "Chemicals Industry and Exports". ibef.org. Archived from the original on 13 January 2021. Retrieved 22 June 2020.
- ↑ "Pro-growth environment pays off for Indian chemical companies | KPMG Belgium". KPMG. 13 March 2018. Archived from the original on 15 August 2019. Retrieved 15 August 2019.
- ↑ "Chemical industry may reach USD 304 billion by FY25: Report". The Economic Times. 7 October 2018. Archived from the original on 15 August 2019. Retrieved 15 August 2019.
- ↑ 275.0 275.1 India Brand Equity Foundation. "Pharmaceuticals" (PDF). Archived (PDF) from the original on 19 April 2020. Retrieved 29 May 2020.
- ↑ "Pharmaceuticals". investindia.gov.in. Archived from the original on 16 June 2020. Retrieved 29 May 2020.
- ↑ 277.0 277.1 "Medical tourism to keep pharma industry in good health: Study". dna. 20 February 2017. Archived from the original on 21 February 2017. Retrieved 20 February 2017.
- ↑ "Indian Pharmaceutical Industry". ibef.org. Archived from the original on 11 April 2020. Retrieved 22 June 2019.
- ↑ Gujarat Pharma Industry Archived 21 April 2015 at the Wayback Machine KPMG (2010)
- ↑ "Textile Industry in India: Latest facts, figures and government schemes". India Today. Archived from the original on 27 January 2019. Retrieved 27 January 2019.
- ↑ "Textile Industry & Market Growth in India". ibef.org. Archived from the original on 7 May 2019. Retrieved 22 June 2019.
- ↑ "Helping Tirupur emerge as a leader in knitwear exports in India". The Hindu. Chennai. 11 June 2007. Archived from the original on 28 November 2007. Retrieved 17 January 2011.
- ↑ "Textile Industry in India, Indian Textile Industry, Garment Industry". IBEF, Govt of India. Archived from the original on 2 October 2016. Retrieved 12 April 2014.
- ↑ Neal, John (23 February 2014). "The task of protecting India's child cotton pickers". BBC. Archived from the original on 24 February 2014. Retrieved 23 February 2014.
- ↑ "Top Paper Companies in India". papermart.in. 31 May 2010. Archived from the original on 12 February 2019. Retrieved 8 August 2018.
- ↑ "India beats China in paper market growth despite dumping fears". The Financial Express. 15 January 2019. Archived from the original on 27 January 2019. Retrieved 27 January 2019.
- ↑ 287.0 287.1 Mining Archived 9 August 2014 at the Wayback Machine Chapter 15, Ministry of Statistics and Programme Implementation, Govt of India (2011)
- ↑ Emerging economies and India's mining industry Archived 27 July 2014 at the Wayback Machine Ernst & Young (2014)
- ↑ 289.0 289.1 289.2 289.3 Development of Indian Mining Industry Archived 1 July 2014 at the Wayback Machine FICCI (2012), pp 12–14
- ↑ Mining Archived 9 August 2014 at the Wayback Machine Chapter 15, Ministry of Statistics and Programme Implementation, Govt of India (2011), pp 205
- ↑ World Steel Figures in 2013 Archived 1 November 2013 at the Wayback Machine World Steel Association (2014), pp 9
- ↑ Aluminum Archived 27 April 2017 at the Wayback Machine USGS, U.S. Government (2014)
- ↑ Mines Archived 13 February 2014 at the Wayback Machine Business Knowledge Resources, Government of India (2013)
- ↑ Unlocking the Potential of the Indian Minerals Sector Archived 18 April 2014 at the Wayback Machine Ministry of Mines, Govt of India (November 2011)
- ↑ "Indian Real Estate Industry". ibef.org. Archived from the original on 15 March 2022. Retrieved 22 June 2019.
- ↑ "'India to become 3rd largest construction market in 3 years'". livemint.com. 15 April 2023. Archived from the original on 3 July 2023. Retrieved 3 July 2023.
- ↑ Datt & Sundharam 2009, pp. 668–669
- ↑ "India becomes fourth largest aviation market in the world". Media India Group. 21 April 2017. Archived from the original on 15 October 2017. Retrieved 14 October 2017.
- ↑ 299.0 299.1 299.2 299.3 "Potential and Challenges of Indian Aviation". IATA. Archived from the original on 26 November 2018. Retrieved 26 November 2018.
- ↑ Aviation, Make in India, archived from the original on 1 November 2015, retrieved 18 November 2016
- ↑ 301.0 301.1 301.2 "100 Years of Civil Aviation in India – Milestones". Archived from the original on 7 July 2017. Retrieved 18 November 2016.
- ↑ "Beginning of Aviation in India – Bharat Rakshak" (PDF). Archived from the original (PDF) on 27 February 2012.
- ↑ "Kingfisher Air nets monster jumbo". Online edition of the Financial Express. 14 June 2005. Archived from the original on 14 May 2013. Retrieved 11 June 2009.
- ↑ "High fives with $3bn Kingfisher order". Flightglobal. 16 June 2005. Archived from the original on 5 November 2012. Retrieved 11 June 2009.
- ↑ Our Bureau (22 May 2014). "GoAir sees profit for second year in a row". Business Line. Archived from the original on 1 January 2016. Retrieved 18 November 2016.
- ↑ Datt & Sundharam 2009, p. 858
- ↑ Datt & Sundharam 2009, pp. 838–839
- ↑ Ghosh, Jayati (21 July 2005). "Bank Nationalisation: The Record". Macroscan. Economic Research Foundation. Archived from the original on 23 October 2005. Retrieved 11 January 2011.
- ↑ Datt & Sundharam 2009, pp. 839–842
- ↑ Datt & Sundharam 2009, pp. 334–335
- ↑ Farrell, Diana; Susan Lund. "Reforming India's Financial System" (PDF). United Nations Public Administration Network. Archived from the original (PDF) on 3 March 2016. Retrieved 11 January 2011.
- ↑ D'Silva, Jeetha (1 September 2007). "India growth story is attracting talent from govt establishments". Mint. Archived from the original on 28 December 2010. Retrieved 11 January 2011.
- ↑ Datt & Sundharam 2009, pp. 854–855
- ↑ "Fintech revolution in India: Tech-finance collaboration has fired up entrepreneurs". The Financial Express. 23 May 2016. Archived from the original on 26 May 2016. Retrieved 23 May 2016.
- ↑ "India emerging as fastest-growing market for fintech software products". ZDNet. 3 May 2016. Archived from the original on 27 May 2016. Retrieved 22 May 2016.
- ↑ 316.0 316.1 "Indian IT-BPO Industry". NASSCOM. Archived from the original on 20 December 2012. Retrieved 15 December 2012.
- ↑ "indian iT and BPM Industry Analysis Presentation Industry Report". Archived from the original on 2 July 2022. Retrieved 17 June 2022.
- ↑ Mitra, Sramana (29 February 2008). "The Coming Death of Indian Outsourcing". Forbes. Archived from the original on 3 March 2008. Retrieved 10 January 2010.
- ↑ Sheth, Niraj (28 May 2009). "Outlook for Outsourcing". The Wall Street Journal. Archived from the original on 24 March 2021. Retrieved 5 April 2010.
- ↑ 320.0 320.1 320.2 "India's outsourcing revenue to hit $50 bn". The Financial Express. 2008. Archived from the original on 11 August 2014. Retrieved 18 November 2016.
- ↑ Ernst & Young, Insurance industry: Challenges, reforms and realignment Archived 17 October 2014 at the Wayback Machine India (2012)
- ↑ IBEF, Insurance Industry in India, Sectoral Presentation Archived 21 November 2016 at the Wayback Machine, Ministry of Finance, Government of India (October 2014)
- ↑ 323.0 323.1 IBEF, Insurance Sector in India Archived 21 December 2016 at the Wayback Machine April 2014 Industry Report
- ↑ "Insurance penetration in India grows just 1% in last one and half decade; These six charts explain why". Firstpost. 25 January 2019. Archived from the original on 27 January 2019. Retrieved 27 January 2019.
- ↑ Arpita Mukherjee; Tanu M. Goyal (April 2012). "Employment Conditions in Organised and Unorganised Retail: Implications for FDI Policy in India". Journal of Business and Retail Management Research. 6 (2). doi:10.24052/JBRMR/97 ( (inactive $1) 1 August 2023).
{{cite journal}}: CS1 maint: DOI inactive as of August 2023 (link) - ↑ Dikshit, Anand (12 August 2011). "The Uneasy Compromise – Indian Retail". The Wall Street Journal. Archived from the original on 30 April 2022. Retrieved 30 April 2022.
- ↑ "Retail Industry in India – Indian Retail Sector, Market Size". Archived from the original on 9 May 2022. Retrieved 30 April 2022.
- ↑ NASSCOM press release Archived 30 April 2022 at the Wayback Machine NASSCOM. 8 March 2021. Retrieved 29 November 2022
- ↑ "Winning the Indian consumer". McKinsey & Company. 2005. Archived from the original on 26 January 2013. Retrieved 28 June 2012.
- ↑ Majumder, Sanjoy (25 November 2011). "Changing the way Indians shop". BBC News. Archived from the original on 1 November 2018. Retrieved 22 June 2018.
- ↑ The Indian Kaleidoscope – Emerging trends in retail Archived 28 February 2013 at the Wayback Machine PWC (2012)
- ↑ Successful Innovations in Indian Retail Archived 8 August 2014 at the Wayback Machine Booz Allen & PwC (February 2013)
- ↑ "Retail industry in India". ibef.org. Archived from the original on 21 February 2021. Retrieved 22 June 2019.
- ↑ "Market Realist". marketrealist.com. 7 January 2019. Archived from the original on 28 January 2019. Retrieved 27 January 2019.
- ↑ 335.0 335.1 "Retailing in India: Unshackling the chain stores". The Economist. 29 May 2008. Archived from the original on 6 October 2008. Retrieved 10 January 2010.
- ↑ Sharma, Amol; Mukherji, Biman (12 January 2013). "Bad Roads, Red Tape, Burly Thugs Slow Wal-Mart's Passage in India". The Wall Street Journal. Archived from the original on 23 April 2017. Retrieved 13 March 2017.
- ↑ "Travel & Tourism Economic Impact 2018 India" (PDF). World Travel and Tourism Council. Archived from the original (PDF) on 22 March 2018. Retrieved 22 March 2017.
- ↑ Team, BS Web (17 January 2018). "India attracted 10 mn foreign tourists in 2017, sports to bring more". Business Standard India. Archived from the original on 15 February 2018. Retrieved 11 February 2018.
- ↑ "2019 ANNUAL RESEARCH: KEY HIGHLIGHTS" (PDF). WTTC. Archived from the original (PDF) on 30 December 2019. Retrieved 15 March 2019.
- ↑ "India Tourism Statistics at a Glance 2015" (PDF). Ministry of Tourism. Archived from the original (PDF) on 10 September 2016.
- ↑ 341.0 341.1 India's tourism performance Archived 8 August 2014 at the Wayback Machine United Nations World Tourism Organization (2013)
- ↑ Yearbook of Tourism Statistics, Data 2008 – 2012, 2014 Edition Archived 1 December 2018 at the Wayback Machine United Nations World Tourism Organization (2014)
- ↑ RN Pandey, Inbound Tourism Statistics of India Archived 28 May 2016 at the Wayback Machine Ministry of Tourism, Govt of India (2012)
- ↑ Mudur, Ganapati (June 2004). "Hospitals in India woo foreign patients". British Medical Journal. 328 (7452): 1338. doi:10.1136/bmj.328.7452.1338. PMC 420282. PMID 15178611.
- ↑ "Medical Tourism draws Americans to India". The Washington Times. 18 August 2013. Archived from the original on 11 August 2014. Retrieved 30 July 2014.
- ↑ "Indian medical tourism industry to touch $8 billion by 2020: Grant Thornton – The Economic Times". The Economic Times. Archived from the original on 18 March 2017. Retrieved 16 April 2016.
- ↑ "Promotion of Medical Tourism". Press Information Bureau. Archived from the original on 11 October 2016. Retrieved 28 April 2016.
- ↑ "Archived copy" (PDF). Archived (PDF) from the original on 15 October 2023. Retrieved 13 October 2023.
{{cite web}}: CS1 maint: archived copy as title (link) - ↑ "Archived copy". Archived from the original on 17 October 2023. Retrieved 13 October 2023.
{{cite web}}: CS1 maint: archived copy as title (link) - ↑ "Archived copy". Archived from the original on 17 October 2023. Retrieved 13 October 2023.
{{cite web}}: CS1 maint: archived copy as title (link) - ↑ "Archived copy". Archived from the original on 17 October 2023. Retrieved 13 October 2023.
{{cite web}}: CS1 maint: archived copy as title (link) - ↑ "Archived copy". Archived from the original on 17 October 2023. Retrieved 13 October 2023.
{{cite web}}: CS1 maint: archived copy as title (link) - ↑ "Archived copy". Archived from the original on 17 October 2023. Retrieved 13 October 2023.
{{cite web}}: CS1 maint: archived copy as title (link) - ↑ "Indian ayurvedic industry to grow to $ 4.4 billion by the end of this year". The Economic Times. 19 November 2018. Archived from the original on 26 November 2018. Retrieved 26 November 2018.
- ↑ "Economic Survey 2018: 5 states show the way with 70% of exports, enjoy higher standard of living". The Indian Express. 30 January 2018. Archived from the original on 12 February 2018. Retrieved 11 February 2018.
- ↑ Chakraborty, Subhayan (29 January 2018). "Only 5 states account for 70% of exports, Economic Survey shows". Business Standard India. Archived from the original on 12 February 2018. Retrieved 11 February 2018.
- ↑ Vashistha, Praveen (18 January 2019). "Future and Growth of Transportation Market by 2020". Entrepreneur. Archived from the original on 27 January 2019. Retrieved 27 January 2019.
- ↑ "Global Rankings 2016 | Logistics Performance Index". World Bank. Archived from the original on 9 July 2017. Retrieved 11 February 2018.
- ↑ "Media and Entertainment Industry May Touch Rs 3.73 Lakh Crore by 2022: Study". News18. 27 January 2019. Archived from the original on 27 January 2019. Retrieved 27 January 2019.
- ↑ 360.0 360.1 PTI (23 June 2022). "Streaming will rake in Rs 21,000 crore by 2026, more than Indian film industry: Report". cnbctv18.com. Archived from the original on 3 July 2023. Retrieved 3 July 2023.
- ↑ "Telecom sector share in GDP marginally up at 1.94% in FY15 & Updates at Daily News & Analysis". Daily News and Analysis. 23 December 2015. Archived from the original on 11 March 2017. Retrieved 2 November 2017.
- ↑ "The Indian Telecom Services Performance Indicators January – March, 2016" (PDF). Telecom Regulatory Authority of India. 5 August 2016. Archived from the original (PDF) on 30 November 2016. Retrieved 29 November 2016.
- ↑ "Production of Crude Oil including Lease Condensate 2019" (CVS download). U.S. Energy Information Administration. Archived from the original on 27 April 2017. Retrieved 31 March 2019.
- ↑ "Indian Readership Survey 2012 Q1 : Topline Findings" (PDF). Media Research Users Council. Growth: Literacy & Media Consumption. Archived from the original (PDF) on 7 April 2014. Retrieved 12 September 2012.
- ↑ "Telecom Subscription data, May 2016" (PDF) (Press release). TRAI. 18 May 2016. Archived from the original (PDF) on 15 June 2016. Retrieved 14 July 2016.
- ↑ Dr.Priya Rawal (16 April 2015). Indian Stock Market and Investors Strategy. Dr.Priya Rawal. pp. 12–. ISBN 978-1-5053-5668-7. Archived from the original on 11 January 2023. Retrieved 23 November 2018.
- ↑ "'Modi Mania' propels India's stock market into world's top 10". Financial Times. 22 May 2014. Archived from the original on 9 November 2023. Retrieved 28 July 2014.
- ↑ "BSE Ltd. (Bombay Stock Exchange) – Live Stock Market Updates for S&P BSE SENSEX, Stock Quotes & Corporate Information". BSEIndia.com. Archived from the original on 28 January 2017. Retrieved 2 November 2017.
- ↑ "WFE". Archived from the original on 17 August 2014.
- ↑ 370.0 370.1 EY Global IPO Trends Global IPO Trends Q4 2013 Archived 24 September 2015 at the Wayback Machine Ernst & Young (2014)
- ↑ "Listing abroad sans domestic IPO set to be a reality soon". Business Standard. 28 July 2013. Archived from the original on 1 August 2017. Retrieved 28 July 2014.
- ↑ Srinivasan, T.N. (2002). "Economic Reforms and Global Integration" (PDF). Economic Growth Center, Yale University. 17 January 2002. Archived from the original (PDF) on 26 March 2009. Retrieved 21 June 2009.
- ↑ Panagariya 2008, pp. 27–29
- ↑ Datt & Sundharam 2009, pp. 747–748
- ↑ Panagariya 2008, p. 109
- ↑ 376.0 376.1 "Trade profiles-India". World Trade Organization. Archived from the original on 20 May 2016. Retrieved 7 February 2012.
- ↑ 377.0 377.1 377.2 "Human Development Index (HDI)". hdr.undp.org. HDRO (Human Development Report Office) United Nations Development Programme. Archived from the original on 15 December 2019. Retrieved 11 December 2019.
- ↑ Datt & Sundharam 2009, p. 757
- ↑ "Imports and Exports Databank". Ministry of Commerce and Industry, Government of India. Archived from the original on 22 November 2018. Retrieved 5 April 2010.
- ↑ "India's Foreign Trade: November 2010" (PDF). Press Release. Ministry of Commerce and Industry, Government of India. 3 January 2011. Archived from the original (PDF) on 24 January 2011. Retrieved 11 January 2011.
- ↑ "India & the World Trade Organization". Embassy of India. Archived from the original on 13 June 2005. Retrieved 9 July 2005.
- ↑ "India moves up to 43rd place on competitiveness; Singapore reaches top". Moneycontrol. Archived from the original on 29 May 2019. Retrieved 29 May 2019.
- ↑ Datt & Sundharam 2009, pp. 763–765
- ↑ Economic Survey 2010, pp. 127–129.
- ↑ 385.0 385.1 V. Ramakrishnan (7 December 2010). "Rupee Rally Falters as Oil Rises to Two-Year High". Bloomberg BusinessWeek. Archived from the original on 11 January 2011. Retrieved 11 January 2011.
- ↑ Economic Survey 2010, p. 127.
- ↑ 2013 Annual Report Archived 10 August 2014 at the Wayback Machine Ministry of Commerce, Govt of India (2013)
- ↑ "India's trade deficit with China mounts to $ 31.42 bn". The Economic Times. 10 January 2014. Archived from the original on 5 March 2016. Retrieved 1 August 2014.
- ↑ Economic Survey 2010, pp. 142–144.
- ↑ "Master Circular on External Commercial Borrowings and Trade Credits" (PDF). Reserve Bank of India. Archived (PDF) from the original on 17 September 2012. Retrieved 11 January 2011.
- ↑ Economic Survey 2010, p. 132.
- ↑ "UK to end financial aid to India". Financial Times. 9 November 2012. Archived from the original on 9 November 2023. Retrieved 1 August 2014.
- ↑ "TABLE-India's forex reserves rise to $318.64 bln as of Aug 29 – cbank". Reuters. 5 September 2014. Archived from the original on 10 December 2015. Retrieved 3 March 2015.
- ↑ Nag, Anirban (27 March 2017). "Foreigners to the rescue as inflows rise to bridge India's current account deficit". Mint. Archived from the original on 5 April 2017. Retrieved 4 April 2017.
- ↑ Nayak, Gayatri. "In a first since 1991, FDI flow takes care of CAD". The Economic Times. Archived from the original on 5 April 2017. Retrieved 4 April 2017.
- ↑ "FDI in India Statistics" (PDF). Ministry of Commerce and Industry, Government of India. Archived from the original (PDF) on 22 November 2010. Retrieved 22 November 2010.
- ↑ 397.0 397.1 "India 2nd best country for biz investment: Survey". The Financial Express. Archived from the original on 5 July 2009. Retrieved 3 November 2008.
- ↑ "FinMin considers three single-brand retail FDI proposals". Archived from the original on 21 October 2012.
- ↑ "Next Big Spenders: India's Middle Class". McKinsey & Company. Archived from the original on 16 November 2011. Retrieved 5 April 2010.
- ↑ Ramachandran, Sushma (25 February 2005). "100 per cent FDI in construction industry automatic route". The Hindu. Chennai, India. Archived from the original on 5 April 2005. Retrieved 17 December 2010.
- ↑ "Govt unleashes big-bang FDI reforms, opens up defence". The Times of India. 17 July 2014. Archived from the original on 6 January 2018. Retrieved 1 August 2014.
- ↑ "Govt allows FDI multi-brand retail, aviation in bold reform push". Reuters. 14 September 2012. Archived from the original on 10 June 2020. Retrieved 6 July 2021.
- ↑ "India FDI Fact sheet – September 2010". Department of Industrial Policy & Promotion, Ministry of Commerce and Industry. Archived from the original on 16 December 2010. Retrieved 21 December 2010.
- ↑ Bhagwati, Jaimini (17 December 2010). "Rationalising FDI taxes". Business Standard. Archived from the original on 9 November 2023. Retrieved 21 December 2010.
- ↑ "India's FDI inflows at a record $60.1 billion in 2016–17". Hindustan Times. 19 May 2017. Archived from the original on 21 October 2017. Retrieved 2 November 2017.
- ↑ "FDI jumps 37% to $10.4 billion during April–June 2017". The Economic Times. 21 August 2017. Archived from the original on 27 September 2017. Retrieved 2 November 2017.
- ↑ Shah and Patnaik, India's financial globalisation Archived 4 March 2016 at the Wayback Machine IMF (2012)
- ↑ "Mahindra Expands Effort to Counter Global Rivals with U.S. Engineering". The Wall Street Journal. 9 May 2014. Archived from the original on 15 March 2016. Retrieved 13 March 2017.
- ↑ "A Slice of World Action". Business Today. 11 November 2012. Archived from the original on 8 August 2014. Retrieved 1 August 2014.
- ↑ "India's industrial outpost Tata for now". The Economist. 10 September 2011. Archived from the original on 28 May 2017. Retrieved 1 August 2014.
- ↑ "JLR's Ratan Tata warns on UK competitiveness". The Telegraph. 5 December 2012. Archived from the original on 10 January 2022.
- ↑ "Remittance Flows Worldwide in 2015". PewGlobal.org. 31 August 2016. Archived from the original on 25 April 2017. Retrieved 2 November 2017.
- ↑ "M&A Statistics by Countries". Institute for Mergers, Acquisitions and Alliances (IMAA). Archived from the original on 27 November 2020. Retrieved 26 February 2018.
- ↑ RBI Handbook of Statistics on Indian Economy
- ↑ "1 GBP to INR in 1947 till Now, Historical Exchange Rates Explained". Blog-Best Foreign Exchange. 28 December 2018. Archived from the original on 28 October 2021. Retrieved 28 October 2021.
- ↑ "Yearly Average Currency Exchange Rates | Internal Revenue Service". www.irs.gov. Archived from the original on 21 May 2017. Retrieved 11 September 2020.
- ↑ "Your Guide to Money Matters". Reserve Bank of India. Archived from the original on 16 January 2011. Retrieved 11 January 2011.
- ↑ Datt & Sundharam 2009, p. 812
- ↑ Datt & Sundharam 2009, pp. 887–888
- ↑ Datt & Sundharam 2009, p. 822
- ↑ International Monetary Fund (1996), 1996 Annual Report on Exchange Arrangements & Exchange Restrictions at Google Books, pages 224–226
- ↑ USD INR Archived 11 July 2016 at the Wayback Machine Currency Conversion Rates, Yahoo
- ↑ Vora, Nimesh (7 September 2023). "With Indian rupee near record low, cenbank steps up NDF intervention". Reuters. Archived from the original on 7 October 2023. Retrieved 7 October 2023.
- ↑ "World Economic Outlook Database, October 2020". World Economic Outlook. International Monetary Fund. October 2020. Archived from the original on 15 October 2020. Retrieved 13 October 2020.
- ↑ "GINI index (World Bank estimate) | Data". World Bank. Archived from the original on 12 July 2016. Retrieved 23 July 2020.
- ↑ "Homes become more affordable in last 10 years". The Times of India. 2 May 2012. Archived from the original on 10 May 2013.
- ↑ "Poverty reduction and equity (2010)". World Bank. July 2012. Archived from the original on 20 July 2012. Retrieved 11 July 2012.
- ↑ Table 3.4, World Consumer Income and Expenditure Patterns – Annual Household Income Archived 5 July 2016 at the Wayback Machine Euro Monitor International (2013)
- ↑ 429.0 429.1 "Final Figures of Houselisting & Housing Census, 2011 Released". Census 2011, Government of India. 13 March 2012. Archived from the original on 12 October 2016. Retrieved 10 July 2012.
- ↑ "Median household size drops below 4 in cities". The Times of India. 25 March 2012. Archived from the original on 6 September 2012.
- ↑ "Country Report – India (2010)". The World Bank. 2011. Archived from the original on 29 June 2012. Retrieved 10 July 2012.
- ↑ Sinha, Prabhakar (1 August 2010). "India has more rich people than poor now". The Times of India. Archived from the original on 12 June 2013. Retrieved 15 November 2010.
- ↑ Table 2.9 of World Development Indicators: Distribution of income or consumption Archived 23 September 2014 at the Wayback Machine The World Bank
- ↑ "India 6th wealthiest country with total wealth of $8,230 billion". livemint.com/. 30 January 2018. Archived from the original on 19 February 2018. Retrieved 18 February 2018.
- ↑ 435.0 435.1 435.2 "Global Wealth Migration Review". issuu.com. New World Wealth. April 2019. Archived from the original on 27 December 2019. Retrieved 12 June 2019.
- ↑ "'Mumbai richest Indian city with total wealth of $820 bn' – The Economic Times". The Economic Times. Archived from the original on 26 February 2017. Retrieved 26 February 2017.
- ↑ "Mumbai richest Indian city with total wealth of $820 billion: Report". Hindustan Times. 26 February 2017. Archived from the original on 26 February 2017. Retrieved 26 February 2017.
- ↑ "India's millionaires are fleeing from homeland – and these are the countries where they are headed". Business Insider. Archived from the original on 26 August 2019. Retrieved 12 June 2019.
- ↑ Note: 24.6% rate is based on 2005 PPP at $1.25 per day, International dollar basis, The World Bank (2015). A measured approach to ending poverty and boosting shared prosperity (PDF). World Bank Group. p. 50. ISBN 978-1-4648-0361-1. Archived (PDF) from the original on 9 October 2016. Retrieved 1 February 2015.
- ↑ Nutrition Archived 20 December 2014 at the Wayback Machine, Fast Facts, UNICEF (2009)
- ↑ "India Statistics". UNICEF, United Nations. 2011. Archived from the original on 25 December 2018. Retrieved 10 July 2012.
- ↑ "Economic Survey 2004–2005". Archived from the original on 16 December 2007. Retrieved 15 July 2006.
- ↑ Panagariya 2008, p. 146
- ↑ Tom Wright; Harsh Gupta (29 April 2011). "India's Boom Bypasses Rural Poor". The Wall Street Journal. Archived from the original on 16 July 2017. Retrieved 3 August 2017.
- ↑ "India rural welfare – Digging holes". The Economist. 5 November 2011. Archived from the original on 9 June 2012. Retrieved 18 August 2012.
- ↑ James Fontanella-Khan; James Lamont (29 February 2012). "Rural India enjoys consumption boom". Financial Times. Archived from the original on 9 November 2023. Retrieved 18 August 2012.
- ↑ Sarkar & Kumar (2011), Impact of MGNREGA on Reducing Rural Poverty and Improving Socio-economic Status of Rural Poor: A Study in Burdwan District of West Bengal Archived 9 November 2023 at the Wayback Machine, Agricultural Economics Research Review, Vol 24
- ↑ Swain & Ray (2013), Social welfare through guaranteed wage employment: experience of National Rural Employment Guarantee Scheme in an Indian state, Journal of International and Comparative Social Policy, 29(1), 79–90
- ↑ Aggarwal & Kumar (November 2012), Structural change, industrialization and poverty reduction: the case of India Archived 27 November 2013 at the Wayback Machine, in United Nation's UNIDO workshop "The Untold Story: Structural Change for Poverty Reduction–The Case of the BRICS", Vienna, 16–17 August (pp 1–68)
- ↑ Kotwal, Ramaswami & Wadhwa (2011), Economic liberalization and Indian economic growth: What's the evidence?, Journal of Economic Literature, Vol. 49, No. 4, 1152–1199
- ↑ "India lifted 271 million people out of poverty in 10 years: UN". The Hindu. Archived from the original on 14 July 2019. Retrieved 14 July 2019.
- ↑ 452.0 452.1 "Report on Employment & Unemployment Survey (2012–13)" (PDF). Bureau of Labour Statistics, Indian Government. January 2014. Archived from the original (PDF) on 1 August 2014. Retrieved 25 July 2014.
- ↑ Datt & Sundharam 2009, pp. 423–424
- ↑ Desai, Sonalde, Amaresh Dubey, B.L. Joshi, Mitali Sen, Abusaleh Shariff and Reeve Vanneman (201) India Human Development in India: Challenges for a Society in Transition Archived 8 February 2016 at the Wayback Machine, Oxford University Press, page 40-44
- ↑ Economic Survey 2010, pp. 275–277.
- ↑ Datt & Sundharam 2009, pp. 434–436
- ↑ Datt & Sundharam 2009, p. 431
- ↑ Kaushik Basu (27 June 2005). "Why India needs labour law reform". BBC. Archived from the original on 25 December 2018. Retrieved 16 December 2010.
- ↑ Datt & Sundharam 2009, p. 434
- ↑ Drèze & Sen 1996, p. 39
- ↑ "Child Labour and India". Embassy of India. Archived from the original on 23 October 2007. Retrieved 13 March 2009.
- ↑ Drèze & Sen 1996, pp. 130–131
- ↑ Desai, Sonalde, Amaresh Dubey, B.L. Joshi, Mitali Sen, Abusaleh Shariff and Reeve Vanneman (201) India Human Development in India: Challenges for a Society in Transition Archived 8 February 2016 at the Wayback Machine, Oxford University Press, page 131
- ↑ "Population of Overseas Indians". www.mea.gov.in. Archived from the original on 7 October 2023. Retrieved 7 October 2023.
- ↑ Leone Lakhani, Dubai's expat Indians: The world's most productive foreign workers Archived 24 March 2017 at the Wayback Machine CNN (19 May 2014)
- ↑ Banerjee, Ajay (9 January 2011). "NRIs don't invest as much as they remit, says Montek". The Tribune. India. Archived from the original on 4 March 2016. Retrieved 13 January 2011.
- ↑ "Table 1: Aggregate data on membership of CTUOs 1989 to 2002 (Provisional)" (PDF). labourfile.org. Archived from the original (PDF) on 3 October 2011.
- ↑ Sengupta, Meghna. "Trade Unions in India". Pocket Lawyer. Archived from the original on 16 November 2017. Retrieved 15 November 2017.
- ↑ Datta, Rekah. "From Development to Empowerment: The Self-Employed Women's Association in India". International Journal of Politics, Culture, and Society.
- ↑ Chand, Smriti (17 February 2014). "6 Major Central Trade Unions of India". Your Article Library. Archived from the original on 29 June 2022. Retrieved 15 November 2017.
- ↑ India: Potential for a Parliamentary Budget Office Archived 3 June 2018 at the Wayback Machine. Social Science Research Network (SSRN). Retrieved 18 July 2017.
- ↑ 472.0 472.1 Transparency International India. "India Corruption Study 2005" (PDF). Centre for Media Studies. Archived from the original (PDF) on 15 April 2007. Retrieved 14 March 2008.
- ↑ "India Corruption Study – 2008" (PDF). Transparency International. 2008. Archived from the original (PDF) on 19 June 2012. Retrieved 15 July 2012.
- ↑ "Corruption Perceptions Index 2011". Transparency International. Archived from the original on 20 November 2012. Retrieved 9 July 2012.
- ↑ e.V., Transparency International. "Corruption Perceptions Index 2016". transparency.org. Archived from the original on 25 January 2017. Retrieved 18 February 2018.
- ↑ Drèze & Sen 1996, p. 180
- ↑ "Survey on Bribery and Corruption – Impact on Economy and Business Environment" (PDF). KPMG. 2011. Archived (PDF) from the original on 6 May 2016. Retrieved 15 July 2012.
- ↑ Debroy and Bhandari (2011). "Corruption in India". The World Finance Review. Archived from the original on 1 May 2014. Retrieved 15 July 2012.
- ↑ "Corruption in India – A rotten state". The Economist. 10 March 2011. Archived from the original on 18 August 2012. Retrieved 15 July 2012.
- ↑ "India's civil service: Battling the babu raj". The Economist. 6 March 2008. Archived from the original on 30 May 2008. Retrieved 8 January 2011.
- ↑ Muralidharan, Karthik. "Teachers and Medical Worker Incentives in India" (PDF). University of California. Archived from the original (PDF) on 26 March 2009. Retrieved 21 June 2009.
- ↑ Basu, Kaushik (29 November 2004). "Combating India's truant teachers". BBC. Archived from the original on 15 February 2009. Retrieved 9 January 2011.
- ↑ Jayaraman, K.S. (9 November 2009). "Report row ousts top Indian scientist". Nature. 462 (7270): 152. doi:10.1038/462152a. PMID 19907467.
- ↑ Kuldip Nayar (4 February 2011). "Laundering black money". Deccan Herald. India. Archived from the original on 23 September 2015. Retrieved 6 February 2011.
- ↑ V. Venkateswara Rao (13 August 2010). "Black, bold and bountiful". Business Line. Archived from the original on 18 September 2011. Retrieved 6 February 2011.
- ↑ "No 'black money' statistics exist: Swiss banks". The Times of India. 13 September 2009. Archived from the original on 12 September 2011.
- ↑ "Banking secrecy spices up Indian elections". SWISSINFO – A member of Swiss Broadcasting Corporation. 14 May 2009. Archived from the original on 26 September 2013. Retrieved 28 June 2012.
- ↑ "Understanding India's Economic Slowdown". The India Forum. 20 January 2020. Archived from the original on 11 June 2022. Retrieved 14 June 2022.
- ↑ "Education in India". World Bank. Retrieved 13 January 2011.
- ↑ Economic Survey 2010, pp. 280–281.
- ↑ "A special report on India: An elephant, not a tiger". The Economist. 11 December 2008. Archived from the original on 25 December 2018. Retrieved 17 January 2011.
- ↑ Drèze & Sen 1996, pp. 114–115
- ↑ Ranking of states and union territories by lireacy rate: 2011 Archived 6 July 2015 at the Wayback Machine Census of India, Ministry of Home Affairs, Government of India (2013)
- ↑ "India Country Overview 2013". World Bank. 2014. Archived from the original on 2 May 2017. Retrieved 28 July 2014.
- ↑ Datt & Sundharam 2009, pp. 474–475
- ↑ "Country Strategy for India (CAS) 2009–2012" (PDF). World Bank. Archived from the original (PDF) on 14 January 2009. Retrieved 21 June 2009.
- ↑ Drèze & Sen 1996, pp. 45–46
- ↑ "Southern states to contribute 35% of India's $7 trillion economy by 2030". The Times of India. 9 June 2023. ISSN 0971-8257. Archived from the original on 6 September 2023. Retrieved 6 September 2023.
- ↑ Panagariya 2008, pp. 164–165
- ↑ Sachs, D. Jeffrey; Bajpai, Nirupam; Ramiah, Ananthi (2002). "Understanding Regional Economic Growth in India" (PDF). Working paper 88. Harvard University. Archived from the original (PDF) on 1 July 2007.
- ↑ Kurian, N.J. "Regional disparities in india". Planning Commission of India. Archived from the original on 5 November 2018. Retrieved 6 August 2005.
- ↑ 502.0 502.1 Datt & Ravallion (2011), Has India's economic growth become more pro-poor in the wake of economic reforms?, The World Bank Economic Review, 25(2), pp 157–189
- ↑ Tripathi, Sabyasachi (December 2013), Has urban economic growth in Post-Reform India been pro-poor between 1993–94 and 2009–10? Archived 4 November 2018 at the Wayback Machine Indian Council for Research on International Economic Relations, MPRA Paper No. 52336, Ludwig Maximilians Universität München
- ↑ "New study finds incredibly high carbon pollution costs – especially for the US and India". The Guardian. 1 October 2018.
- ↑ "India may lose 3-10% GDP annually by 2100 due to climate change, says report". The Indian Express. 9 June 2021. Retrieved 1 July 2021.
- ↑ "The costs of climate change in India: a review of the climate-related risks facing India, and their economic and social costs". Overseas Development Institute. 7 June 2021. Archived from the original on 8 June 2021. Retrieved 1 July 2021.
- ↑ "External Debt of India". dea.gov.in. Archived from the original on 30 November 2022. Retrieved 29 May 2023.
- ↑ "Debt – World Bank Open Data". World Bank Open Data. Archived from the original on 30 May 2023. Retrieved 29 May 2023.
- ↑ "Debt". m.rbi.org.in. Archived from the original on 29 May 2023. Retrieved 29 May 2023.
Further reading
- Books
- Datt, Ruddar; Sundharam, K.P.M. (2009). Indian Economy. New Delhi: S. Chand Group. p. 976. ISBN 978-81-219-0298-4.
- Drèze, John; Sen, Amartya (1996). India: Economic Development and Social Opportunity. Oxford University Press. p. 292. ISBN 978-0-19-564082-3.
- Kumar, Dharma (2005). The Cambridge Economic History of India, Volume II : c. 1757–2003. New Delhi: Orient Longman. p. 1115. ISBN 978-81-250-2710-2.
- Nehru, Jawaharlal (1946). The Discovery of India. Penguin Books. ISBN 0-14-303103-1.
- Panagariya, Arvind (2008). India: The Emerging Giant. Oxford University Press. p. 514. ISBN 978-0-19-531503-5.
- Raychaudhuri, Tapan; Habib, Irfan (2004). The Cambridge Economic History of India, Volume I : c. 1200 – c. 1750. New Delhi: Orient Longman. p. 543. ISBN 978-81-250-2709-6.
- Roy, Tirthankar (2006). The Economic History of India 1857–1947. Oxford University Press. p. 385. ISBN 978-0-19-568430-8.
- Alamgir, Jalal (2008). India's Open-Economy Policy. Routledge. ISBN 978-0-415-77684-4.
- Bharadwaj, Krishna (1991). "Regional differentiation in India". In Sathyamurthy, T.V (ed.). Industry & agriculture in India since independence. Oxford University Press. pp. 189–199. ISBN 0-19-564394-1.
- Malone, David M., C. Raja Mohan, and Srinath Raghavan, eds. The Oxford handbook of Indian foreign policy (2015) excerpt Archived 15 September 2021 at the Wayback Machine pp 609–649.
- Papers and reports
- Bahl, R., Heredia-Ortiz, E., Martinez-Vazquez, J., & Rider, M. (2005). India: Fiscal Condition of the States, International Experience, and Options for Reform: Volume 1 Archived 1 December 2016 at the Wayback Machine (No. paper05141). International Center for Public Policy, Andrew Young School of Policy Studies, Georgia State University.
- "Economic reforms in India: Task force report" (PDF). University of Chicago. p. 32. Archived from the original (PDF) on 7 February 2009.
- "Economic Survey 2009–10". Ministry of Finance, Government of India. p. 294. Archived from the original on 5 December 2010. Retrieved 22 November 2010.
- Articles
- "Growth of India". Archived from the original on 15 June 2013. Retrieved 10 August 2005.
- "Milton Friedman on the Nehru/Mahalanobis Plan". Archived from the original on 31 March 2016. Retrieved 16 July 2005.
- "Infrastructure in India: Requirements and favourable climate for foreign investment". Archived from the original on 13 July 2005. Retrieved 14 August 2005.
- Bernardi, Luigi; Fraschini, Angela (2005). "Tax System And Tax Reforms in India". Polis Working Papers. Working paper n. 51. Archived from the original on 29 June 2017. Retrieved 14 November 2015.
- Centre for Media Studies (2005). India Corruption Study 2005: To Improve Governance Volume – I: Key Highlights (PDF). Transparenty International India (Report). Transparency International India. Archived from the original (PDF) on 26 March 2009. Retrieved 21 June 2009 – via PrajaNet.
- Ghosh, Jayati. "Bank Nationalisation: The Record". Macroscan. Archived from the original on 23 October 2005. Retrieved 5 August 2005.
- Gordon, Jim; Gupta, Poonam (2003). "Understanding India's Services Revolution" (PDF). A Tale of Two Giants: India's and China's Experience with Reform and Growth. Archived (PDF) from the original on 26 March 2009. Retrieved 21 June 2009.
- Panagariya, Arvind (2004). "India in the 1980s and 1990s: A Triumph of Reforms". International Trade. Archived from the original on 4 March 2016. Retrieved 14 November 2015.
- Sachs, D. Jeffrey; Bajpai, Nirupam; Ramiah, Ananthi (2002). "Understanding Regional Economic Growth in India" (PDF). Center for International Development at Harvard University. Working paper 88. Archived from the original (PDF) on 1 July 2007.
- Kurian, N.J. "Regional disparities in india". Archived from the original on 5 November 2018. Retrieved 6 August 2005.
- Kaur, Ravinder (2012). "India Inc. and its Moral Discontent". Economic and Political Weekly. Archived from the original on 27 March 2023. Retrieved 10 May 2015.
- Kaur, Ravinder (2015). "Good Times, Brought to you by Brand Modi" (PDF). Archived (PDF) from the original on 20 February 2018. Retrieved 20 February 2018.
- "Country Profile: India" (PDF), Library of Congress Country Studies (5th ed.), Library of Congress Federal Research Division, December 2004, archived from the original (PDF) on 27 September 2011, retrieved 30 September 2011
- News
- Ravi S Jha. "India, the Goliath, Falls with a Thud". Archived from the original on 9 May 2013.
- "India says 21 of 29 states to launch new tax". Daily Times. 25 March 2005. Archived from the original on 16 January 2009.
- "Economic structure". The Economist. 6 October 2003. Archived from the original on 6 April 2008.a
- "Regional stock exchanges – Bulldozed by the Big Two". Retrieved 10 August 2005.[permanent dead link]
- "FinMin considers three single-brand retail FDI proposals". Archived from the original on 21 October 2012.
External links
- Ministry of Finance
- Ministry of Commerce and Industry
- Ministry of Statistics and Programme Implementation
- India profile at the CIA World Factbook
- India profile at The World Bank
- India – OECD


.jpg)


_per_capita_in_2016.png)