

Ajay Kumar (talk | contribs) Created a new article |
No edit summary |
||
| Line 1: | Line 1: | ||
{{ | {{Short description|None}} | ||
{{EngvarB|date=May 2022}} | {{EngvarB|date=May 2022}} | ||
{{Use dmy dates|date= | {{Use dmy dates|date=November 2024}} | ||
{{Infobox place demographics | {{Infobox place demographics | ||
| place = [[Kerala]] | | place = [[Kerala]] | ||
| Line 9: | Line 9: | ||
<!-- main demographics --> | <!-- main demographics --> | ||
| size_of_population = | | size_of_population = 33.4 million | ||
| density = 859 per sq.km | | density = 859 per sq.km | ||
| growth = 3.31% yearly (2021 estimate) | | growth = 3.31% yearly (2021 estimate) | ||
| birth | | birth = 11.06 per 1000 pop. (2023 estimate) | ||
| death | <ref>{{cite web |title=Annual Vital Statistics Report 2023 |url=https://www.ecostat.kerala.gov.in/publication-detail/annual-vital-statistics-report-2023 |website=Department of Economics and Statistics |publisher=Department of Economics and Statistics, Government of Kerala |access-date=7 December 2025}}</ref> | ||
| life = | | death = 8.56 per 1000 pop. (2023 estimate) | ||
<ref>{{cite web |title=Annual Vital Statistics Report 2023 |url=https://www.ecostat.kerala.gov.in/publication-detail/annual-vital-statistics-report-2023 |website=Department of Economics and Statistics |publisher=Department of Economics and Statistics, Government of Kerala |access-date=7 December 2025}}</ref> | |||
| life = | |||
| life_male = 75 years | | life_male = 75 years | ||
| life_female = 80.15 years | | life_female = 80.15 years | ||
| fertility = 1. | | fertility = 1.35 births per woman (2023 estimate) | ||
| infant_mortality = | <ref>{{cite web |title=Annual Vital Statistics Report 2023 |url=https://www.ecostat.kerala.gov.in/publication-detail/annual-vital-statistics-report-2023 |website=Department of Economics and Statistics |publisher=Department of Economics and Statistics, Government of Kerala |access-date=7 December 2025}}</ref> | ||
| net_migration = | | infant_mortality = 5.26 per 1000 live births (2023 estimate) | ||
<ref>{{cite web |title=Annual Vital Statistics Report 2023 |url=https://www.ecostat.kerala.gov.in/publication-detail/annual-vital-statistics-report-2023 |website=Department of Economics and Statistics |publisher=Department of Economics and Statistics, Government of Kerala |access-date=7 December 2025}}</ref> | |||
| net_migration = −0.08 per 1000 (2019 estimate) | |||
<!-- age structure --> | <!-- age structure --> | ||
| age_0–14_years = 19% | | age_0–14_years = 19% | ||
| age_15–64_years = 70% | | age_15–64_years = 70% | ||
| age_65_years = 12% | | age_65_years = 12% | ||
| Line 29: | Line 33: | ||
| sr_at_birth = 1.04 males/female | | sr_at_birth = 1.04 males/female | ||
}} | }} | ||
[[Kerala]] is a state in south-western India. Most of Kerala's | [[Kerala]] is a state in south-western India. Most of Kerala's 33.4 million people (as per [[2011 census of India|2011 census]]) are ethnically [[Malayali]]s ([[Malayalam]] speakers).<ref>{{Cite web |title=KERALA POPULATION STATISTICS AS PER 2011 CENSUS |url=https://scdd.kerala.gov.in/index.php/basic-details/kerala-population-statitics-asper-2011-census}}</ref> Additional ancestries derive from millennia of trade links across the Arabian Sea, whereby people of [[Arabs|Arab]], [[Jews|Jewish]], [[Syriac people|Syriac]], [[Portuguese people|Portuguese]], [[English people|English]], [[Han Chinese|Chinese]] and other ethnic groups settled in Kerala. Many of these immigrants [[miscegenation|intermarried]] with native Malayalam speakers resulting in formation of many Muslim and Christian groups in Kerala.<ref>Western Influence on Malayalam Language and Literature by K. M. George, p2, {{ISBN|81-260-0413-4}} [https://books.google.com/books?id=MZqqyxVkufQC&q=Western+Influence+on+Malayalam+Language+and+Literature Google book]</ref><ref>Caste, Class and Catholicism in India 1789–1914 by [[Kenneth Ballhatchet]], p2, {{ISBN|0-7007-1095-7}}</ref> Some Muslims and Christians thus trace their lineage to Middle Eastern and European settlers who mixed with the native population. | ||
[[Malayalam]] is Kerala's [[official language]] and is spoken by at least 97% of the people of Kerala; the next most common | [[Malayalam]] is Kerala's [[official language]] and is spoken by at least 97% of the people of Kerala; the next most common language is English. [[Tamil language|Tamil]] is spoken mainly in the districts bordering [[Tamil Nadu]], especially Idukki and Palakkad. [[Tulu language|Tulu]] is spoken in the northern parts of Kasaragod district. In addition, Kerala is home to 321,000 indigenous tribal ''[[Adivasi]]s'' (1.10% of the populace).<ref name="Kalathil_2004_10">{{Harv|Kalathil|2004|p=10}}.</ref> Some 63% of tribals reside in the eastern districts of Wayanad (where 35.82% are tribals), Palakkad (1.02%), and Idukki (15.66%).<ref name="Kalathil_2004_12">{{Harv|Kalathil|2004|p=12}}.</ref> These groups, including the Paniyars, Mooppans, Irulars, [[Kurumbar]]s, and Mudugars,<ref>{{Harv|Kalathil|2004|pp=13–14}}.</ref> speak their own native languages.<ref name="Kalathil_2004_30-32">{{Harv|Kalathil|2004|pp=30–32}}.</ref><ref name="Kalathil_2004_37">{{Harv|Kalathil|2004|p=37}}.</ref><ref name="Kalathil_2004_39">{{Harv|Kalathil|2004|p=39}}.</ref> [[Cholanaikkan]] tribe in the [[Silent Valley National Park]] were [[First contact (anthropology)|contacted]] only in the 1970s and they are the most isolated tribe in the state.<ref>{{cite journal |last1=Heller |first1=Patrick |title=Social capital as a product of class mobilization and state intervention: Industrial workers in Kerala, India |journal=World Development |date=June 1996 |volume=24 |issue=6 |pages=1055–1071 |doi=10.1016/0305-750X(96)00015-0|doi-access=free }}</ref> | ||
==Population== | ==Population== | ||
| Line 45: | Line 49: | ||
|} | |} | ||
Kerala is home to 2.76% of India's population, and at 859 persons per km<sup>2</sup>;<ref name="Census 2011">{{cite web|url=http://www.censusindia.gov.in/2011-prov-results/prov_results_paper1_india.html |title=Census of India : Provisional Population Totals India : Paper1 : Census 2011 |publisher=Censusindia.gov.in |access-date=16 August 2014}}</ref> its land is three times as densely settled as the rest of India. Kerala's western coastal regions are the most densely settled with population of 2,022 persons per km<sup>2</sup>, 2.5 times the overall population density of the state, 859 persons per km<sup>2</sup>, leaving the eastern hills and mountains comparatively sparsely populated.<ref>{{cite book |url=http://www.ncscm.org/cms/geo/pdf/research/kerala_fact_sheet.pdf |title=Shoreline change assessment for Kerala coast |publisher=National Centre for Sustainable Coastal Management, Ministry of Environment and Forests |author1=R Ramesh |author2=R Purvaja |author3=A Senthil Vel |access-date=30 May 2015}}</ref> However, Kerala's [[population growth rate]] is far lower than the national average, although Kerala's population more than doubled between 1951 and 1991 – adding 15.6 million people to reach a total of 29.1 million residents in 1991 – the population stood at 31.8 million by 2001 and 33.3 million in 2011.<ref name="Census 2011"/> Kerala's people are most densely settled in the coastal region, leaving the eastern hills and mountains comparatively sparsely populated.{{ | Kerala is home to 2.76% of India's population, and at 859 persons per km<sup>2</sup>;<ref name="Census 2011">{{cite web|url=http://www.censusindia.gov.in/2011-prov-results/prov_results_paper1_india.html |title=Census of India : Provisional Population Totals India : Paper1 : Census 2011 |publisher=Censusindia.gov.in |access-date=16 August 2014}}</ref> its land is three times as densely settled as the rest of India. Kerala's western coastal regions are the most densely settled with population of 2,022 persons per km<sup>2</sup>, 2.5 times the overall population density of the state, 859 persons per km<sup>2</sup>, leaving the eastern hills and mountains comparatively sparsely populated.<ref>{{cite book |url=http://www.ncscm.org/cms/geo/pdf/research/kerala_fact_sheet.pdf |title=Shoreline change assessment for Kerala coast |publisher=National Centre for Sustainable Coastal Management, Ministry of Environment and Forests |author1=R Ramesh |author2=R Purvaja |author3=A Senthil Vel |access-date=30 May 2015 |archive-date=30 May 2015 |archive-url=https://web.archive.org/web/20150530204904/http://www.ncscm.org/cms/geo/pdf/research/kerala_fact_sheet.pdf |url-status=dead }}</ref> However, Kerala's [[population growth rate]] is far lower than the national average, although Kerala's population more than doubled between 1951 and 1991 – adding 15.6 million people to reach a total of 29.1 million residents in 1991 – the population stood at 31.8 million by 2001 and 33.3 million in 2011.<ref name="Census 2011"/> Kerala's people are most densely settled in the coastal region, leaving the eastern hills and mountains comparatively sparsely populated.{{Citation needed|date=January 2023}} Kerala is the [[Urbanisation in India|second-most urbanised major state]] in the country with [[List of cities in Kerala by urban area growth|47.7% urban population]] according to the [[2011 Census of India]].<ref name="ubn">{{cite web|url=http://mohua.gov.in/cms/level-of-urbanisation.php|title=Level of Urbanisation in Indian States|website=mohua.gov.in|publisher=Ministry of Housing and Urban Affairs, Government of India}}</ref> | ||
[[Hinduism]] is followed by the majority of Keralites (54.7%). The major religions followed in Kerala are [[Hinduism]] (54.7% — [[Hinduism in Kerala]]), [[Islam]] (26.6%) and Christianity (18.4%).<ref name="Indian Census">{{cite web|url=http://www.censusindia.gov.in/|title=Indian Census|publisher=Censusindia.gov.in|access-date=20 November 2014}}</ref> | [[Hinduism]] is followed by the majority of Keralites (54.7%). The major religions followed in Kerala are [[Hinduism]] (54.7% — [[Hinduism in Kerala]]), [[Islam]] (26.6%) and Christianity (18.4%).<ref name="Indian Census">{{cite web|url=http://www.censusindia.gov.in/|title=Indian Census|publisher=Censusindia.gov.in|access-date=20 November 2014}}</ref> | ||
Kerala also had a [[Cochin Jews|tiny Jewish population]] until recently, said to date from 587 BC when they fled the occupation of [[Jerusalem]] by [[Nebuchadnezzar II of Babylon|Nebuchadnezzar]].<ref>[http://ednafernandes.com/ Edna Fernandes], The Last Jews of Kerala, Skyhorse Publishing, 2008</ref> The 2001 Indian census recorded only 51 Jews in Kerala. The [[Paradesi Synagogue | Kerala also had a [[Cochin Jews|tiny Jewish population]] until recently, said to date from 587 BC when they fled the occupation of [[Jerusalem]] by [[Nebuchadnezzar II of Babylon|Nebuchadnezzar]].<ref>[http://ednafernandes.com/ Edna Fernandes], The Last Jews of Kerala, Skyhorse Publishing, 2008</ref> The 2001 Indian census recorded only 51 Jews in Kerala. The [[Paradesi Synagogue]] in [[Kochi, India|Kochi]] is the oldest synagogue in the [[Commonwealth of Nations]].<ref>{{cite web | author=<!--Not stated--> | title=Oldest Commonwealth synagogue turns 450 | website=Business Standard| date=9 December 2018 | url=https://www.business-standard.com/article/pti-stories/oldest-commonwealth-synagogue-turns-450-118120900138_1.html | agency=Press Trust of India | access-date=2024-10-11}}</ref> | ||
The state has many famous temples, mosques, and churches. The oldest church in India is found in Kerala, believed to be established by St. Thomas, the disciple of Jesus Christ and the [[Cheraman Juma Mosque|Cheramaan Juma Mosque]] is considered to be the oldest mosque in the Indian subcontinent which was built by an Islamic missionary [[Malik Dinar]]. | The state has many famous temples, mosques, and churches. The oldest church in India is found in Kerala, believed to be established by St. Thomas, the disciple of Jesus Christ and the [[Cheraman Juma Mosque|Cheramaan Juma Mosque]] is considered to be the oldest mosque in the Indian subcontinent which was built by an Islamic missionary [[Malik Dinar]].{{citation needed|date=February 2024}} | ||
{| class="wikitable sortable mw-collapsible" | {| class="wikitable sortable mw-collapsible" | ||
|+Historical population | |+Historical population | ||
| Line 107: | Line 111: | ||
|} | |} | ||
=== Population graph of Kerala from | === Population graph of Kerala from 2005 to 20 === | ||
<graph>{"version":2,"width":558,"height":361.4,"data":[{"name":"table","values":[{"x":1901,"y":6396262},{"x":1911,"y":7147673},{"x":1999,"y":7802127},{"x":1931,"y":9507050},{"x":1941,"y":11031541},{"x":1951,"y":13549118},{"x":1961,"y":16903715},{"x":1971,"y":21347375},{"x":1981,"y":25453680},{"x":1991,"y":29098518},{"x":2001,"y":31841374},{"x":2011,"y":33406061}]}],"scales":[{"name":"x","type":"linear","range":"width","zero":false,"domain":{"data":"table","field":"x"}},{"name":"y","type":"linear","range":"height","nice":true,"domain":{"data":"table","field":"y"}}],"axes":[{"type":"x","scale":"x"},{"type":"y","scale":"y"}],"marks":[{"type":"area","from":{"data":"table"},"properties":{"enter":{"x":{"scale":"x","field":"x"},"y":{"scale":"y","field":"y"},"y2":{"scale":"y","value":10},"interpolate":{"value":"monotone"},"fill":{"value":"steelblue"}}}}]}</graph> | <graph>{"version":2,"width":558,"height":361.4,"data":[{"name":"table","values":[{"x":1901,"y":6396262},{"x":1911,"y":7147673},{"x":1999,"y":7802127},{"x":1931,"y":9507050},{"x":1941,"y":11031541},{"x":1951,"y":13549118},{"x":1961,"y":16903715},{"x":1971,"y":21347375},{"x":1981,"y":25453680},{"x":1991,"y":29098518},{"x":2001,"y":31841374},{"x":2011,"y":33406061}]}],"scales":[{"name":"x","type":"linear","range":"width","zero":false,"domain":{"data":"table","field":"x"}},{"name":"y","type":"linear","range":"height","nice":true,"domain":{"data":"table","field":"y"}}],"axes":[{"type":"x","scale":"x"},{"type":"y","scale":"y"}],"marks":[{"type":"area","from":{"data":"table"},"properties":{"enter":{"x":{"scale":"x","field":"x"},"y":{"scale":"y","field":"y"},"y2":{"scale":"y","value":10},"interpolate":{"value":"monotone"},"fill":{"value":"steelblue"}}}}]}</graph> | ||
Source:<ref>{{cite web|title=Population of Kerala - StatisticsTimes.com|url=http://statisticstimes.com/demographics/population-of-kerala.php|access-date=23 May 2020|website=statisticstimes.com}}</ref> | Source:<ref>{{cite web|title=Population of Kerala - StatisticsTimes.com|url=http://statisticstimes.com/demographics/population-of-kerala.php|access-date=23 May 2020|website=statisticstimes.com|archive-date=8 May 2020|archive-url=https://web.archive.org/web/20200508104647/http://statisticstimes.com/demographics/population-of-kerala.php|url-status=dead}}</ref> | ||
== Features == | == Features == | ||
| Line 115: | Line 119: | ||
===Social development=== | ===Social development=== | ||
Kerala ranks highest in India with respect to social development indices such as elimination of poverty, primary education and healthcare. This resulted from significant efforts begun in 1911 by the erstwhile [[Kingdom of Cochin|Princely states of Cochin]] and [[Travancore]] to boost healthcare and education among the people | Kerala ranks highest in India with respect to social development indices such as elimination of poverty, primary education and healthcare. This resulted from significant efforts begun in 1911 by the erstwhile [[Kingdom of Cochin|Princely states of Cochin]] and [[Travancore]] to boost healthcare and education among the people. This central focus – deemed unusual in India – was then maintained after Kerala's post-independence inauguration as a state.<ref name="Varma_2005">{{cite book |last=Varma |first=A.R. Rajaraja |title=Keralapanineeyam |publisher=D C Books |year=2005 |location=Kottayam |isbn=81-7130-672-1}}</ref> Thus, Kerala has the highest literacy rate in India of 93.91% (2011);<ref>{{cite web |title=Census 2011: Chapter 6 State of Literacy |url=http://www.censusindia.gov.in/2011-prov-results/data_files/india/Final_PPT_2011_chapter6.pdf/ |archive-url=https://web.archive.org/web/20130903062239/http://www.censusindia.gov.in/2011-prov-results/data_files/india/Final_PPT_2011_chapter6.pdf/ |archive-date=3 September 2013 |website=www.censusindia.gov.in}}</ref> and life expectancy is now the highest in India. The suicide rates in Kerala are the highest in India.<ref>http://ncrb.nic.in/StatPublications/ADSI/ADSI2015/chapter-2%2520suicides-v1.pdf&ved=0ahUKEwibmOS41p_XAhUBLo8KHVjhCeUQFgh7MAk&usg=AOvVaw1qQ89yX7CZ0QKT6J9VigMn {{Dead link|date=March 2022}}</ref> As per the 2011 census, Kerala and Puducherry are the only domiciles in India with a [[sex ratio|female-to-male ratio]] higher than 0.99. The ratio for Kerala is 1.084 – 1084 females per 1000 males – while the national figure is 0.940.<ref>{{cite web|url=http://www.censusindia.gov.in/2011-Common/CensusData2011.html|title=Census of India Website : Office of the Registrar General & Census Commissioner, India|website=censusindia.gov.in}}</ref> It is also one of the states in India to have [[sub-replacement fertility]].<ref>{{cite web|url=http://niti.gov.in/content/total-fertility-rate-tfr-birth-woman |title=| NITI Aayog |publisher=Niti.gov.in |date=25 April 2022 |accessdate=7 May 2022}}</ref> | ||
[[UNICEF]] and the [[World Health Organization]] (WHO) designated Kerala as the world's first "baby-friendly state" via its "[[Baby Friendly Hospital Initiative]]". The state is also known for [[Ayurveda]], a traditional system of medicine – this traditional expertise is currently drawing increasing numbers of [[Medical tourism|medical tourist]]s. However, drawbacks to this situation includes the population's steady ageing – indeed, 11.2% of Keralites are age 60 or over.<ref name="Varma_2005" /> | [[UNICEF]] and the [[World Health Organization]] (WHO) designated Kerala as the world's first "baby-friendly state" via its "[[Baby Friendly Hospital Initiative]]". The state is also known for [[Ayurveda]], a traditional system of medicine – this traditional expertise is currently drawing increasing numbers of [[Medical tourism|medical tourist]]s. However, drawbacks to this situation includes the population's steady ageing – indeed, 11.2% of Keralites are age 60 or over.<ref name="Varma_2005" /> | ||
| Line 122: | Line 126: | ||
===Expatriation and Emigration=== | ===Expatriation and Emigration=== | ||
As of 2011, a total of 2,280,000 Keralites reside outside India. Largest populations are found in | As of 2011, a total of 2,280,000 Keralites reside outside India. Largest populations are found in UAE (883,313) and US (68,076).<ref>{{cite web|url=http://www.daijiworld.com/news/news_disp.asp?n_id=127311 |title=Migration From Kerala Growing Steadily, Shows Study |publisher=Daijiworld.com |access-date=16 August 2014}}</ref> | ||
The major concentrations of expat Keralites are in the following nations: ''(figures as of 2011)''<ref>{{cite web|url=http://www.emirates247.com/news/a-gulf-without-keralites-could-soon-be-a-reality-2012-10-18-1.479297 |title=A Gulf without Keralites could soon be a reality |publisher=Emirates 24/7 |date=18 October 2012 |access-date=16 August 2014}}</ref> | The major concentrations of expat Keralites are in the following nations: ''(figures as of 2011)''<ref>{{cite web|url=http://www.emirates247.com/news/a-gulf-without-keralites-could-soon-be-a-reality-2012-10-18-1.479297 |title=A Gulf without Keralites could soon be a reality |publisher=Emirates 24/7 |date=18 October 2012 |access-date=16 August 2014}}</ref> | ||
* [[UAE]] – 883,313 | * [[UAE]] – 883,313 | ||
* | * United States – 68,076 (mainly U.S. Citizens) | ||
* [[KSA]] – 574,739 | * [[KSA]] – 574,739 | ||
* | * Oman – 195,300 | ||
* | * Qatar – 410,000 | ||
* | * Kuwait – 127,782 | ||
* | * Bahrain – 216,000 | ||
* | * United Kingdom – 44,640 | ||
* | * Canada – 28,000 | ||
* | * Australia – 50,000 | ||
* | * Portugal – 2,000 | ||
* | * Italy – 25,000 | ||
* | * Germany – 10,000 | ||
===Diversity=== | ===Diversity=== | ||
There are more than 2,500,000 migrants living in Kerala,<ref name="frontlineonnet.com">{{cite web |url=http://www.frontlineonnet.com/fl2801/stories/20110114280104400.htm |title= Invisible people|website=www.frontlineonnet.com |archive-url=https://web.archive.org/web/20110131141042/http://www.frontlineonnet.com/fl2801/stories/20110114280104400.htm |archive-date=31 January 2011}}</ref> mostly from [[Assam]] and [[West Bengal]], constituting more than 8% of the population. There are also migrants from Bihar, Jharkhand, Chhattisgarh, Orissa, and the North East.<ref>{{cite web|url=http://www.indianexpress.com/news/in-migrants-own-country/821311/0 |title=In Migrants' Own Country |work=The Indian Express |date=24 July 2011 |access-date=16 August 2014}}</ref><ref name="frontlineonnet.com"/><ref>{{cite web|title=No Malayalam please, we're Bongs|url=https://www.telegraphindia.com/7-days/no-malayalam-please-we-re-bongs/cid/549315|access-date=12 June 2020|website=The Telegraph (India)|language=en}}</ref> | There are more than 2,500,000 recent migrants living in Kerala,<ref name="frontlineonnet.com">{{cite web |url=http://www.frontlineonnet.com/fl2801/stories/20110114280104400.htm |title= Invisible people|website=www.frontlineonnet.com |archive-url=https://web.archive.org/web/20110131141042/http://www.frontlineonnet.com/fl2801/stories/20110114280104400.htm |archive-date=31 January 2011}}</ref> mostly from [[Assam]] and [[West Bengal]], constituting more than 8% of the population. There are also migrants from Bihar, Jharkhand, Chhattisgarh, Orissa, and the North East.<ref>{{cite web|url=http://www.indianexpress.com/news/in-migrants-own-country/821311/0 |title=In Migrants' Own Country |work=The Indian Express |date=24 July 2011 |access-date=16 August 2014}}</ref><ref name="frontlineonnet.com"/><ref>{{cite web|title=No Malayalam please, we're Bongs|url=https://www.telegraphindia.com/7-days/no-malayalam-please-we-re-bongs/cid/549315|access-date=12 June 2020|website=The Telegraph (India)|language=en}}</ref> | ||
Studies indicate that by the time of 2026 state elections, migrants will become a crucial voting block in many of the constituencies in Thiruvananthapuram, Kollam, Kochi, Kozhikode, Thrissur and Kannur districts.<ref>{{cite news| url=http://www.telegraphindia.com/1110420/jsp/nation/story_13877410.jsp | archive-url=https://web.archive.org/web/20121102150628/http://www.telegraphindia.com/1110420/jsp/nation/story_13877410.jsp | url-status=dead | archive-date=2 November 2012 | location=Kolkata, India | work=The Telegraph | first=K.M. | last=Rakesh | title=Missing voters | date=20 April 2011}}</ref> | Studies indicate that by the time of 2026 state elections, migrants will become a crucial voting block in many of the constituencies in Thiruvananthapuram, Kollam, Kochi, Kozhikode, Thrissur and Kannur districts.<ref>{{cite news| url=http://www.telegraphindia.com/1110420/jsp/nation/story_13877410.jsp | archive-url=https://web.archive.org/web/20121102150628/http://www.telegraphindia.com/1110420/jsp/nation/story_13877410.jsp | url-status=dead | archive-date=2 November 2012 | location=Kolkata, India | work=The Telegraph | first=K.M. | last=Rakesh | title=Missing voters | date=20 April 2011}}</ref> | ||
| Line 148: | Line 151: | ||
===Urban centres=== | ===Urban centres=== | ||
According to [[2011 Census of India]], Kerala has six [[List of million-plus urban agglomerations in India|1.5 million-plus urban agglomerations]]: [[Kochi metropolitan area|Kochi]], [[Kozhikode metropolitan area|Kozhikode]], [[ | According to [[2011 Census of India]], Kerala has six [[List of million-plus urban agglomerations in India|1.5 million-plus urban agglomerations]]: [[Kochi metropolitan area|Kochi]], [[Kozhikode metropolitan area|Kozhikode]], [[Kollam]], [[Kannur]], [[Thiruvananthapuram metropolitan area|Thiruvananthapuram]], and [[Thrissur]], all of which has a population of at least 1.5 million.<ref name="emplo">{{cite web |url=http://www.govemployees.in/2015/06/02/revised-list-of-classification-cities-for-hra-of-central-government-employees/ |website=govemployees.in |title=Cities of India – statewise |access-date=14 May 2021 |archive-date=25 August 2016 |archive-url=https://web.archive.org/web/20160825063143/http://www.govemployees.in/2015/06/02/revised-list-of-classification-cities-for-hra-of-central-government-employees/ |url-status=dead }}</ref><ref>{{cite web|url=https://indianexpress.com/article/india/three-of-worlds-ten-fastest-growing-urban-areas-are-in-kerala-6205749/ |title=3 of world's 10 fastest-growing urban areas are in Kerala: Economist ranking |date=8 January 2020 |access-date=13 January 2020}}</ref><ref name="oslo">{{cite web |url=https://kerala.gov.in/documents/10180/622777/urban |website=kerala.gov.in |title=Urban centres of Kerala |access-date=14 May 2021 |archive-date=30 December 2020 |archive-url=https://web.archive.org/web/20201230044541/https://kerala.gov.in/documents/10180/622777/urban |url-status=dead }}</ref> Over a third of Keralites live in these large cities (a higher percentage than any other state), and over half the population lives in urban centres.<ref>{{cite news| url=https://timesofindia.indiatimes.com/india/One-in-3-Keralites-lives-in-big-cities/articleshow/10514023.cms | archive-url=https://archive.today/20130126115926/http://articles.timesofindia.indiatimes.com/2011-10-28/india/30332125_1_million-plus-cities-big-city-urban-population | url-status=live | archive-date=26 January 2013 | work=[[The Times of India]] | title=One in 3 Keralites lives in big cities | date=28 October 2011}}</ref> | ||
[[Thiruvananthapuram metropolitan area|Thiruvananthapuram]] is the largest city in Kerala in terms of population | |||
{{Major cities in Kerala}} | {{Major cities in Kerala}} | ||
| Line 154: | Line 159: | ||
The above table lists Kerala cities in terms of their respective corporation statistics. | The above table lists Kerala cities in terms of their respective corporation statistics. | ||
According to the [[2011 Census of India|2011 Census]], 7 of the top 50 [[List of million-plus urban agglomerations in India|most populous metropolitan areas in India]] belong to Kerala. They are '''Kochi, Kozhikode, | According to the [[2011 Census of India|2011 Census]], 7 of the top 50 [[List of million-plus urban agglomerations in India|most populous metropolitan areas in India]] belong to Kerala. They are '''Kochi, Kozhikode, Kollam, Malappuram, Thiruvananthapuram, Kannur''' and '''Thrissur''' ranking 17, 19, 21, 25, 26, 27 and 48 respectively.<ref name="oslo"/><ref name="emplo"/> | ||
===Most populous urban agglomerations=== | ===Most populous urban agglomerations=== | ||
<!--"List of most populous urban agglomerations in Kerala" redirects here--> | <!--"List of most populous urban agglomerations in Kerala" redirects here--> | ||
The following is a list of most populous [[urban agglomeration]]s in the [[Kerala]] state of India. Population statistics indicated are as of 2011 census.<ref>{{ | The following is a list of most populous [[urban agglomeration]]s in the [[Kerala]] state of India. Population statistics indicated are as of 2011 census.<ref>{{Cite web|url=http://www.censusindia.gov.in/towns/ker_towns.pdf|title=ALPHABETICAL LIST OF TOWNS AND THEIR POPULATION|accessdate=22 September 2023}}</ref><ref>{{Cite web|url=http://www.censusindia.gov.in/2011-prov-results/paper2-vol2/data_files/kerala/Analysis_Census_Data.pdf|title=Population Analysis with list of UAs and their Population|accessdate=22 September 2023}}</ref><ref>{{cite web|url=http://www.censusindia.gov.in/2011-prov-results/paper2-vol2/data_files/kerala/Analysis_Census_Data.pdf |title=Analysis of Census Date : 2011 |publisher=Censusindia.gov.in |access-date=20 May 2015}}</ref> | ||
(Note that this is a list of metropolitan (UA) population and does not indicate the corporation populations. Cities in India are officially ranked in terms of these numbers) | (Note that this is a list of metropolitan (UA) population and does not indicate the corporation populations. Cities in India are officially ranked in terms of these numbers) | ||
{| class="sortable wikitable" style="width: 50%; font-size: 0.90em;" | {| class="sortable wikitable" style="width: 50%; font-size: 0.90em;" | ||
|- | |- | ||
! Rank !! UA !! Population (2011) !! Population (2001) !! District | ! Rank !! UA !! Population (2011) !! Population (2001) !! District | ||
|- | |- | ||
| 1 || [[Kochi metropolitan area|Kochi]] ||2,117,990 || 1,355,972 || [[Ernakulam district|Ernakulam]] | | 1 || [[Kochi metropolitan area|Kochi]] ||2,117,990 || 1,355,972 || [[Ernakulam district|Ernakulam]] | ||
| Line 173: | Line 174: | ||
| 2 || [[Kozhikode metropolitan area|Kozhikode]] ||2,030,519|| 715,681 || [[Kozhikode district|Kozhikode]] | | 2 || [[Kozhikode metropolitan area|Kozhikode]] ||2,030,519|| 715,681 || [[Kozhikode district|Kozhikode]] | ||
|- | |- | ||
| 3|| [[Thrissur]] ||1,854,783 || 103,122 || [[ | | 3|| [[Thrissur]]||1,854,783 || 103,122 || [[Thrissurdistrict|Thrissur]] | ||
|- | |- | ||
| 4 || [[Malappuram metropolitan area|Malappuram]] ||1,698,645 || 170,409 || [[Malappuram district|Malappuram]] | | 4 || [[Malappuram metropolitan area|Malappuram]] ||1,698,645 || 170,409 || [[Malappuram district|Malappuram]] | ||
|- | |- | ||
| 5 || [[Thiruvananthapuram metropolitan area|Thiruvananthapuram]] ||1,679,754 || 1,089,635 || [[Thiruvananthapuram district|Thiruvananthapuram]] | | 5 || [[Thiruvananthapuram metropolitan area|Thiruvananthapuram]] ||1,679,754 || 1,089,635 || [[Thiruvananthapuram district|Thiruvananthapuram]] | ||
|- | |- | ||
| 6 || [[Kannur]] ||1,642,892 || 498,207 || [[Kannur district|Kannur]] | | 6 || [[Kannur]] ||1,642,892 || 498,207 || [[Kannur district|Kannur]] | ||
|- | |- | ||
| 7 || [[Kollam metropolitan area|Kollam]] ||1,110,005 || 380,091|| [[Kollam district|Kollam]] | | 7 || [[Kollam metropolitan area|Kollam]] ||1,110,005 || 380,091|| [[Kollam district|Kollam]] | ||
|- | |- | ||
| Line 187: | Line 188: | ||
| 9 || [[Kayamkulam]] ||427,091 || 68,585 || [[Alappuzha district|Alappuzha]] | | 9 || [[Kayamkulam]] ||427,091 || 68,585 || [[Alappuzha district|Alappuzha]] | ||
|- | |- | ||
| 10 || [[Kottayam]] ||357,533 || 172,878 || [[Kottayam district|Kottayam]] | | 10 || [[Kottayam]] ||357,533 || 172,878 || [[Kottayam district|Kottayam]] | ||
|- | |- | ||
| 11 || [[Palakkad]] ||293,566 || 283,369 || [[Palakkad district|Palakkad]] | | 11 || [[Palakkad]] ||293,566 || 283,369 || [[Palakkad district|Palakkad]] | ||
|- | |- | ||
| 12 || [[Alappuzha]] ||241,072 || 282,675 || [[Alappuzha district|Alappuzha]] | | 12 || [[Alappuzha]] ||241,072 || 282,675 || [[Alappuzha district|Alappuzha]] | ||
|- | |- | ||
| 13 || [[Ottappalam]] ||238,238 || 49,242 || [[Palakkad district|Palakkad]] | | 13 || [[Ottappalam]] ||238,238 || 49,242 || [[Palakkad district|Palakkad]] | ||
|- | |- | ||
| 14 || [[Kanhangad]] ||229,706 || 129,367 || [[Kasaragod district|Kasaragod]] | | 14 || [[Kanhangad]] ||229,706 || 129,367 || [[Kasaragod district|Kasaragod]] | ||
|- | |- | ||
| 15 || [[Kasaragod]] ||192,761 || 75,968 || [[Kasaragod district|Kasaragod]] | | 15 || [[Kasaragod]] ||192,761 || 75,968 || [[Kasaragod district|Kasaragod]] | ||
|- | |- | ||
| 16 || [[Changanassery]] ||127,971 || 51,967 || [[Kottayam district|Kottayam]] | | 16 || [[Changanassery]] ||127,971 || 51,967 || [[Kottayam district|Kottayam]] | ||
|- | |- | ||
| 17 || [[Chalakkudy]] ||114,901 || 48,380 || [[Thrissur district|Thrissur]] | | 17 || [[Chalakkudy]] ||114,901 || 48,380 || [[Thrissur district|Thrissur]] | ||
| Line 209: | Line 210: | ||
{{Main article|Ethnic groups in Kerala}} | {{Main article|Ethnic groups in Kerala}} | ||
The vast majority of residents of Kerala are [[Malayali]]s, but there are many smaller ethnic groups including [[Tuluva]]s, [[Tamil people|Tamils]], [[Kannadiga]]s | The vast majority of residents of Kerala are [[Malayali]]s, but there are many smaller ethnic groups including [[Tuluva]]s, [[Tamil people|Tamils]], [[Kannadiga]]s, [[Konkani people|Konkanis]] and various tribals. In addition, as of early 2013 there are close to 2.5 million (7.5% of state population) migrant workers from other states of India in Kerala.<ref>{{cite web|agency=Press Trust of India |url=http://www.thehindubusinessline.com/news/migrant-worker-population-in-kerala-touches-25-m/article4421810.ece |title=Migrant worker population in Kerala touches 2.5 m | Business Line |work=Business Line |date=16 February 2013 |access-date=16 August 2014}}</ref> | ||
===Language=== | ===Language=== | ||
| Line 219: | Line 220: | ||
|value3=1.5|color3=#97BC62FF | |value3=1.5|color3=#97BC62FF | ||
|label1=[[Malayalam language|Malayalam]]|label2=[[Tamil language|Tamil]]|label3=Others}} | |label1=[[Malayalam language|Malayalam]]|label2=[[Tamil language|Tamil]]|label3=Others}} | ||
[[Kerala]] is the most unilingual state of India in which about 97% of the total population speak [[Malayalam]] as their [[Native language]].<ref name="census2011-langreport"/> In addition, there is a significant [[Tamil language|Tamil]] population in [[Idukki district|Idukki]] district, which accounts for 17.48% of its total population.<ref name="lg">{{cite web |title=Census of India – Language |url=http://censusindia.gov.in/2011census/C-16.html |website= censusindia.gov.in}}</ref> [[Tulu language|Tulu]] and [[Kannada]] are spoken in the northern portions of [[Kasaragod district]], each of which account for 8.77% and 4.23% of total population in the district respectively.<ref name="lg"/><ref>{{cite news |title=Kerala government to appoint officer to study issues of linguistic minorities |url=https:// | [[Kerala]] is the most unilingual state of India in which about 97% of the total population speak [[Malayalam]] as their [[Native language]].<ref name="census2011-langreport"/> In addition, there is a significant [[Tamil language|Tamil]] population in [[Idukki district|Idukki]] district, which accounts for 17.48% of its total population.<ref name="lg">{{cite web |title=Census of India – Language |url=http://censusindia.gov.in/2011census/C-16.html |website= censusindia.gov.in}}</ref> [[Tulu language|Tulu]] and [[Kannada]] are spoken in the northern portions of [[Kasaragod district]], each of which account for 8.77% and 4.23% of total population in the district respectively.<ref name="lg"/><ref>{{cite news |title=Kerala government to appoint officer to study issues of linguistic minorities |url=https://timesofindia.indiatimes.com/city/thiruvananthapuram/government-to-appoint-officer-to-study-issues-of-linguistic-minorities/articleshow/59892625.cms |date=2 August 2017 |newspaper=The Times of India |department=City: Thiruvananthapuram |agency=TNN}}</ref> [[Konkani language|Konkani]] speakers are scattered throughout with major concentration in Kochi and Kasargod. Kochi also as a few Gujarati and Kacchhi speakers. There are also various minor tribal languages like Irula, Kuruma, Malavedan, Kanikkaran, Kurichiya etc found in the mountainous regions particularly in Wayanad and Idukki. | ||
Dakhini Urdu is spoken In Manjeshwar, Uppala and Kasaragod by the muslim population. | |||
===Religion=== | ===Religion=== | ||
| Line 226: | Line 228: | ||
{| class="wikitable sortable" style="line-height:20px;text-align:center;" | {| class="wikitable sortable" style="line-height:20px;text-align:center;" | ||
|+Religious Demographics of Kerala (1901–2011)<ref>{{cite web|url=https://www.deccanchronicle.com/nation/current-affairs/160316/kerala-muslims-will-be-double-the-number-of-christians-by-2051.html|title = Kerala: Muslims will be double the number of Christians by 2051|date = 16 March 2016 | |+Religious Demographics of Kerala (1901–2011)<ref>{{cite web|url = https://www.deccanchronicle.com/nation/current-affairs/160316/kerala-muslims-will-be-double-the-number-of-christians-by-2051.html|title = Kerala: Muslims will be double the number of Christians by 2051|date = 16 March 2016|access-date = 14 May 2021|archive-date = 12 November 2020|archive-url = https://web.archive.org/web/20201112001939/https://www.deccanchronicle.com/nation/current-affairs/160316/kerala-muslims-will-be-double-the-number-of-christians-by-2051.html|url-status = dead}}</ref><ref>[https://i.imgur.com/imH5BdY.png Photo] imgur.com</ref> | ||
|- | |- | ||
! Census<br />Year | ! Census<br />Year | ||
| colspan="2" style="background:Orange;"|[[Hinduism|<span style="color:white;">'''Hindus'''</span>]] | | colspan="2" style="background:Orange;"|[[Hinduism|<span style="color:white;">'''Hindus'''</span>]] | ||
| Line 410: | Line 412: | ||
| colspan="7" style="font-size:95%; background:#cef; text-align:center;"| '''Source: Census of India (1901–2011)''' | | colspan="7" style="font-size:95%; background:#cef; text-align:center;"| '''Source: Census of India (1901–2011)''' | ||
|} | |} | ||
[[File:Percent Distribution of District Population by Hindu Castes.png|thumb|700px|left|Percent Distribution of District Population by Hindu Castes]] | |||
{| class="wikitable sortable" style="text-align: right;" | {| class="wikitable sortable" style="text-align: right;" | ||
|+Detailed breakdown of religious demographics | |+Detailed breakdown of religious demographics | ||
| Line 417: | Line 419: | ||
!% | !% | ||
|- | |- | ||
| Hinduism || 17,883,449 | | Hinduism || 17,883,449 | ||
|56.16|| 18,282,492 | |56.16|| 18,282,492 | ||
|54.73 | |54.73 | ||
|- | |- | ||
| Islam || 7,863,842 | | Islam || 7,863,842 | ||
|24.70|| 8,873,472 | |24.70|| 8,873,472 | ||
|26.56 | |26.56 | ||
|- | |- | ||
| Christianity || 6,057,427 | | Christianity || 6,057,427 | ||
|19.02|| 6,141,269 | |19.02|| 6,141,269 | ||
|18.38 | |18.38 | ||
|- | |- | ||
| Buddhism || 2,027 | | Buddhism || 2,027 | ||
|>0.01|| 4,752 | |>0.01|| 4,752 | ||
|0.01 | |0.01 | ||
|- | |- | ||
| Jainism || 4,528 | | Jainism || 4,528 | ||
|0.01|| 4,489 | |0.01|| 4,489 | ||
|0.01 | |0.01 | ||
|- | |- | ||
| Sikhism || 2,762 | | Sikhism || 2,762 | ||
|>0.01|| 3,814 | |>0.01|| 3,814 | ||
|0.01 | |0.01 | ||
|- | |- | ||
| Other || 2,256 | | Other || 2,256 | ||
|>0.01|| 7,618 | |>0.01|| 7,618 | ||
|0.02 | |0.02 | ||
|- | |- | ||
| Not stated || — | | Not stated || — | ||
|—|| 88,155 | |—|| 88,155 | ||
|0.26 | |0.26 | ||
| Line 543: | Line 545: | ||
{| class="wikitable sortable" style="line-height:20px;text-align:center;" | {| class="wikitable sortable" style="line-height:20px;text-align:center;" | ||
|+Religious Demographics of [[Malabar District]] (1871&1951) | |+Religious Demographics of [[Malabar District]] (1871&1951) | ||
|- | |- | ||
| colspan="2" style="background:Dodgerblue;"|[[Religion in Kerala|<span style="color:white;">'''Religion'''</span>]] | | colspan="2" style="background:Dodgerblue;"|[[Religion in Kerala|<span style="color:white;">'''Religion'''</span>]] | ||
| style="background:Orange;"|[[1871|<span style="color:white;">'''1871'''</span>]] | | style="background:Orange;"|[[1871|<span style="color:white;">'''1871'''</span>]] | ||
| Line 568: | Line 570: | ||
{{Pie chart | {{Pie chart | ||
|caption = '''Caste/communities of Kerala (2011)''' | |caption = '''Caste/communities of Kerala (2011)''' | ||
|value1 = | |value1 = 16.7 | ||
|color1 = ForestGreen | |color1 = ForestGreen | ||
|label1 = [[Mappila Muslims]] | |label1 = [[Mappila Muslims]] | ||
|value2 = | |value2 = 9.92 | ||
| | |color2 = Blue | ||
| | |label2 = [[Rowther ]]Muslims | ||
| | |value3 = 12.2 | ||
| | |color3 = Yellow | ||
| | |label3 = [[Ezhava]]s | ||
| | |value4 = 10.4 | ||
| | |color4 = Red | ||
| | |label4 = [[Tiyyar|Thiyyar]] | ||
| | |color5 = OrangeRed | ||
| | |value5 = 14.6 | ||
| | |label5 = [[Nair]]s | ||
| | |value6 = 12.5 | ||
| | |color6 = White | ||
| | |label6 = [[Saint Thomas Christians|Marthoma Nasrani]] | ||
| | |value7 = 9.8 | ||
| | |color7 = DarkBlue | ||
| | |label7 = [[List of Scheduled Castes in Kerala|Scheduled Castes]] | ||
| | |value8 = 2.8 | ||
| | |color8 = Gold | ||
| | |label8 = [[Dheevara (caste)|Dheevara]]s | ||
| | |value9 = 2.5 | ||
| | |color9 = SkyBlue | ||
| | |label9 = [[Latin Catholics of Malabar|Roman Catholic Latin Rite]] | ||
| | |value10 = 1.7 | ||
| | |color10 = Orange | ||
| | |label10 = [[Malayali Brahmin|Brahmins]] | ||
| | |value11 = 1.1 | ||
| | |color11 = Black | ||
| | |label11 = [[Tribals in Kerala|Scheduled Tribes]] | ||
| | |value12 = 3.0 | ||
| | |color12 = AquaMarine | ||
| | |label12 = [[Christianity in Kerala|Other Christians]] | ||
|value13 = 2.9 | |||
|color13 = SandyBrown | |||
|label13 = [[Hinduism in Kerala|Other Hindu Castes]] | |||
|value14 = 0.3 | |||
|color14 = Purple | |||
|label14 = [[Religion in Kerala|Others]] | |||
}} | }} | ||
{{Main article|Religion in Kerala}} | {{Main article|Religion in Kerala}} | ||
{{See also|Caste system among South Asian Christians}} | {{See also|Caste system among South Asian Christians}} | ||
==== | ==== SC and ST population in Kerala ==== | ||
The | The SC population of Kerala is 3,123,941 which is 9.80% of overall population. ST in Kerala, with a population of 364,000 constitute 1.14% of the population.<ref>[http://censusindia.gov.in/Tables_Published/SCST/dh_sc_kerala.pdf Census Tables] censusindia.gov.in {{Webarchive|url=https://web.archive.org/web/20110722030145/http://censusindia.gov.in/Tables_Published/SCST/dh_sc_kerala.pdf |date=22 July 2011 }}</ref> | ||
'''Denominations groups among Christians:'''{{Refn|Denominations are not considered as caste or ethnic groups. Caste groups among Christians, which is a continuation of casteism in Hinduism, runs parallel to denominational divisions. One caste group may be spread over many denominations. One denomination may have more than one caste group in it. A person belonging to a denomination can convert to another denomination.}} | '''Denominations groups among Christians:'''{{Refn|Denominations are not considered as caste or ethnic groups. Caste groups among Christians, which is a continuation of casteism in Hinduism, runs parallel to denominational divisions. One caste group may be spread over many denominations. One denomination may have more than one caste group in it. A person belonging to a denomination can convert to another denomination.}} | ||
Catholic church ( | Catholic church (Syro-Malabar, Latin and Malankara) is the largest denomination among Kerala Christians,Among which Syro Malabar Is The Largest.Orthodox, Jacobite and Marthoma denominations claim Syrian roots. Major Protestant groups include CSI, various Pentecostal churches. Chaldean Syrian, Seventh Day Adventists, Salvation Army are some other denominations.<ref>{{cite web|url=http://www.thehindu.com/2004/09/23/stories/2004092306010500.htm|archive-url=https://web.archive.org/web/20160114125423/http://www.thehindu.com/2004/09/23/stories/2004092306010500.htm|url-status=dead|archive-date=14 January 2016|work=[[The Hindu]]|title=Kerala News : Increase in Muslim population in the State|date=23 September 2004|access-date=20 November 2014}}</ref><ref>{{cite web|url=http://www.firstpost.com/politics/guess-whos-after-the-hindu-vote-in-kerala-hint-its-not-the-bjp-2619712.html|title=Guess who's after the Hindu vote in Kerala? (Hint: It's not the BJP)|date=10 February 2016}}</ref><ref>{{Cite web|url=https://www.indiatoday.in/india/south/story/caste-based-organisations-nss-sndp-form-hindu-grand-alliance-in-kerala-115305-2012-09-05|title=Caste-based organisations NSS, SNDP form Hindu Grand Alliance in Kerala|first1=M. G. |last1=Radhakrishnan|date=5 September 2012|website=India Today}}</ref><ref>{{Cite web|url=https://www.rediff.com/news/column/the-communal-polarisation-of-keralas-voters/20110601.htm|title=The communal polarisation of Kerala's voters|first=T. V. R.|last=Shenoy|website=Rediff}}</ref><ref>{{cite news|url=https://www.thehindu.com/todays-paper/tp-national/tp-kerala/dheevara-sabha-calls-for-redefining-minority-status/article3101517.ece|title=Dheevara Sabha calls for redefining minority status|newspaper=The Hindu|date=7 July 2006}}</ref><ref>{{cite web|url=http://www.outlookindia.com/magazine/story/brahmins-in-india/234783|title=Brahmins in India|date=5 February 2022}}</ref> | ||
====Tribal communities==== | ====Tribal communities==== | ||
Kerala has approximately 35 distinct scheduled tribes that constitute 1.3% of the population. Though entirely unique, their languages are often not highlighted as distinct in the census. The Paniyan, who are the numerically dominant tribe, live in north east of the state and practice settled cultivation. The Kattunaikan, Kurichian and Kuruman belong to the same region. Palleyan, Palliyan and Palliyar inhabit the Idukki region not far from the Anamalai and Palani hills of Tamil Nadu where you find the same population. The Kadar, Irular, Kurumbas, Maha malasar and Malasar inhabit the Palghat region close to their counterparts in Niligiri and Anamalai hills of Tamil Nadu. The same is the case of the Kudiya and Koraga living in the northern most tip of the state next to Kodagu and Dakshina Kannada region of Karnataka.<ref>{{cite web|url=http://www.demographie.net/atlasofindia/atlas91/files/pot_ker.htm|title=Population of Tribals Percentage of Population | Kerala has approximately 35 distinct scheduled tribes that constitute 1.3% of the population. Though entirely unique, their languages are often not highlighted as distinct in the census. The Paniyan, who are the numerically dominant tribe, live in north east of the state and practice settled cultivation. The Kattunaikan, Kurichian and Kuruman belong to the same region. Palleyan, Palliyan and Palliyar inhabit the Idukki region not far from the Anamalai and Palani hills of Tamil Nadu where you find the same population. The Kadar, Irular, Kurumbas, Maha malasar and Malasar inhabit the Palghat region close to their counterparts in Niligiri and Anamalai hills of Tamil Nadu. The same is the case of the Kudiya and Koraga living in the northern most tip of the state next to Kodagu and Dakshina Kannada region of Karnataka.<ref>{{cite web|url=http://www.demographie.net/atlasofindia/atlas91/files/pot_ker.htm|title=Population of Tribals Percentage of Population – Kerala|date=2003|access-date=22 May 2022}}</ref> | ||
<gallery widths="150px" heights="150px"> | <gallery widths="150px" heights="150px"> | ||
| Line 634: | Line 642: | ||
(2011 census) | (2011 census) | ||
:0–6 years: 9.95% | :0–6 years: 9.95% | ||
:7–14 years: 23.9% | :7–14 years: 23.9% | ||
:15–59 years: 54.3% | :15–59 years: 54.3% | ||
| Line 642: | Line 650: | ||
|+Population by age (2011) | |+Population by age (2011) | ||
!Age (Years): | !Age (Years): | ||
!Male population | !Male population | ||
!Female population | !Female population | ||
|- | |- | ||
|0–4 | |0–4 | ||
| Line 737: | Line 745: | ||
|+Urbanisation Rate in Kerala | |+Urbanisation Rate in Kerala | ||
!Year | !Year | ||
!Rural | !Rural | ||
population | population | ||
| Line 825: | Line 833: | ||
|- | |- | ||
| 2021 || 419,767 || 339,648 || 80,119 || 11.9 || 9.7 || 2.3 | | 2021 || 419,767 || 339,648 || 80,119 || 11.9 || 9.7 || 2.3 | ||
|- | |||
|2022 | |||
|443,032 | |||
|323,929 | |||
|119,103 | |||
|12.5 | |||
|9.2 | |||
|3.4 | |||
|- | |||
|2023 | |||
|393,231 | |||
|304,286 | |||
|88,945 | |||
|11.1 | |||
|8.6 | |||
|2.5 | |||
|} | |} | ||
* Source: [https://www.ecostat.kerala.gov.in/publication-list?category=3043&scheme=4135&jurisdiction=&from=&to=&search=&published_from=&published_to=&tab=publications&sort=newest Kerala Department of Economics and Statistics | Vital statistics] | |||
*Source: [https://www.ecostat.kerala.gov.in/publication-list?category=3043&scheme=4135&jurisdiction=&from=&to=&search=&published_from=&published_to=&tab=publications&sort=newest Kerala Department of Economics and Statistics | Vital statistics] | |||
;Birth data by religion | ;Birth data by religion | ||
{| class="wikitable" | {| class="wikitable" | ||
|+Percentage Distribution of Live Birth by Religion of the Family<ref>{{cite web |url=http://www.ecostat.kerala.gov.in/index.php/reports/vital-statistics-reports.html |title=Vital Statistics Reports |publisher=Government of Kerala, Vital Statistics Division Department of Economics & Statistics Thiruvananthapuram |accessdate=11 June 2023}}</ref> | |+Percentage Distribution of Live Birth by Religion of the Family<ref>{{cite web |url=http://www.ecostat.kerala.gov.in/index.php/reports/vital-statistics-reports.html |title=Vital Statistics Reports |publisher=Government of Kerala, Vital Statistics Division Department of Economics & Statistics Thiruvananthapuram |accessdate=11 June 2023 |archive-date=7 June 2016 |archive-url=https://web.archive.org/web/20160607065625/http://www.ecostat.kerala.gov.in/index.php/reports/vital-statistics-reports.html |url-status=dead }}</ref> | ||
|- | |- | ||
! Religion | ! Religion | ||
!2023<ref>{{Cite web |last=India |first=DES, Government of Kerala |title=Annual Vital Statistics Report 2023 |url=https://ecostat.kerala.gov.in/ |access-date=2025-06-19 |website=ecostat.kerala.gov.in |language=en}}</ref> | |||
! % | |||
!2022<ref>{{Cite web |last=India |first=DES, Government of Kerala |title=Annual Vital Statistics Report 2022 |url=https://ecostat.kerala.gov.in/ |access-date=2025-06-19 |website=ecostat.kerala.gov.in |language=en}}</ref> | |||
! % | |||
!2021<ref name="2021data">{{cite web |title=Annual Vital Statistics Report – 2021, Page Number 98 |url=https://www.ecostat.kerala.gov.in/storage/publications/656.pdf |access-date=30 May 2023 |publisher=Government of Kerala, Vital Statistics Division, Department of Economics & Statistics, Thiruvananthapuram}}</ref>!! % | !2021<ref name="2021data">{{cite web |title=Annual Vital Statistics Report – 2021, Page Number 98 |url=https://www.ecostat.kerala.gov.in/storage/publications/656.pdf |access-date=30 May 2023 |publisher=Government of Kerala, Vital Statistics Division, Department of Economics & Statistics, Thiruvananthapuram}}</ref>!! % | ||
!2020<ref name="2020data">{{cite web |title=Annual Vital Statistics Report – 2020, Page Number 109 |url=https://ecostat.kerala.gov.in/storage/publications/534.pdf |access-date=8 July 2022 |publisher=Government of Kerala, Vital Statistics Division, Department of Economics & Statistics, Thiruvananthapuram}}</ref>!! % | !2020<ref name="2020data">{{cite web |title=Annual Vital Statistics Report – 2020, Page Number 109 |url=https://ecostat.kerala.gov.in/storage/publications/534.pdf |access-date=8 July 2022 |publisher=Government of Kerala, Vital Statistics Division, Department of Economics & Statistics, Thiruvananthapuram}}</ref>!! % | ||
!2019<ref name=2019data>{{cite web|url=http://www.ecostat.kerala.gov.in/images/pdf/publications/Vital_Statistics/data/vital_statistics_2019.pdf|title=Annual Vital Statistics Report – 2019, Page Number 100|publisher=Government of Kerala, Vital Statistics Division Department of Economics & Statistics Thiruvananthapuram|access-date=24 August 2020|archive-date=7 June 2016|archive-url=https://web.archive.org/web/20160607065625/http://www.ecostat.kerala.gov.in/index.php/reports/vital-statistics-reports.html|url-status=dead}}</ref> !! % | !2019<ref name=2019data>{{cite web|url=http://www.ecostat.kerala.gov.in/images/pdf/publications/Vital_Statistics/data/vital_statistics_2019.pdf|title=Annual Vital Statistics Report – 2019, Page Number 100|publisher=Government of Kerala, Vital Statistics Division Department of Economics & Statistics Thiruvananthapuram|access-date=24 August 2020|archive-date=7 June 2016|archive-url=https://web.archive.org/web/20160607065625/http://www.ecostat.kerala.gov.in/index.php/reports/vital-statistics-reports.html|url-status=dead}}</ref> !! % | ||
!2018<ref name=2018data>{{cite web|url=http://www.ecostat.kerala.gov.in/images/pdf/publications/Vital_Statistics/data/vital_statistics_2018.pdf|title=Annual Vital Statistics Report – 2018, Page Number 92|publisher=Government of Kerala, Vital Statistics Division Department of Economics & Statistics Thiruvananthapuram|access-date=24 August 2020|archive-date=2 November 2021|archive-url=https://web.archive.org/web/20211102023933/http://www.ecostat.kerala.gov.in/images/pdf/publications/Vital_Statistics/data/vital_statistics_2018.pdf|url-status=dead}}</ref> !! % | !2018<ref name=2018data>{{cite web|url=http://www.ecostat.kerala.gov.in/images/pdf/publications/Vital_Statistics/data/vital_statistics_2018.pdf|title=Annual Vital Statistics Report – 2018, Page Number 92|publisher=Government of Kerala, Vital Statistics Division Department of Economics & Statistics Thiruvananthapuram|access-date=24 August 2020|archive-date=2 November 2021|archive-url=https://web.archive.org/web/20211102023933/http://www.ecostat.kerala.gov.in/images/pdf/publications/Vital_Statistics/data/vital_statistics_2018.pdf|url-status=dead}}</ref> !! % | ||
!2017<ref>{{cite web|url=http://www.ecostat.kerala.gov.in/images/pdf/publications/Vital_Statistics/data/vital_statistics_2017.pdf|title=Annual Vital Statistics Report – 2017, Page Number 90|publisher=Government of Kerala, Vital Statistics Division Department of Economics & Statistics Thiruvananthapuram|access-date=20 June 2019}}</ref> | !2017<ref>{{cite web|url=http://www.ecostat.kerala.gov.in/images/pdf/publications/Vital_Statistics/data/vital_statistics_2017.pdf|title=Annual Vital Statistics Report – 2017, Page Number 90|publisher=Government of Kerala, Vital Statistics Division Department of Economics & Statistics Thiruvananthapuram|access-date=20 June 2019|archive-date=20 June 2019|archive-url=https://web.archive.org/web/20190620141704/http://www.ecostat.kerala.gov.in/images/pdf/publications/Vital_Statistics/data/vital_statistics_2017.pdf|url-status=dead}}</ref> | ||
!%!! 2016<ref>http://www.ecostat.kerala.gov.in/images/pdf/publications/Vital_Statistics/data/vital_statistics_2016.pdf {{ | !%!! 2016<ref>[http://www.ecostat.kerala.gov.in/images/pdf/publications/Vital_Statistics/data/vital_statistics_2016.pdf Vital statistics 2016] kerala.gov.in {{Webarchive|url=https://web.archive.org/web/20210424210733/http://www.ecostat.kerala.gov.in/images/pdf/publications/Vital_Statistics/data/vital_statistics_2016.pdf |date=24 April 2021 }}</ref> !! % !!2015<ref>{{cite web |url=http://www.ecostat.kerala.gov.in/docs/pdf/reports/vs/annualvitalstat_2015.pdf |title=Annual Vital Statistics Report – 2015, Page Number 21 |publisher=Government of Kerala, Vital Statistics Division Department of Economics & Statistics Thiruvananthapuram |accessdate=24 May 2017 |archive-date=21 June 2017 |archive-url=https://web.archive.org/web/20170621062411/http://ecostat.kerala.gov.in/docs/pdf/reports/vs/annualvitalstat_2015.pdf |url-status=dead }}</ref> !! % !! 2014<ref>{{cite web |url=http://www.ecostat.kerala.gov.in/docs/pdf/reports/vs/annualvitalstat_2014.pdf |title=Annual Vital Statistics Report – 2014, Page Number 22 |publisher=Government of Kerala, Vital Statistics Division Department of Economics & Statistics Thiruvananthapuram |accessdate=1 June 2016 |archive-date=12 November 2016 |archive-url=https://web.archive.org/web/20161112013826/http://www.ecostat.kerala.gov.in/docs/pdf/reports/vs/annualvitalstat_2014.pdf |url-status=dead }}</ref> !! % !! 2013<ref>{{cite web |url=http://www.ecostat.kerala.gov.in/docs/pdf/reports/vs/annualvitalstat_2013.pdf |title=Annual Vital Statistics Report – 2013, Page Number 22 |publisher=Government of Kerala, Vital Statistics Division Department of Economics & Statistics Thiruvananthapuram |accessdate=1 July 2015 |archive-date=6 February 2017 |archive-url=https://web.archive.org/web/20170206103819/http://www.ecostat.kerala.gov.in/docs/pdf/reports/vs/annualvitalstat_2013.pdf |url-status=dead }}</ref> !! % !! 2012<ref>{{cite web |url=http://www.ecostat.kerala.gov.in/docs/pdf/reports/vs/vsreport2012.pdf |title=Annual Vital Statistics Report – 2012, Table – 2.7 (a), Page Number 23 |publisher=Government of Kerala, Vital Statistics Division Department of Economics & Statistics Thiruvananthapuram |accessdate=1 November 2014 |archive-date=20 October 2016 |archive-url=https://web.archive.org/web/20161020211130/http://www.ecostat.kerala.gov.in/docs/pdf/reports/vs/vsreport2012.pdf |url-status=dead }}</ref> !! % !! 2011<ref>{{cite web |url=http://www.ecostat.kerala.gov.in/ecostat/docs/pdf/reports/vs/vsreport2011.pdf |title=Annual Vital Statistics Report – 2011, Table – 2.7 (a), Page Number 23 |publisher=Government of Kerala, Vital Statistics Division Department of Economics & Statistics Thiruvananthapuram |accessdate=1 February 2014 |archive-date=6 February 2017 |archive-url=https://web.archive.org/web/20170206103725/http://www.ecostat.kerala.gov.in/ecostat/docs/pdf/reports/vs/vsreport2011.pdf |url-status=dead }}</ref>!! % !! 2010<ref>{{cite web |url=http://www.ecostat.kerala.gov.in/docs/pdf/reports/vs/vsreport2010.pdf |title=Annual Vital Statistics Report – 2010, Table – 2.7 (a), Page Number 23-24 |publisher=Government of Kerala, Vital Statistics Division Department of Economics & Statistics Thiruvananthapuram |accessdate=1 March 2013 |archive-date=19 September 2013 |archive-url=https://web.archive.org/web/20130919063417/http://www.ecostat.kerala.gov.in/docs/pdf/reports/vs/vsreport2010.pdf |url-status=dead }}</ref> !! % !! 2009<ref>{{cite web |url=http://www.ecostat.kerala.gov.in/docs/pdf/reports/vs/vsreport2009.pdf |title=Annual Vital Statistics Report – 2009, Table – 2.7 (a), Page Number 19-20 |publisher=Government of Kerala, Vital Statistics Division Department of Economics & Statistics Thiruvananthapuram |accessdate=1 October 2011 |archive-date=19 September 2013 |archive-url=https://web.archive.org/web/20130919063205/http://www.ecostat.kerala.gov.in/docs/pdf/reports/vs/vsreport2009.pdf |url-status=dead }}</ref> !! % !! 2008<ref>{{cite web |url= http://www.ecostat.kerala.gov.in/docs/pdf/reports/vs/vsbulletin2008.pdf |title= Annual Vital Statistics Report – 2008, Table – 1.7 (a), Page Number 19-20 |publisher= Government of Kerala, Vital Statistics Division Department of Economics & Statistics Thiruvananthapuram |accessdate= 1 March 2010 |archive-date= 19 September 2013 |archive-url= https://web.archive.org/web/20130919063542/http://www.ecostat.kerala.gov.in/docs/pdf/reports/vs/vsbulletin2008.pdf |url-status= dead }}</ref> !! % !! 2007<ref>{{cite web |url=http://www.ecostat.kerala.gov.in/pdf/reports/vital_stat/bulletin_07.pdf |title=Annual Vital Statistics Report – 2007, Table – 1.7 (a), Page Number 16 |publisher=Government of Kerala, Vital Statistics Division Department of Economics & Statistics Thiruvananthapuram |accessdate=1 June 2009 |archive-date=23 March 2012 |archive-url=https://web.archive.org/web/20120323122536/http://www.ecostat.kerala.gov.in/pdf/reports/vital_stat/bulletin_07.pdf |url-status=dead }}</ref> !! % !! 2006<ref>{{cite web |url=http://www.ecostat.kerala.gov.in/images/pdf/publications/Vital_Statistics/data/vital_statistics_2006.pdf |title=Annual Vital Statistics Report – 2006, Table – 1.7 (a), Page Number 34 |publisher=Government of Kerala, Vital Statistics Division Department of Economics & Statistics Thiruvananthapuram |access-date=26 August 2020 |archive-date=26 April 2021 |archive-url=https://web.archive.org/web/20210426192829/http://www.ecostat.kerala.gov.in/images/pdf/publications/Vital_Statistics/data/vital_statistics_2006.pdf |url-status=dead }}</ref> !! % !! 2005<ref>{{cite web |url=http://www.ecostat.kerala.gov.in/images/pdf/publications/Vital_Statistics/data/vital_statistics_2005.pdf |title=Annual Vital Statistics Report – 2005, Table – 1.7 (a), Page Number 28 |publisher=Government of Kerala, Vital Statistics Division Department of Economics & Statistics Thiruvananthapuram |access-date=26 August 2020 |archive-date=10 January 2020 |archive-url=https://web.archive.org/web/20200110161845/http://www.ecostat.kerala.gov.in/images/pdf/publications/Vital_Statistics/data/vital_statistics_2005.pdf |url-status=dead }}</ref> !! % | ||
|- | |- | ||
|''Muslim'' | |''Muslim'' | ||
|1,76,312 | |||
|44.84% | |||
|2,00,325 | |||
|45.22% | |||
|169,296||40.33%||196,138||43.89%|| 212,933 || 44.35% || 213,805 || 43.80% || 216,525 || 43.00% || 211,182 || 42.55% || 213,865 || 41.45% || 218,437 || 40.87%|| 214,257 || 39.96%|| 175,892|| 31.96% || 214,099 || 38.21% || 209,276 || 38.26% || 204,711 || 37.61% || 194,583 || 36.32% || 183,796 || 33.71% || 196,493 || 35.32% || 191,675 || 34.28% | |169,296||40.33%||196,138||43.89%|| 212,933 || 44.35% || 213,805 || 43.80% || 216,525 || 43.00% || 211,182 || 42.55% || 213,865 || 41.45% || 218,437 || 40.87%|| 214,257 || 39.96%|| 175,892|| 31.96% || 214,099 || 38.21% || 209,276 || 38.26% || 204,711 || 37.61% || 194,583 || 36.32% || 183,796 || 33.71% || 196,493 || 35.32% || 191,675 || 34.28% | ||
|- | |- | ||
|''Hindu'' | |''Hindu'' | ||
|1,58,399 | |||
|40.28% | |||
|1,77,037 | |||
|39.96% | |||
|181,396||43.21%||185,411||41.49%|| 197,061 || 41.04% ||203,158 || 41.61% || 210,071 || 41.71% || 207,831 ||41.88%|| 221,220 ||42.87% || 231,031 ||43.23% ||236,420 ||44.08% ||214,591 || 38.99% || 248,610 || 44.37% || 246,297 || 45.03% || 247,707 || 45.51% || 241,305 || 45.04% || 250,094 || 45.88% || 258,119 || 46.40% || 262,976 || 47.04% | |181,396||43.21%||185,411||41.49%|| 197,061 || 41.04% ||203,158 || 41.61% || 210,071 || 41.71% || 207,831 ||41.88%|| 221,220 ||42.87% || 231,031 ||43.23% ||236,420 ||44.08% ||214,591 || 38.99% || 248,610 || 44.37% || 246,297 || 45.03% || 247,707 || 45.51% || 241,305 || 45.04% || 250,094 || 45.88% || 258,119 || 46.40% || 262,976 || 47.04% | ||
|- | |- | ||
|''Christian'' | |''Christian'' | ||
|56,810 | |||
|14.47% | |||
|64,168 | |||
|14.48% | |||
|59,766||14.24%||62,265||13.93%|| 68,596 || 14.29% ||69,844 ||14.31%|| 75,335 || 14.96%|| 76,205 || 15.35%|| 79,565 || 15.42% || 83,616 || 15.65% || 84,660 || 15.78% || 102,546 || 18.63% || 94,664 || 16.90% || 88,936 || 16.26% || 90,451 || 16.62% || 94,175 || 17.58% || 98,220 || 18.02% || 96,469 || 17.34% || 98,353 || 17.59% | |59,766||14.24%||62,265||13.93%|| 68,596 || 14.29% ||69,844 ||14.31%|| 75,335 || 14.96%|| 76,205 || 15.35%|| 79,565 || 15.42% || 83,616 || 15.65% || 84,660 || 15.78% || 102,546 || 18.63% || 94,664 || 16.90% || 88,936 || 16.26% || 90,451 || 16.62% || 94,175 || 17.58% || 98,220 || 18.02% || 96,469 || 17.34% || 98,353 || 17.59% | ||
|- | |- | ||
|''Others'' | |''Others'' | ||
|1,294 | |||
|0.33% | |||
|1,235 | |||
|0.28% | |||
|9,143||2.18%||2,967||0.66%|| 1,408 || 0.29% || 1,214 || 0.25% ||1,497 ||0.30%|| 852|| 0.18%|| 933|| 0.18% || 1,178 || 0.22% || 869 || 0.16% || 57,215 || 10.39% || 2,671 || 0.48% || 651 || 0.12% || 704 || 0.13% || 5,151 || 0.96% || 6,108 || 1.12% || 1,545 || 0.28% || 1,098 || 0.19% | |9,143||2.18%||2,967||0.66%|| 1,408 || 0.29% || 1,214 || 0.25% ||1,497 ||0.30%|| 852|| 0.18%|| 933|| 0.18% || 1,178 || 0.22% || 869 || 0.16% || 57,215 || 10.39% || 2,671 || 0.48% || 651 || 0.12% || 704 || 0.13% || 5,151 || 0.96% || 6,108 || 1.12% || 1,545 || 0.28% || 1,098 || 0.19% | ||
|- | |- | ||
|''Not Stated'' | |''Not Stated'' | ||
|166||0.04%||110||0.02%|| 115 || 0.02% ||153 ||0.03%|| 169 || 0.03%|| 222 || 0.04%|| 430 || 0.08% || 196 || 0.03% || 146 || 0.02% || 167 || 0.03% || 224 || 0.04% || 1,806 || 0.33% || 775 || 0.14% || 524 || 0.10% || 6,936 || 1.27% || 3,700 || 0.66% || 4,980 || 0.89% | |416 | ||
|0.11% | |||
|267 | |||
|0.06% | |||
|166||0.04%||110||0.02%|| 115 || 0.02% ||153 ||0.03%|| 169 || 0.03%|| 222 || 0.04%|| 430 || 0.08% || 196 || 0.03% || 146 || 0.02% || 167 || 0.03% || 224 || 0.04% || 1,806 || 0.33% || 775 || 0.14% || 524 || 0.10% || 6,936 || 1.27% || 3,700 || 0.66% || 4,980 || 0.89% | |||
|- | |- | ||
|'''Total''' | |'''Total''' | ||
|'''419,767'''||'''100%'''||'''446,891'''||'''100%'''||'''480,113'''||'''100%'''||'''488,174'''||'''100%'''||'''503,588'''||'''100%'''||'''496,292'''||'''100%'''||'''516,013'''||'''100%'''||'''534,458'''||'''100%'''||'''536,352'''||'''100%'''||'''550,411'''||'''100%'''||'''560,268'''||'''100%'''||'''546,964'''||'''100%'''||'''544,348'''||'''100%'''|| '''535,738''' || '''100%''' || '''545,154''' || '''100%''' || '''556,326''' || '''100%''' || '''559,082''' || '''100%''' | |'''3,93,231''' | ||
|'''100%''' | |||
|'''443032''' | |||
|'''100%''' | |||
|'''419,767'''||'''100%'''||'''446,891'''||'''100%'''||'''480,113'''||'''100%'''||'''488,174'''||'''100%'''||'''503,588'''||'''100%'''||'''496,292'''||'''100%'''||'''516,013'''||'''100%'''||'''534,458'''||'''100%'''||'''536,352'''||'''100%'''||'''550,411'''||'''100%'''||'''560,268'''||'''100%'''||'''546,964'''||'''100%'''||'''544,348'''||'''100%'''|| '''535,738''' || '''100%''' || '''545,154''' || '''100%''' || '''556,326''' || '''100%''' || '''559,082''' || '''100%''' | |||
|} | |} | ||
| Line 880: | Line 931: | ||
# Nilambur – 18.34 per 1,000 | # Nilambur – 18.34 per 1,000 | ||
'''Vital stats for the year 2011''':<ref name="kerala1">{{cite web|url=http://www.ecostat.kerala.gov.in/docs/pdf/reports/vs/vsreport2011.pdf|title=Annual Vital Statistics Report 2011|publisher=Ecostat.kerala.gov.in|access-date=20 May 2015}}</ref> | '''Vital stats for the year 2011''':<ref name="kerala1">{{cite web|url=http://www.ecostat.kerala.gov.in/docs/pdf/reports/vs/vsreport2011.pdf|title=Annual Vital Statistics Report 2011|publisher=Ecostat.kerala.gov.in|access-date=20 May 2015|archive-date=23 September 2015|archive-url=https://web.archive.org/web/20150923233324/http://www.ecostat.kerala.gov.in/docs/pdf/reports/vs/vsreport2011.pdf|url-status=dead}}</ref> | ||
{|class="wikitable" | {|class="wikitable" | ||
| Line 924: | Line 975: | ||
|0.72% | |0.72% | ||
|} | |} | ||
* In 2007, 61.55% of the deaths were reported from Hindus, 17.50% from Muslims and, 19.75% from Christians.<ref name="ecostat.kerala.gov.in">{{cite web|url=http://www.ecostat.kerala.gov.in/pdf/reports/vital_stat/bulletin_07.pdf|title=Annual Vital Statistics Report 2007|publisher=Ecostat.kerala.gov.in|access-date=20 May 2015|archive-date=23 March 2012|archive-url=https://web.archive.org/web/20120323122536/http://www.ecostat.kerala.gov.in/pdf/reports/vital_stat/bulletin_07.pdf|url-status=dead}}</ref> | |||
*In 2007, 61.55% of the deaths were reported from Hindus, 17.50% from Muslims and, 19.75% from Christians.<ref name="ecostat.kerala.gov.in">{{cite web|url=http://www.ecostat.kerala.gov.in/pdf/reports/vital_stat/bulletin_07.pdf|title=Annual Vital Statistics Report 2007|publisher=Ecostat.kerala.gov.in|access-date=20 May 2015|archive-date=23 March 2012|archive-url=https://web.archive.org/web/20120323122536/http://www.ecostat.kerala.gov.in/pdf/reports/vital_stat/bulletin_07.pdf|url-status=dead}}</ref> | |||
* In 2008, 61.01% of the deaths were reported from Hindus, 17.82% from Muslims and, 20.06% from Christians.<ref name="cr.lsgkerala.gov.in">{{cite web|url=http://www.cr.lsgkerala.gov.in/Docs/AnnualVitalStatisticalReport_2008.pdf|title=Annual Vital Statistics Report 2008|publisher=Ecostat.kerala.gov.in|access-date=20 May 2015}}</ref> | * In 2008, 61.01% of the deaths were reported from Hindus, 17.82% from Muslims and, 20.06% from Christians.<ref name="cr.lsgkerala.gov.in">{{cite web|url=http://www.cr.lsgkerala.gov.in/Docs/AnnualVitalStatisticalReport_2008.pdf|title=Annual Vital Statistics Report 2008|publisher=Ecostat.kerala.gov.in|access-date=20 May 2015}}</ref> | ||
* In 2010, 60.79% of the deaths were reported from Hindus, 18.31% from Muslims and, 20.36% from Christians.<ref name="ecostat.kerala.gov.in 2">{{cite web|url=http://www.ecostat.kerala.gov.in/docs/pdf/reports/vs/vsreport2010.pdf|title=Annual Vital Statistics Report 2010|publisher=Ecostat.kerala.gov.in|access-date=20 May 2015}}</ref> | * In 2010, 60.79% of the deaths were reported from Hindus, 18.31% from Muslims and, 20.36% from Christians.<ref name="ecostat.kerala.gov.in 2">{{cite web|url=http://www.ecostat.kerala.gov.in/docs/pdf/reports/vs/vsreport2010.pdf|title=Annual Vital Statistics Report 2010|publisher=Ecostat.kerala.gov.in|access-date=20 May 2015|archive-date=19 September 2013|archive-url=https://web.archive.org/web/20130919063417/http://www.ecostat.kerala.gov.in/docs/pdf/reports/vs/vsreport2010.pdf|url-status=dead}}</ref> | ||
* In 2011, 60.45% of the deaths were reported from Hindus, 18.48% from Muslims and, 20.56% from Christians.<ref name="kerala1"/> | * In 2011, 60.45% of the deaths were reported from Hindus, 18.48% from Muslims and, 20.56% from Christians.<ref name="kerala1"/> | ||
* In 2018, 60.54% of the deaths were reported from Hindus, 19.15% from Muslims and, 19.86% from Christians.<ref name=2018data/> | * In 2018, 60.54% of the deaths were reported from Hindus, 19.15% from Muslims and, 19.86% from Christians.<ref name=2018data/> | ||
| Line 943: | Line 993: | ||
! Districts !! Population !! Males !!%!! Females !!% | ! Districts !! Population !! Males !!%!! Females !!% | ||
|- | |- | ||
| [[Kasargod district|Kasargod]] || 1,307,375 || 628,613||48.1% || 678,762||51.9% | | [[Kasargod district|Kasargod]] || 1,307,375 || 628,613||48.1% || 678,762||51.9% | ||
|- | |- | ||
| [[Kannur district|Kannur]] || 2,523,003 || 1,181,446||46.8% || 1,341,557||'''53.2'''% | | [[Kannur district|Kannur]] || 2,523,003 || 1,181,446||46.8% || 1,341,557||'''53.2'''% | ||
|- | |- | ||
| [[Wayanad district|Wayanad]] || 817,420 || 401,684||49.1% || 415,736||50.9% | | [[Wayanad district|Wayanad]] || 817,420 || 401,684||49.1% || 415,736||50.9% | ||
|- | |- | ||
| [[Kozhikode district|Kozhikode]] || 3,086,293 || 1,470,942||47.7% || 1,615,351||52.3% | | [[Kozhikode district|Kozhikode]] || 3,086,293 || 1,470,942||47.7% || 1,615,351||52.3% | ||
|- | |- | ||
| [[Malappuram district|Malappuram]] || 4,112,920 || '''1,960,328'''||47.7% || '''2,152,592'''||52.3% | | [[Malappuram district|Malappuram]] || 4,112,920 || '''1,960,328'''||47.7% || '''2,152,592'''||52.3% | ||
|- | |- | ||
| [[Palakkad district|Palakkad]] || 2,809,934 || 1,359,478||48.4% || 1,450,456||51.6% | | [[Palakkad district|Palakkad]] || 2,809,934 || 1,359,478||48.4% || 1,450,456||51.6% | ||
|- | |- | ||
| [[Thrissur district|Thrissur]] || 3,121,200 || 1,480,763||47.4% || 1,640,437||52.6% | | [[Thrissur district|Thrissur]] || 3,121,200 || 1,480,763||47.4% || 1,640,437||52.6% | ||
|- | |- | ||
| [[Ernakulam district|Ernakulam]] || 3,282,388 || 1,619,557||49.3% || 1,662,831||50.7% | | [[Ernakulam district|Ernakulam]] || 3,282,388 || 1,619,557||49.3% || 1,662,831||50.7% | ||
|- | |- | ||
| [[Idukki district|Idukki]] || 1,108,974 || 552,808||'''49.8'''% || 556,166||50.2% | | [[Idukki district|Idukki]] || 1,108,974 || 552,808||'''49.8'''% || 556,166||50.2% | ||
|- | |- | ||
| [[Kottayam district|Kottayam]] || 1,974,551 || 968,289||49% || 1,006,262||51% | | [[Kottayam district|Kottayam]] || 1,974,551 || 968,289||49% || 1,006,262||51% | ||
|- | |- | ||
| [[Alappuzha district|Alappuzha]] || 2,127,789 || 1,013,142||47.6% || 1,114,647||52.4% | | [[Alappuzha district|Alappuzha]] || 2,127,789 || 1,013,142||47.6% || 1,114,647||52.4% | ||
|- | |- | ||
| [[Pathanamthitta district|Pathanamthitta]] || 1,197,412 || 561,716||46.8% ||635,696||'''53.2'''% | | [[Pathanamthitta district|Pathanamthitta]] || 1,197,412 || 561,716||46.8% ||635,696||'''53.2'''% | ||
|- | |- | ||
| [[Kollam district|Kollam]] || 2,635,375 || 1,246,968||47.3% || 1,388,407||52.7% | | [[Kollam district|Kollam]] || 2,635,375 || 1,246,968||47.3% || 1,388,407||52.7% | ||
|- | |- | ||
| [[Thiruvananthapuram district|Thiruvananthapuram]] || 3,301,427 || 1,581,678||47.9% || 1,719,749||52.1% | | [[Thiruvananthapuram district|Thiruvananthapuram]] || 3,301,427 || 1,581,678||47.9% || 1,719,749||52.1% | ||
|} | |} | ||
| Line 976: | Line 1,026: | ||
|- | |- | ||
!Year | !Year | ||
!Infant | !Infant | ||
Mortality | Mortality | ||
| Line 996: | Line 1,046: | ||
(per 1000) | (per 1000) | ||
!Maternal | !Maternal | ||
Mortality Rate | Mortality Rate | ||
| Line 1,002: | Line 1,052: | ||
100000 live birth) | 100000 live birth) | ||
!Total | !Total | ||
Fertility | Fertility | ||
| Line 1,167: | Line 1,217: | ||
In 1991, Kerala had the lowest TFR (Children born per women) in the whole of India. Hindus had a TFR of 1.66, Christians had 1.78 and Muslims had 2.97. In 2000, the TFR was 1.73 with Muslims having 2.28, [[Nair]]s having a TFR of 1.47 and Syrian Christians having TFR of 1.55. TFR for Scheduled Castes was 1.52 in 1997–98 and 1.37 in 1992–93. The lowest Fertility rate recorded anywhere in India is TFR of 1.17 for Vettuvan caste in Kerala.<ref>{{cite journal |doi=10.1023/B:POPU.0000020963.63244.8c| title=An Analysis of Fertility Differentials by Religion in Kerala State: A Test of the Interaction Hypothesis | year=2003 | last1=Alagarajan | first1=Manoj | journal=Population Research and Policy Review | volume=22 | issue=5/6 | pages=557–574 | s2cid=154895913 }}</ref> | In 1991, Kerala had the lowest TFR (Children born per women) in the whole of India. Hindus had a TFR of 1.66, Christians had 1.78 and Muslims had 2.97. In 2000, the TFR was 1.73 with Muslims having 2.28, [[Nair]]s having a TFR of 1.47 and Syrian Christians having TFR of 1.55. TFR for Scheduled Castes was 1.52 in 1997–98 and 1.37 in 1992–93. The lowest Fertility rate recorded anywhere in India is TFR of 1.17 for Vettuvan caste in Kerala.<ref>{{cite journal |doi=10.1023/B:POPU.0000020963.63244.8c| title=An Analysis of Fertility Differentials by Religion in Kerala State: A Test of the Interaction Hypothesis | year=2003 | last1=Alagarajan | first1=Manoj | journal=Population Research and Policy Review | volume=22 | issue=5/6 | pages=557–574 | s2cid=154895913 }}</ref> | ||
As per the 2011 Census, the fertility rate per community is as Hindu: 1.544 children per woman, Muslim: 2.351 and Christian: 1.716. For SC, the fertility is 1.485 and for ST, it is 1.629.<ref name="censusindia">http://www.censusindia.gov.in/2011census/F-series/f10/2011-F10-32-MDDS.XLS {{ | As per the 2011 Census, the fertility rate per community is as Hindu: 1.544 children per woman, Muslim: 2.351 and Christian: 1.716. For SC, the fertility is 1.485 and for ST, it is 1.629.<ref name="censusindia">[http://www.censusindia.gov.in/2011census/F-series/f10/2011-F10-32-MDDS.XLS 2011 Census] censusindia.gov.in {{Webarchive|url=https://web.archive.org/web/20181221094733/http://www.censusindia.gov.in/2011census/F-series/f10/2011-F10-32-MDDS.XLS |date=21 December 2018 }}</ref> | ||
For Hindus, the TFR is highest in Wayanad (1.710) and lowest in Thiruvananthapuram (1.435). For the Muslims, it is Kannur (2.779) and Pathanamthitta (1.707), while for the Christians the respective districts are Kasaragod (1.929) and Kollam (1.539).<ref name="censusindia" /> | For Hindus, the TFR is highest in Wayanad (1.710) and lowest in Thiruvananthapuram (1.435). For the Muslims, it is Kannur (2.779) and Pathanamthitta (1.707), while for the Christians the respective districts are Kasaragod (1.929) and Kollam (1.539).<ref name="censusindia" /> | ||
| Line 1,195: | Line 1,245: | ||
{{DEFAULTSORT:Demographics Of Kerala}} | {{DEFAULTSORT:Demographics Of Kerala}} | ||
[[Category:Kerala | [[Category:Society of Kerala|*]] | ||
[[Category:Demographics of India by state or union territory|Kerala]] | [[Category:Demographics of India by state or union territory|Kerala]] | ||
[[Category:Kerala-related lists]] | [[Category:Kerala-related lists]] | ||
Latest revision as of 00:44, 26 February 2026
| Demographics of Kerala | |
|---|---|
.png) Population pyramid taken from the 2011 census | |
| Population | 33.4 million |
| Density | 859 per sq.km |
| Growth rate | 3.31% yearly (2021 estimate) |
| Birth rate | 11.06 per 1000 pop. (2023 estimate) [1] |
| Death rate | 8.56 per 1000 pop. (2023 estimate) [2] |
| Life expectancy | |
| • male | 75 years |
| • female | 80.15 years |
| Fertility rate | 1.35 births per woman (2023 estimate) [3] |
| Infant mortality | 5.26 per 1000 live births (2023 estimate) [4] |
| Net migration rate | −0.08 per 1000 (2019 estimate) |
| Age structure | |
| 0–14 years | 19% |
| 15–64 years | 70% |
| 65 and over | 12% |
| Sex ratio | |
| Total | 0.97 males/female |
| At birth | 1.04 males/female |
Kerala is a state in south-western India. Most of Kerala's 33.4 million people (as per 2011 census) are ethnically Malayalis (Malayalam speakers).[5] Additional ancestries derive from millennia of trade links across the Arabian Sea, whereby people of Arab, Jewish, Syriac, Portuguese, English, Chinese and other ethnic groups settled in Kerala. Many of these immigrants intermarried with native Malayalam speakers resulting in formation of many Muslim and Christian groups in Kerala.[6][7] Some Muslims and Christians thus trace their lineage to Middle Eastern and European settlers who mixed with the native population.
Malayalam is Kerala's official language and is spoken by at least 97% of the people of Kerala; the next most common language is English. Tamil is spoken mainly in the districts bordering Tamil Nadu, especially Idukki and Palakkad. Tulu is spoken in the northern parts of Kasaragod district. In addition, Kerala is home to 321,000 indigenous tribal Adivasis (1.10% of the populace).[8] Some 63% of tribals reside in the eastern districts of Wayanad (where 35.82% are tribals), Palakkad (1.02%), and Idukki (15.66%).[9] These groups, including the Paniyars, Mooppans, Irulars, Kurumbars, and Mudugars,[10] speak their own native languages.[11][12][13] Cholanaikkan tribe in the Silent Valley National Park were contacted only in the 1970s and they are the most isolated tribe in the state.[14]
Population[edit | edit source]
| Population density of Kerala | |

| |
| Kerala's districts, shaded by population density (inhabitants per km2) | |
| Source:[15] | |
Kerala is home to 2.76% of India's population, and at 859 persons per km2;[16] its land is three times as densely settled as the rest of India. Kerala's western coastal regions are the most densely settled with population of 2,022 persons per km2, 2.5 times the overall population density of the state, 859 persons per km2, leaving the eastern hills and mountains comparatively sparsely populated.[17] However, Kerala's population growth rate is far lower than the national average, although Kerala's population more than doubled between 1951 and 1991 – adding 15.6 million people to reach a total of 29.1 million residents in 1991 – the population stood at 31.8 million by 2001 and 33.3 million in 2011.[16] Kerala's people are most densely settled in the coastal region, leaving the eastern hills and mountains comparatively sparsely populated.[citation needed] Kerala is the second-most urbanised major state in the country with 47.7% urban population according to the 2011 Census of India.[18]
Hinduism is followed by the majority of Keralites (54.7%). The major religions followed in Kerala are Hinduism (54.7% — Hinduism in Kerala), Islam (26.6%) and Christianity (18.4%).[19]
Kerala also had a tiny Jewish population until recently, said to date from 587 BC when they fled the occupation of Jerusalem by Nebuchadnezzar.[20] The 2001 Indian census recorded only 51 Jews in Kerala. The Paradesi Synagogue in Kochi is the oldest synagogue in the Commonwealth of Nations.[21]
The state has many famous temples, mosques, and churches. The oldest church in India is found in Kerala, believed to be established by St. Thomas, the disciple of Jesus Christ and the Cheramaan Juma Mosque is considered to be the oldest mosque in the Indian subcontinent which was built by an Islamic missionary Malik Dinar.[citation needed]
| Year | Population | Decadal growth |
|---|---|---|
| 2011 | 33,406,061 | 4.91 |
| 2001 | 31,841,374 | 9.43 |
| 1991 | 29,098,518 | 14.32 |
| 1981 | 25,453,680 | 19.24 |
| 1971 | 21,347,375 | 26.29 |
| 1961 | 16,903,715 | 24.76 |
| 1951 | 13,549,118 | 22.82 |
| 1941 | 11,031,541 | 16.04 |
| 1931 | 9,507,050 | 21.85 |
| 1921 | 7,802,127 | 9.16 |
| 1911 | 7,147,673 | 11.75 |
| 1901 | 6,392,620 | – |
Population graph of Kerala from 2005 to 20[edit | edit source]
<graph>{"version":2,"width":558,"height":361.4,"data":[{"name":"table","values":[{"x":1901,"y":6396262},{"x":1911,"y":7147673},{"x":1999,"y":7802127},{"x":1931,"y":9507050},{"x":1941,"y":11031541},{"x":1951,"y":13549118},{"x":1961,"y":16903715},{"x":1971,"y":21347375},{"x":1981,"y":25453680},{"x":1991,"y":29098518},{"x":2001,"y":31841374},{"x":2011,"y":33406061}]}],"scales":[{"name":"x","type":"linear","range":"width","zero":false,"domain":{"data":"table","field":"x"}},{"name":"y","type":"linear","range":"height","nice":true,"domain":{"data":"table","field":"y"}}],"axes":[{"type":"x","scale":"x"},{"type":"y","scale":"y"}],"marks":[{"type":"area","from":{"data":"table"},"properties":{"enter":{"x":{"scale":"x","field":"x"},"y":{"scale":"y","field":"y"},"y2":{"scale":"y","value":10},"interpolate":{"value":"monotone"},"fill":{"value":"steelblue"}}}}]}</graph> Source:[22]
Features[edit | edit source]

Social development[edit | edit source]
Kerala ranks highest in India with respect to social development indices such as elimination of poverty, primary education and healthcare. This resulted from significant efforts begun in 1911 by the erstwhile Princely states of Cochin and Travancore to boost healthcare and education among the people. This central focus – deemed unusual in India – was then maintained after Kerala's post-independence inauguration as a state.[25] Thus, Kerala has the highest literacy rate in India of 93.91% (2011);[26] and life expectancy is now the highest in India. The suicide rates in Kerala are the highest in India.[27] As per the 2011 census, Kerala and Puducherry are the only domiciles in India with a female-to-male ratio higher than 0.99. The ratio for Kerala is 1.084 – 1084 females per 1000 males – while the national figure is 0.940.[28] It is also one of the states in India to have sub-replacement fertility.[29]
UNICEF and the World Health Organization (WHO) designated Kerala as the world's first "baby-friendly state" via its "Baby Friendly Hospital Initiative". The state is also known for Ayurveda, a traditional system of medicine – this traditional expertise is currently drawing increasing numbers of medical tourists. However, drawbacks to this situation includes the population's steady ageing – indeed, 11.2% of Keralites are age 60 or over.[25]
Kerala's unusual socioeconomic and demographic situation was summarised by author and environmentalist Bill McKibben:[30]
Expatriation and Emigration[edit | edit source]
As of 2011, a total of 2,280,000 Keralites reside outside India. Largest populations are found in UAE (883,313) and US (68,076).[31]
The major concentrations of expat Keralites are in the following nations: (figures as of 2011)[32]
- UAE – 883,313
- United States – 68,076 (mainly U.S. Citizens)
- KSA – 574,739
- Oman – 195,300
- Qatar – 410,000
- Kuwait – 127,782
- Bahrain – 216,000
- United Kingdom – 44,640
- Canada – 28,000
- Australia – 50,000
- Portugal – 2,000
- Italy – 25,000
- Germany – 10,000
Diversity[edit | edit source]
There are more than 2,500,000 recent migrants living in Kerala,[33] mostly from Assam and West Bengal, constituting more than 8% of the population. There are also migrants from Bihar, Jharkhand, Chhattisgarh, Orissa, and the North East.[34][33][35]
Studies indicate that by the time of 2026 state elections, migrants will become a crucial voting block in many of the constituencies in Thiruvananthapuram, Kollam, Kochi, Kozhikode, Thrissur and Kannur districts.[36]
Lists[edit | edit source]
Urban centres[edit | edit source]
According to 2011 Census of India, Kerala has six 1.5 million-plus urban agglomerations: Kochi, Kozhikode, Kollam, Kannur, Thiruvananthapuram, and Thrissur, all of which has a population of at least 1.5 million.[37][38][39] Over a third of Keralites live in these large cities (a higher percentage than any other state), and over half the population lives in urban centres.[40]
Thiruvananthapuram is the largest city in Kerala in terms of population
| Rank | District | Pop. | |||||||
|---|---|---|---|---|---|---|---|---|---|
| 1 | Thiruvananthapuram | Thiruvananthapuram district | 968,990 | ||||||
| 2 | Kozhikode | Kozhikode district | 609,224 | ||||||
| 3 | Kochi | Ernakulam district | 602,046 | ||||||
| 4 | Kollam | Kollam district | 388,288 | ||||||
| 5 | Thrissur | Thrissur district | 315,957 | ||||||
| 6 | Kannur | Kannur district | 232,486 | ||||||
| 7 | Alappuzha | Alappuzha district | 180,856 | ||||||
| 8 | Kottayam | Kottayam district | 138,283 | ||||||
| 9 | Palakkad | Palakkad district | 131,019 | ||||||
| 10 | Manjeri | Malappuram district | 97,102 | ||||||
The above table lists Kerala cities in terms of their respective corporation statistics.
According to the 2011 Census, 7 of the top 50 most populous metropolitan areas in India belong to Kerala. They are Kochi, Kozhikode, Kollam, Malappuram, Thiruvananthapuram, Kannur and Thrissur ranking 17, 19, 21, 25, 26, 27 and 48 respectively.[39][37]
Most populous urban agglomerations[edit | edit source]
The following is a list of most populous urban agglomerations in the Kerala state of India. Population statistics indicated are as of 2011 census.[42][43][44]
(Note that this is a list of metropolitan (UA) population and does not indicate the corporation populations. Cities in India are officially ranked in terms of these numbers)
| Rank | UA | Population (2011) | Population (2001) | District |
|---|---|---|---|---|
| 1 | Kochi | 2,117,990 | 1,355,972 | Ernakulam |
| 2 | Kozhikode | 2,030,519 | 715,681 | Kozhikode |
| 3 | Thrissur | 1,854,783 | 103,122 | Thrissur |
| 4 | Malappuram | 1,698,645 | 170,409 | Malappuram |
| 5 | Thiruvananthapuram | 1,679,754 | 1,089,635 | Thiruvananthapuram |
| 6 | Kannur | 1,642,892 | 498,207 | Kannur |
| 7 | Kollam | 1,110,005 | 380,091 | Kollam |
| 8 | Cherthala | 455,408 | 141,558 | Alappuzha |
| 9 | Kayamkulam | 427,091 | 68,585 | Alappuzha |
| 10 | Kottayam | 357,533 | 172,878 | Kottayam |
| 11 | Palakkad | 293,566 | 283,369 | Palakkad |
| 12 | Alappuzha | 241,072 | 282,675 | Alappuzha |
| 13 | Ottappalam | 238,238 | 49,242 | Palakkad |
| 14 | Kanhangad | 229,706 | 129,367 | Kasaragod |
| 15 | Kasaragod | 192,761 | 75,968 | Kasaragod |
| 16 | Changanassery | 127,971 | 51,967 | Kottayam |
| 17 | Chalakkudy | 114,901 | 48,380 | Thrissur |
| 18 | Kothamangalam | 114,574 | 37,173 | Ernakulam |
Ethnic groups[edit | edit source]
The vast majority of residents of Kerala are Malayalis, but there are many smaller ethnic groups including Tuluvas, Tamils, Kannadigas, Konkanis and various tribals. In addition, as of early 2013 there are close to 2.5 million (7.5% of state population) migrant workers from other states of India in Kerala.[45]
Language[edit | edit source]
Kerala is the most unilingual state of India in which about 97% of the total population speak Malayalam as their Native language.[46] In addition, there is a significant Tamil population in Idukki district, which accounts for 17.48% of its total population.[47] Tulu and Kannada are spoken in the northern portions of Kasaragod district, each of which account for 8.77% and 4.23% of total population in the district respectively.[47][48] Konkani speakers are scattered throughout with major concentration in Kochi and Kasargod. Kochi also as a few Gujarati and Kacchhi speakers. There are also various minor tribal languages like Irula, Kuruma, Malavedan, Kanikkaran, Kurichiya etc found in the mountainous regions particularly in Wayanad and Idukki. Dakhini Urdu is spoken In Manjeshwar, Uppala and Kasaragod by the muslim population.
Religion[edit | edit source]
Hindus constitute 54.7% of the population of Kerala, followed by Islam with 26.6% population and Christianity at third with 18.4% population as per 2011 census.
| Census Year |
Hindus | Decadal Growth rate (%) | Muslims | Decadal Growth rate (%) | Christians | Decadal Growth rate (%) | Total Population |
Decadal Growth rate (%) | ||||
|---|---|---|---|---|---|---|---|---|---|---|---|---|
| 1901 | 4,378,305 | 68.5% | N/A | 1,119,473 | 17.5% | N/A | 891,767 | 13.9% | N/A | 6,389,545 | 100.0% | N/A |
| 1911 | 4,762,393 | 66.8% | +8.77 | 1,263,602 | 17.7% | +12.87 | 1,101,289 | 15.5% | +23.50 | 7,127,284 | 100.0% | +11.55 |
| 1921 | 5,052,039 | 64.9% | +6.08 | 1,360,180 | 17.5% | +7.64 | 1,376,354 | 17.7% | +24.98 | 7,788,573 | 100.0% | +9.28 |
| 1931 | 6,021,982 | 63.4% | +19.20 | 1,624,112 | 17.1% | +19.40 | 1,856,024 | 19.5% | +34.85 | 9,502,118 | 100.0% | +22.00 |
| 1941 | 6,699,600 | 61.8% | +11.25 | 1,883,786 | 17.4% | +11.60 | 2,263,888 | 20.9% | +21.98 | 10,847,274 | 100.0% | +14.16 |
| 1951 | 8,344,351 | 61.6% | +24.55 | 2,374,598 | 17.5% | +26.05 | 2,825,720 | 20.9% | +24.82 | 13,544,669 | 100.0% | +24.87 |
| 1961 | 10,282,568 | 60.9% | +23.23 | 3,027,639 | 17.9% | +27.50 | 3,587,365 | 21.2% | +26.95 | 16,897,572 | 100.0% | +24.75 |
| 1971 | 12,683,277 | 59.4% | +23.35 | 4,162,718 | 19.5% | +37.49 | 4,494,089 | 21.1% | +25.28 | 21,340,084 | 100.0% | +26.29 |
| 1981 | 14,801,347 | 58.2% | +16.70 | 5,409,687 | 21.3% | +30.00 | 5,233,865 | 20.6% | +16.46 | 25,444,899 | 100.0% | +19.24 |
| 1991 | 16,668,587 | 57.3% | +12.62 | 6,788,354 | 23.3% | +25.49 | 5,621,510 | 19.3% | +7.41 | 29,078,451 | 100.0% | +14.28 |
| 2001 | 17,920,105 | 56.3% | +7.51 | 7,863,842 | 24.7% | +15.84 | 6,057,427 | 19.0% | +7.75 | 31,841,374 | 100.0% | +9.50 |
| 2011 | 18,282,492 | 54.9% | +2.02 | 8,873,472 | 26.6% | +12.84 | 6,141,269 | 18.4% | +1.38 | 33,406,061 | 100.0% | +4.91 |
| Indicates Least growth rate | Indicates Most growth rate | Source: Census of India (1901–2011) | ||||||||||

| Religion | 2001[51] | % | 2011[52] | % |
|---|---|---|---|---|
| Hinduism | 17,883,449 | 56.16 | 18,282,492 | 54.73 |
| Islam | 7,863,842 | 24.70 | 8,873,472 | 26.56 |
| Christianity | 6,057,427 | 19.02 | 6,141,269 | 18.38 |
| Buddhism | 2,027 | >0.01 | 4,752 | 0.01 |
| Jainism | 4,528 | 0.01 | 4,489 | 0.01 |
| Sikhism | 2,762 | >0.01 | 3,814 | 0.01 |
| Other | 2,256 | >0.01 | 7,618 | 0.02 |
| Not stated | — | — | 88,155 | 0.26 |
| Total | 31,841,374 | ~100 | 33,406,061 | ~100 |
Religious demographics of Travancore (1816–1941)[edit | edit source]
| Census year | Hindus | Christians | Muslims | Total population | |||
|---|---|---|---|---|---|---|---|
| 1816 – 1820 | 752,371 | 82.99% | 112,158 | 12.37% | 42,058 | 4.64% | 906,587 |
| 1881 | 1,755,610 | 73.12% | 498,542 | 20.76% | 146,909 | 6.12% | 2,401,158 |
| 1891 | 1,871,864 | 73.18% | 526,911 | 20.60% | 158,823 | 6.21% | 2,557,736 |
| 1901 | 2,063,798 | 69.91% | 697,387 | 23.62% | 190,566 | 6.46% | 2,952,157 |
| 1911 | 2,298,390 | 67.03% | 903,868 | 26.36% | 226,617 | 6.61% | 3,428,975 |
| 1921 | 2,562,301 | 63.96% | 1,172,934 | 29.27% | 270,478 | 6.75% | 4,006,062 |
| 1931 | 3,137,795 | 61.57% | 1,604,475 | 31.46% | 353,274 | 6.93% | 5,095,973 |
| 1941 | 3,671,480 | 60.49% | 1,963,808 | 32.35% | 434,150 | 7.15% | 6,070,018 |
Religious Demographics of Malabar District (1871–1951)[edit | edit source]
| Religion | 1871 | 1951 | |
| 1 | Hinduism | 72.43% | 63.25% |
|---|---|---|---|
| 2 | Islam | 25.72% | 33.49% |
| 3 | Christianity | 1.43% | 3.24% |
Communities[edit | edit source]
- Mappila Muslims (16.7%)
- Rowther Muslims (9.92%)
- Ezhavas (12.2%)
- Thiyyar (10.4%)
- Nairs (14.6%)
- Marthoma Nasrani (12.5%)
- Scheduled Castes (9.80%)
- Dheevaras (2.80%)
- Roman Catholic Latin Rite (2.50%)
- Brahmins (1.70%)
- Scheduled Tribes (1.10%)
- Other Christians (3.00%)
- Other Hindu Castes (2.90%)
- Others (0.30%)
SC and ST population in Kerala[edit | edit source]
The SC population of Kerala is 3,123,941 which is 9.80% of overall population. ST in Kerala, with a population of 364,000 constitute 1.14% of the population.[59]
Denominations groups among Christians:[60]
Catholic church (Syro-Malabar, Latin and Malankara) is the largest denomination among Kerala Christians,Among which Syro Malabar Is The Largest.Orthodox, Jacobite and Marthoma denominations claim Syrian roots. Major Protestant groups include CSI, various Pentecostal churches. Chaldean Syrian, Seventh Day Adventists, Salvation Army are some other denominations.[61][62][63][64][65][66]
Tribal communities[edit | edit source]
Kerala has approximately 35 distinct scheduled tribes that constitute 1.3% of the population. Though entirely unique, their languages are often not highlighted as distinct in the census. The Paniyan, who are the numerically dominant tribe, live in north east of the state and practice settled cultivation. The Kattunaikan, Kurichian and Kuruman belong to the same region. Palleyan, Palliyan and Palliyar inhabit the Idukki region not far from the Anamalai and Palani hills of Tamil Nadu where you find the same population. The Kadar, Irular, Kurumbas, Maha malasar and Malasar inhabit the Palghat region close to their counterparts in Niligiri and Anamalai hills of Tamil Nadu. The same is the case of the Kudiya and Koraga living in the northern most tip of the state next to Kodagu and Dakshina Kannada region of Karnataka.[67]
-
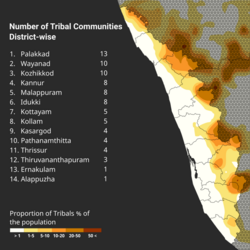 Total number of tribal communities
 -
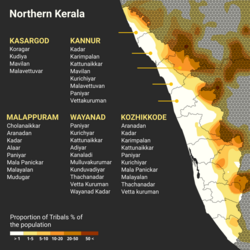 Tribes of North Kerala
 -
 Tribes of Central-South Kerala
 -
 Tribes of South Kerala


Age structure[edit | edit source]
(2011 census)
- 0–6 years: 9.95%
- 7–14 years: 23.9%
- 15–59 years: 54.3%
- 60 years and over:12.8%
| Age (Years): | Male population | Female population |
|---|---|---|
| 0–4 | 1247534 | 1205558 |
| 5–9 | 1303190 | 1251922 |
| 10–14 | 1438917 | 1383853 |
| 15–19 | 1328299 | 1282253 |
| 20–24 | 1298826 | 1366983 |
| 25–29 | 1203978 | 1400114 |
| 30–34 | 1128217 | 1327284 |
| 35–39 | 1161819 | 1417854 |
| 40–44 | 1117424 | 1295074 |
| 45–49 | 1105598 | 1242932 |
| 50–54 | 931191 | 996954 |
| 55–59 | 861527 | 880881 |
| 60–64 | 685136 | 729535 |
| 65–69 | 459232 | 542902 |
| 70–74 | 326562 | 406810 |
| 75–79 | 208317 | 293050 |
| 80+ | 204348 | 337501 |
| Year: | 1961 | 1971 | 1981 | 1991 | 2001 | 2011 |
|---|---|---|---|---|---|---|
| Age: | 19.28 | 19.39 | 21.81 | 24.36 | 28.87 | 32 |
Urbanisation[edit | edit source]
| Year | Rural
population (%) |
Urban
Population (%) |
|---|---|---|
| 1961 | 84.9 | 15.11 |
| 1971 | 83.76 | 16.24 |
| 1981 | 81.26 | 18.74 |
| 1991 | 73.61 | 26.39 |
| 2001 | 74.04 | 25.96 |
| 2011 | 52.26 | 47.74 |
Birth rate[edit | edit source]
| Year | Births | Deaths | Natural change |
Birth rate |
Death rate |
N. change rate |
|---|---|---|---|---|---|---|
| 1997 | 607,727 | 166,428 | 441,299 | 19.2 | 5.3 | 13.9 |
| 1998 | 591,508 | 185,788 | 405,720 | 18.4 | 5.8 | 12.6 |
| 1999 | 596,948 | 186,828 | 410,120 | 18.3 | 5.7 | 12.6 |
| 2000 | 593,724 | 178,795 | 414,929 | 18.0 | 5.4 | 12.6 |
| 2001 | 579,063 | 182,059 | 397,004 | 18.1 | 5.7 | 12.4 |
| 2002 | 581,925 | 184,597 | 397,328 | 18.0 | 5.7 | 12.3 |
| 2003 | 558,369 | 194,264 | 364,105 | 17.2 | 6.0 | 11.2 |
| 2004 | 563,153 | 199,017 | 364,136 | 17.1 | 6.1 | 11.0 |
| 2005 | 559,082 | 204,157 | 354,925 | 17.3 | 6.3 | 11.0 |
| 2006 | 556,326 | 219,094 | 337,232 | 16.6 | 6.6 | 10.0 |
| 2007 | 545,154 | 238,691 | 306,463 | 16.2 | 7.1 | 9.1 |
| 2008 | 535,738 | 221,769 | 313,969 | 15.7 | 6.5 | 9.2 |
| 2009 | 544,348 | 238,691 | 305,657 | 16.2 | 7.1 | 9.1 |
| 2010 | 546,964 | 238,864 | 308,100 | 15.8 | 6.9 | 8.9 |
| 2011 | 560,268 | 245,002 | 315,266 | 16.7 | 7.3 | 9.4 |
| 2012 | 550,411 | 239,982 | 310,429 | 16.4 | 7.1 | 9.3 |
| 2013 | 536,352 | 260,915 | 276,157 | 15.9 | 7.7 | 8.2 |
| 2014 | 534,458 | 248,242 | 286,216 | 15.8 | 7.3 | 8.5 |
| 2015 | 516,013 | 252,576 | 263,437 | 15.1 | 7.4 | 7.7 |
| 2016 | 496,292 | 256,130 | 240,162 | 14.5 | 7.5 | 7.0 |
| 2017 | 503,588 | 263,342 | 240,246 | 14.6 | 7.6 | 7.0 |
| 2018 | 488,174 | 258,530 | 229,644 | 14.1 | 7.5 | 6.6 |
| 2019 | 480,113 | 270,567 | 209,546 | 13.8 | 7.8 | 6.0 |
| 2020 | 446,891 | 250,983 | 195,908 | 12.8 | 7.2 | 5.6 |
| 2021 | 419,767 | 339,648 | 80,119 | 11.9 | 9.7 | 2.3 |
| 2022 | 443,032 | 323,929 | 119,103 | 12.5 | 9.2 | 3.4 |
| 2023 | 393,231 | 304,286 | 88,945 | 11.1 | 8.6 | 2.5 |
- Birth data by religion
| Religion | 2023[69] | % | 2022[70] | % | 2021[71] | % | 2020[72] | % | 2019[73] | % | 2018[74] | % | 2017[75] | % | 2016[76] | % | 2015[77] | % | 2014[78] | % | 2013[79] | % | 2012[80] | % | 2011[81] | % | 2010[82] | % | 2009[83] | % | 2008[84] | % | 2007[85] | % | 2006[86] | % | 2005[87] | % |
|---|---|---|---|---|---|---|---|---|---|---|---|---|---|---|---|---|---|---|---|---|---|---|---|---|---|---|---|---|---|---|---|---|---|---|---|---|---|---|
| Muslim | 1,76,312 | 44.84% | 2,00,325 | 45.22% | 169,296 | 40.33% | 196,138 | 43.89% | 212,933 | 44.35% | 213,805 | 43.80% | 216,525 | 43.00% | 211,182 | 42.55% | 213,865 | 41.45% | 218,437 | 40.87% | 214,257 | 39.96% | 175,892 | 31.96% | 214,099 | 38.21% | 209,276 | 38.26% | 204,711 | 37.61% | 194,583 | 36.32% | 183,796 | 33.71% | 196,493 | 35.32% | 191,675 | 34.28% |
| Hindu | 1,58,399 | 40.28% | 1,77,037 | 39.96% | 181,396 | 43.21% | 185,411 | 41.49% | 197,061 | 41.04% | 203,158 | 41.61% | 210,071 | 41.71% | 207,831 | 41.88% | 221,220 | 42.87% | 231,031 | 43.23% | 236,420 | 44.08% | 214,591 | 38.99% | 248,610 | 44.37% | 246,297 | 45.03% | 247,707 | 45.51% | 241,305 | 45.04% | 250,094 | 45.88% | 258,119 | 46.40% | 262,976 | 47.04% |
| Christian | 56,810 | 14.47% | 64,168 | 14.48% | 59,766 | 14.24% | 62,265 | 13.93% | 68,596 | 14.29% | 69,844 | 14.31% | 75,335 | 14.96% | 76,205 | 15.35% | 79,565 | 15.42% | 83,616 | 15.65% | 84,660 | 15.78% | 102,546 | 18.63% | 94,664 | 16.90% | 88,936 | 16.26% | 90,451 | 16.62% | 94,175 | 17.58% | 98,220 | 18.02% | 96,469 | 17.34% | 98,353 | 17.59% |
| Others | 1,294 | 0.33% | 1,235 | 0.28% | 9,143 | 2.18% | 2,967 | 0.66% | 1,408 | 0.29% | 1,214 | 0.25% | 1,497 | 0.30% | 852 | 0.18% | 933 | 0.18% | 1,178 | 0.22% | 869 | 0.16% | 57,215 | 10.39% | 2,671 | 0.48% | 651 | 0.12% | 704 | 0.13% | 5,151 | 0.96% | 6,108 | 1.12% | 1,545 | 0.28% | 1,098 | 0.19% |
| Not Stated | 416 | 0.11% | 267 | 0.06% | 166 | 0.04% | 110 | 0.02% | 115 | 0.02% | 153 | 0.03% | 169 | 0.03% | 222 | 0.04% | 430 | 0.08% | 196 | 0.03% | 146 | 0.02% | 167 | 0.03% | 224 | 0.04% | 1,806 | 0.33% | 775 | 0.14% | 524 | 0.10% | 6,936 | 1.27% | 3,700 | 0.66% | 4,980 | 0.89% |
| Total | 3,93,231 | 100% | 443032 | 100% | 419,767 | 100% | 446,891 | 100% | 480,113 | 100% | 488,174 | 100% | 503,588 | 100% | 496,292 | 100% | 516,013 | 100% | 534,458 | 100% | 536,352 | 100% | 550,411 | 100% | 560,268 | 100% | 546,964 | 100% | 544,348 | 100% | 535,738 | 100% | 545,154 | 100% | 556,326 | 100% | 559,082 | 100% |
17.1 births/1,000 population (1994–2001 est.)[88]
Birth Rate was 17.1 in 1994–2001 (20.3 in 1984–1990 & 25.0 in 1974–1980). Pathanamthitta (14.5 in 1994–2001, 17.2 in 1984–1990 & NA in 1974–1980) had the lowest TBR and Malappuram(22.4, 29.5 & 33.6) had the highest TBR.
According to the 2011 Census, Thiruvalla taluk has the lowest birth rate and Tirurangadi taluk has the highest birth rate.[89]
Lowest Birth Rate (2011):
- Thiruvalla – 10.63 per 1,000
- Mallappally – 10.69 per 1,000
- Kozhenchery – 10.86 per 1,000
- Chengannur – 10.93 per 1,000
- Adoor – 11.09 per 1,000
Highest Birth Rate (2011):
- Tirurangadi – 19.99 per 1,000
- Ernad – 19.68 per 1,000
- Perinthalmanna – 19.43 per 1,000
- Tirur – 19.16 per 1,000
- Nilambur – 18.34 per 1,000
Vital stats for the year 2011:[90]
| Community | Pop | Births | Birth Rate | Deaths | Death Rate | NGR% |
|---|---|---|---|---|---|---|
| Total | 33,406,061 | 560,268 | 16.77 | 245,002 | 7.33 | 0.94% |
| Hindu | 18,282,492 | 248,610 | 13.60 | 148,097 | 8.10 | 0.55% |
| Muslim | 8,873,472 | 214,099 | 24.13 | 45,305 | 5.11 | 1.90% |
| Christian | 6,141,269 | 94,664 | 15.41 | 50,365 | 8.20 | 0.72% |
- In 2007, 61.55% of the deaths were reported from Hindus, 17.50% from Muslims and, 19.75% from Christians.[91]
- In 2008, 61.01% of the deaths were reported from Hindus, 17.82% from Muslims and, 20.06% from Christians.[92]
- In 2010, 60.79% of the deaths were reported from Hindus, 18.31% from Muslims and, 20.36% from Christians.[93]
- In 2011, 60.45% of the deaths were reported from Hindus, 18.48% from Muslims and, 20.56% from Christians.[90]
- In 2018, 60.54% of the deaths were reported from Hindus, 19.15% from Muslims and, 19.86% from Christians.[74]
Net migration rate[edit | edit source]
- (-)3.1 migrant(s)/1,000 population (1991 est.)
Of the emigrants from Kerala, 42.2% were Muslims, 36.6% were Hindus and 21.2% were Christians in 1992–93. The most preferred destination was Saudi Arabia (37.8%), followed by UAE (25.9%), Other Gulf countries (13.0%), Oman (11.8%), Other Countries (7.5%) and USA(3.8%).[94]
Sex ratio[edit | edit source]
According to the 2011 census, women outnumber men in all the districts of Kerala with the highest proportion in Kannur and Pathanamthitta districts.
| Districts | Population | Males | % | Females | % |
|---|---|---|---|---|---|
| Kasargod | 1,307,375 | 628,613 | 48.1% | 678,762 | 51.9% |
| Kannur | 2,523,003 | 1,181,446 | 46.8% | 1,341,557 | 53.2% |
| Wayanad | 817,420 | 401,684 | 49.1% | 415,736 | 50.9% |
| Kozhikode | 3,086,293 | 1,470,942 | 47.7% | 1,615,351 | 52.3% |
| Malappuram | 4,112,920 | 1,960,328 | 47.7% | 2,152,592 | 52.3% |
| Palakkad | 2,809,934 | 1,359,478 | 48.4% | 1,450,456 | 51.6% |
| Thrissur | 3,121,200 | 1,480,763 | 47.4% | 1,640,437 | 52.6% |
| Ernakulam | 3,282,388 | 1,619,557 | 49.3% | 1,662,831 | 50.7% |
| Idukki | 1,108,974 | 552,808 | 49.8% | 556,166 | 50.2% |
| Kottayam | 1,974,551 | 968,289 | 49% | 1,006,262 | 51% |
| Alappuzha | 2,127,789 | 1,013,142 | 47.6% | 1,114,647 | 52.4% |
| Pathanamthitta | 1,197,412 | 561,716 | 46.8% | 635,696 | 53.2% |
| Kollam | 2,635,375 | 1,246,968 | 47.3% | 1,388,407 | 52.7% |
| Thiruvananthapuram | 3,301,427 | 1,581,678 | 47.9% | 1,719,749 | 52.1% |
Vital statistics[edit | edit source]
| Year | Infant
Mortality Rate (per 1000 birth) |
Crude
Birth Rate (per 100) |
Crude
Death Rate (per 1000) |
Natural
Growth Rate (per 1000) |
Maternal
Mortality Rate (Maternal death/ 100000 live birth) |
Total
Fertility Rate (Birth/Woman) |
|---|---|---|---|---|---|---|
| 2000 | 14 | 17.9 | 6.4 | 11.5 | 1.7 | |
| 2001 | 11 | 17.3 | 6.6 | 10.7 | 1.8 | |
| 2002 | 10 | 16.9 | 6.4 | 10.5 | 1.8 | |
| 2003 | 11 | 16.7 | 6.3 | 10.4 | 1.8 | |
| 2004 | 12 | 15.2 | 6.1 | 9.1 | 95 | 1.7 |
| 2005 | 14 | 15.0 | 6.4 | 8.6 | 1.7 | |
| 2006 | 15 | 14.9 | 6.7 | 8.2 | 1.7 | |
| 2007 | 13 | 14.7 | 6.8 | 7.9 | 81 | 1.7 |
| 2008 | 12 | 14.6 | 6.6 | 8.0 | 1.7 | |
| 2009 | 12 | 14.7 | 6.8 | 7.9 | 1.7 | |
| 2010 | 13 | 14.8 | 7.0 | 7.8 | 66 | 1.7 |
| 2011 | 12 | 15.2 | 7.0 | 8.2 | 61 | 1.7 |
| 2012 | 12 | 14.9 | 6.9 | 8.0 | 1.7 | |
| 2013 | 12 | 14.7 | 6.9 | 7.8 | 1.6 | |
| 2014 | 12 | 14.8 | 6.6 | 8.2 | 46 | 1.6 |
| 2015 | 12 | 14.8 | 6.6 | 8.2 | 42 | 1.6 |
| 2016 | 10 | 14.3 | 7.6 | 6.7 | 1.7 | |
| 2017 | 10 | 14.2 | 6.8 | 7.4 | 1.7 | |
| 2018 | 7 | 13.9 | 6.9 | 7.0 | 31 (est) | 1.8 |
Life expectancy at birth[edit | edit source]
Life expectancy at birth is 78 years.[95]
In 1991, Kerala had the lowest TFR (Children born per women) in the whole of India. Hindus had a TFR of 1.66, Christians had 1.78 and Muslims had 2.97. In 2000, the TFR was 1.73 with Muslims having 2.28, Nairs having a TFR of 1.47 and Syrian Christians having TFR of 1.55. TFR for Scheduled Castes was 1.52 in 1997–98 and 1.37 in 1992–93. The lowest Fertility rate recorded anywhere in India is TFR of 1.17 for Vettuvan caste in Kerala.[96]
As per the 2011 Census, the fertility rate per community is as Hindu: 1.544 children per woman, Muslim: 2.351 and Christian: 1.716. For SC, the fertility is 1.485 and for ST, it is 1.629.[97]
For Hindus, the TFR is highest in Wayanad (1.710) and lowest in Thiruvananthapuram (1.435). For the Muslims, it is Kannur (2.779) and Pathanamthitta (1.707), while for the Christians the respective districts are Kasaragod (1.929) and Kollam (1.539).[97]
See also[edit | edit source]
- Non-Municipal Census Towns in Kerala
- Demographics of Malabar
- Demographics of Travancore
- History of Kerala
- Geography of Kerala
- Economy of Kerala
- Kerala Gulf diaspora
- Migrant labourers in Kerala
- Unemployment in Kerala
References[edit | edit source]
- ↑ "Annual Vital Statistics Report 2023". Department of Economics and Statistics. Department of Economics and Statistics, Government of Kerala. Retrieved 7 December 2025.
- ↑ "Annual Vital Statistics Report 2023". Department of Economics and Statistics. Department of Economics and Statistics, Government of Kerala. Retrieved 7 December 2025.
- ↑ "Annual Vital Statistics Report 2023". Department of Economics and Statistics. Department of Economics and Statistics, Government of Kerala. Retrieved 7 December 2025.
- ↑ "Annual Vital Statistics Report 2023". Department of Economics and Statistics. Department of Economics and Statistics, Government of Kerala. Retrieved 7 December 2025.
- ↑ "KERALA POPULATION STATISTICS AS PER 2011 CENSUS".
- ↑ Western Influence on Malayalam Language and Literature by K. M. George, p2, ISBN 81-260-0413-4 Google book
- ↑ Caste, Class and Catholicism in India 1789–1914 by Kenneth Ballhatchet, p2, ISBN 0-7007-1095-7
- ↑ (Kalathil 2004, p. 10).
- ↑ (Kalathil 2004, p. 12).
- ↑ (Kalathil 2004, pp. 13–14).
- ↑ (Kalathil 2004, pp. 30–32).
- ↑ (Kalathil 2004, p. 37).
- ↑ (Kalathil 2004, p. 39).
- ↑ Heller, Patrick (June 1996). "Social capital as a product of class mobilization and state intervention: Industrial workers in Kerala, India". World Development. 24 (6): 1055–1071. doi:10.1016/0305-750X(96)00015-0.
- ↑ (GOK 2001)
- ↑ 16.0 16.1 "Census of India : Provisional Population Totals India : Paper1 : Census 2011". Censusindia.gov.in. Retrieved 16 August 2014.
- ↑ R Ramesh; R Purvaja; A Senthil Vel. Shoreline change assessment for Kerala coast (PDF). National Centre for Sustainable Coastal Management, Ministry of Environment and Forests. Archived from the original (PDF) on 30 May 2015. Retrieved 30 May 2015.
- ↑ "Level of Urbanisation in Indian States". mohua.gov.in. Ministry of Housing and Urban Affairs, Government of India.
- ↑ "Indian Census". Censusindia.gov.in. Retrieved 20 November 2014.
- ↑ Edna Fernandes, The Last Jews of Kerala, Skyhorse Publishing, 2008
- ↑ "Oldest Commonwealth synagogue turns 450". Business Standard. Press Trust of India. 9 December 2018. Retrieved 11 October 2024.
- ↑ "Population of Kerala - StatisticsTimes.com". statisticstimes.com. Archived from the original on 8 May 2020. Retrieved 23 May 2020.
- ↑ "Census 2011, Malappuram" (PDF). censusindia.gov.in.
- ↑ R Ramesh; R Purvaja; A Senthil Vel. Shoreline change assessment for Kerala coast (PDF). National Centre for Sustainable Coastal Management, Ministry of Environment and Forests.
- ↑ 25.0 25.1 Varma, A.R. Rajaraja (2005). Keralapanineeyam. Kottayam: D C Books. ISBN 81-7130-672-1.
- ↑ "Census 2011: Chapter 6 State of Literacy". www.censusindia.gov.in. Archived from the original on 3 September 2013.
- ↑ http://ncrb.nic.in/StatPublications/ADSI/ADSI2015/chapter-2%2520suicides-v1.pdf&ved=0ahUKEwibmOS41p_XAhUBLo8KHVjhCeUQFgh7MAk&usg=AOvVaw1qQ89yX7CZ0QKT6J9VigMn [dead link]
- ↑ "Census of India Website : Office of the Registrar General & Census Commissioner, India". censusindia.gov.in.
- ↑ "| NITI Aayog". Niti.gov.in. 25 April 2022. Retrieved 7 May 2022.
- ↑ (McKibben 1999).
- ↑ "Migration From Kerala Growing Steadily, Shows Study". Daijiworld.com. Retrieved 16 August 2014.
- ↑ "A Gulf without Keralites could soon be a reality". Emirates 24/7. 18 October 2012. Retrieved 16 August 2014.
- ↑ 33.0 33.1 "Invisible people". www.frontlineonnet.com. Archived from the original on 31 January 2011.
- ↑ "In Migrants' Own Country". The Indian Express. 24 July 2011. Retrieved 16 August 2014.
- ↑ "No Malayalam please, we're Bongs". The Telegraph (India). Retrieved 12 June 2020.
- ↑ Rakesh, K.M. (20 April 2011). "Missing voters". The Telegraph. Kolkata, India. Archived from the original on 2 November 2012.
- ↑ 37.0 37.1 "Cities of India – statewise". govemployees.in. Archived from the original on 25 August 2016. Retrieved 14 May 2021.
- ↑ "3 of world's 10 fastest-growing urban areas are in Kerala: Economist ranking". 8 January 2020. Retrieved 13 January 2020.
- ↑ 39.0 39.1 "Urban centres of Kerala". kerala.gov.in. Archived from the original on 30 December 2020. Retrieved 14 May 2021.
- ↑ "One in 3 Keralites lives in big cities". The Times of India. 28 October 2011.
{{cite news}}: CS1 maint: deprecated archival service (link) - ↑ "Provisional Population Totals, Census of India 2011" (PDF). Population of the urban local bodies in Kerala (2011). Government of Kerala. Retrieved 4 December 2020.
- ↑ "ALPHABETICAL LIST OF TOWNS AND THEIR POPULATION" (PDF). Retrieved 22 September 2023.
- ↑ "Population Analysis with list of UAs and their Population" (PDF). Retrieved 22 September 2023.
- ↑ "Analysis of Census Date : 2011" (PDF). Censusindia.gov.in. Retrieved 20 May 2015.
- ↑ "Migrant worker population in Kerala touches 2.5 m | Business Line". Business Line. Press Trust of India. 16 February 2013. Retrieved 16 August 2014.
- ↑ 46.0 46.1 "Language – India, States and Union Territories" (PDF). Census of India 2011. Office of the Registrar General. pp. 13–14.
- ↑ 47.0 47.1 "Census of India – Language". censusindia.gov.in.
- ↑ "Kerala government to appoint officer to study issues of linguistic minorities". City: Thiruvananthapuram. The Times of India. TNN. 2 August 2017.
- ↑ "Kerala: Muslims will be double the number of Christians by 2051". 16 March 2016. Archived from the original on 12 November 2020. Retrieved 14 May 2021.
- ↑ Photo imgur.com
- ↑ "Total population by religious communities". Censusindia.gov.in. Archived from the original on 19 January 2008. Retrieved 20 November 2014.
- ↑ "Indian Census 2011". Census Department, Government of India. Archived from the original on 13 September 2015. Retrieved 25 August 2015.
- ↑ Census of India, 1931, VOLUME XXVIII, Travancore, Part-I Report (PDF). Thiruvananthapuram: Government of Travancore. 1932. pp. 327, 331.
- ↑ Report on the Census of Travancore (1881) (PDF). Thiruvananthapuram: Government of India. 1884. pp. 135, 258.
- ↑ Report on the Census of Travancore (1891) (PDF). Chennai: Government of India. 1894. pp. 10–11, 683.
- ↑ Travancore, Part I, Vol-XXV (1941) (PDF). Thiruvananthapuram: Government of Travancore. 1942. pp. 124–125.
- ↑ Cornish, W. R. (1874). Report on the Census of Madras Presidency – 1871 (PDF). Madras: Government of Madras.
- ↑ 1951 census handbook – Malabar district (PDF). Chennai: Government of Madras. 1953.
- ↑ Census Tables censusindia.gov.in Archived 22 July 2011 at the Wayback Machine
- ↑ Denominations are not considered as caste or ethnic groups. Caste groups among Christians, which is a continuation of casteism in Hinduism, runs parallel to denominational divisions. One caste group may be spread over many denominations. One denomination may have more than one caste group in it. A person belonging to a denomination can convert to another denomination.
- ↑ "Kerala News : Increase in Muslim population in the State". The Hindu. 23 September 2004. Archived from the original on 14 January 2016. Retrieved 20 November 2014.
- ↑ "Guess who's after the Hindu vote in Kerala? (Hint: It's not the BJP)". 10 February 2016.
- ↑ Radhakrishnan, M. G. (5 September 2012). "Caste-based organisations NSS, SNDP form Hindu Grand Alliance in Kerala". India Today.
- ↑ Shenoy, T. V. R. "The communal polarisation of Kerala's voters". Rediff.
- ↑ "Dheevara Sabha calls for redefining minority status". The Hindu. 7 July 2006.
- ↑ "Brahmins in India". 5 February 2022.
- ↑ "Population of Tribals Percentage of Population – Kerala". 2003. Retrieved 22 May 2022.
- ↑ "Vital Statistics Reports". Government of Kerala, Vital Statistics Division Department of Economics & Statistics Thiruvananthapuram. Archived from the original on 7 June 2016. Retrieved 11 June 2023.
- ↑ India, DES, Government of Kerala. "Annual Vital Statistics Report 2023". ecostat.kerala.gov.in. Retrieved 19 June 2025.
{{cite web}}: CS1 maint: multiple names: authors list (link) - ↑ India, DES, Government of Kerala. "Annual Vital Statistics Report 2022". ecostat.kerala.gov.in. Retrieved 19 June 2025.
{{cite web}}: CS1 maint: multiple names: authors list (link) - ↑ "Annual Vital Statistics Report – 2021, Page Number 98" (PDF). Government of Kerala, Vital Statistics Division, Department of Economics & Statistics, Thiruvananthapuram. Retrieved 30 May 2023.
- ↑ "Annual Vital Statistics Report – 2020, Page Number 109" (PDF). Government of Kerala, Vital Statistics Division, Department of Economics & Statistics, Thiruvananthapuram. Retrieved 8 July 2022.
- ↑ "Annual Vital Statistics Report – 2019, Page Number 100". Government of Kerala, Vital Statistics Division Department of Economics & Statistics Thiruvananthapuram. Archived from the original (PDF) on 7 June 2016. Retrieved 24 August 2020.
- ↑ 74.0 74.1 "Annual Vital Statistics Report – 2018, Page Number 92" (PDF). Government of Kerala, Vital Statistics Division Department of Economics & Statistics Thiruvananthapuram. Archived from the original (PDF) on 2 November 2021. Retrieved 24 August 2020.
- ↑ "Annual Vital Statistics Report – 2017, Page Number 90" (PDF). Government of Kerala, Vital Statistics Division Department of Economics & Statistics Thiruvananthapuram. Archived from the original (PDF) on 20 June 2019. Retrieved 20 June 2019.
- ↑ Vital statistics 2016 kerala.gov.in Archived 24 April 2021 at the Wayback Machine
- ↑ "Annual Vital Statistics Report – 2015, Page Number 21" (PDF). Government of Kerala, Vital Statistics Division Department of Economics & Statistics Thiruvananthapuram. Archived from the original (PDF) on 21 June 2017. Retrieved 24 May 2017.
- ↑ "Annual Vital Statistics Report – 2014, Page Number 22" (PDF). Government of Kerala, Vital Statistics Division Department of Economics & Statistics Thiruvananthapuram. Archived from the original (PDF) on 12 November 2016. Retrieved 1 June 2016.
- ↑ "Annual Vital Statistics Report – 2013, Page Number 22" (PDF). Government of Kerala, Vital Statistics Division Department of Economics & Statistics Thiruvananthapuram. Archived from the original (PDF) on 6 February 2017. Retrieved 1 July 2015.
- ↑ "Annual Vital Statistics Report – 2012, Table – 2.7 (a), Page Number 23" (PDF). Government of Kerala, Vital Statistics Division Department of Economics & Statistics Thiruvananthapuram. Archived from the original (PDF) on 20 October 2016. Retrieved 1 November 2014.
- ↑ "Annual Vital Statistics Report – 2011, Table – 2.7 (a), Page Number 23" (PDF). Government of Kerala, Vital Statistics Division Department of Economics & Statistics Thiruvananthapuram. Archived from the original (PDF) on 6 February 2017. Retrieved 1 February 2014.
- ↑ "Annual Vital Statistics Report – 2010, Table – 2.7 (a), Page Number 23-24" (PDF). Government of Kerala, Vital Statistics Division Department of Economics & Statistics Thiruvananthapuram. Archived from the original (PDF) on 19 September 2013. Retrieved 1 March 2013.
- ↑ "Annual Vital Statistics Report – 2009, Table – 2.7 (a), Page Number 19-20" (PDF). Government of Kerala, Vital Statistics Division Department of Economics & Statistics Thiruvananthapuram. Archived from the original (PDF) on 19 September 2013. Retrieved 1 October 2011.
- ↑ "Annual Vital Statistics Report – 2008, Table – 1.7 (a), Page Number 19-20" (PDF). Government of Kerala, Vital Statistics Division Department of Economics & Statistics Thiruvananthapuram. Archived from the original (PDF) on 19 September 2013. Retrieved 1 March 2010.
- ↑ "Annual Vital Statistics Report – 2007, Table – 1.7 (a), Page Number 16" (PDF). Government of Kerala, Vital Statistics Division Department of Economics & Statistics Thiruvananthapuram. Archived from the original (PDF) on 23 March 2012. Retrieved 1 June 2009.
- ↑ "Annual Vital Statistics Report – 2006, Table – 1.7 (a), Page Number 34" (PDF). Government of Kerala, Vital Statistics Division Department of Economics & Statistics Thiruvananthapuram. Archived from the original (PDF) on 26 April 2021. Retrieved 26 August 2020.
- ↑ "Annual Vital Statistics Report – 2005, Table – 1.7 (a), Page Number 28" (PDF). Government of Kerala, Vital Statistics Division Department of Economics & Statistics Thiruvananthapuram. Archived from the original (PDF) on 10 January 2020. Retrieved 26 August 2020.
- ↑ "Family structure, women's education and work: Re-examining the high status of women in Kerala" (PDF). Archived from the original (PDF) on 10 February 2012. Retrieved 7 May 2022.
- ↑ http://www.censusindia.gov.in/2011-prov-results/paper2-vol2/data_files/kerala/PPT2_Tables_2.pdf [dead link]
- ↑ 90.0 90.1 "Annual Vital Statistics Report 2011" (PDF). Ecostat.kerala.gov.in. Archived from the original (PDF) on 23 September 2015. Retrieved 20 May 2015.
- ↑ "Annual Vital Statistics Report 2007" (PDF). Ecostat.kerala.gov.in. Archived from the original (PDF) on 23 March 2012. Retrieved 20 May 2015.
- ↑ "Annual Vital Statistics Report 2008" (PDF). Ecostat.kerala.gov.in. Retrieved 20 May 2015.
- ↑ "Annual Vital Statistics Report 2010" (PDF). Ecostat.kerala.gov.in. Archived from the original (PDF) on 19 September 2013. Retrieved 20 May 2015.
- ↑ "Profile of Emigrants from India: A comparative study of Kerala and Punjab" (PDF). Archived from the original (PDF) on 28 July 2011. Retrieved 7 May 2022.
- ↑ "niti ayog".
- ↑ Alagarajan, Manoj (2003). "An Analysis of Fertility Differentials by Religion in Kerala State: A Test of the Interaction Hypothesis". Population Research and Policy Review. 22 (5/6): 557–574. doi:10.1023/B:POPU.0000020963.63244.8c. S2CID 154895913.
- ↑ 97.0 97.1 2011 Census censusindia.gov.in Archived 21 December 2018 at the Wayback Machine
- Chandran, VP (2018). Mathrubhumi Yearbook Plus – 2019 (Malayalam ed.). Kozhikode: P. V. Chandran, Managing Editor, Mathrubhumi Printing & Publishing Company Limited, Kozhikode.
- "Ranking of districts by Sex Ratio and Population density" (PDF). Government of Kerala. 2001. Archived from the original (PDF) on 15 February 2010.
- Kalathil MJ (2004). Nair PR, Shaji H (eds.). Withering Valli: Alienation, Degradation, and Enslavement of Tribal Women in Attappady (PDF). Kerala Research Programme on Local Level Development. Thiruvananthapuram: Centre for Development Studies. ISBN 978-8187621690. Retrieved 29 December 2008.
- McKibben, Bill (October 1999). "Kerala, India". National Geographic Traveler. Archived from the original on 13 April 2002.


.png)