



m Removing protection template from an unprotected page |
No edit summary |
||
| Line 1: | Line 1: | ||
{{Short description|none}} | {{Short description|none}} | ||
{{protection padlock|small=yes}} | |||
{{ | {{Multiple issues| | ||
{{AI-generated|date=October 2025|talk=Likely AI-generated content}} | |||
{{Update|date=June 2025|reason=Numbers need to be updated as per latest Economic Survey 2024-25}} | |||
}} | |||
{{Use dmy dates|date=May 2024}} | |||
{{Use Oxford spelling|date=April 2022}} | {{Use Oxford spelling|date=April 2022}} | ||
{{Infobox economy | {{Infobox economy | ||
| country = Pakistan | | country = Pakistan | ||
| currency = [[Pakistani rupee]] (₨) (PKR) | | currency = [[Pakistani rupee]] (₨) (PKR) | ||
| fixed exchange = | | fixed exchange = 1 USD = 280 PKR | ||
| year = 1 July – 30 June | | year = 1 July – 30 June | ||
| organs = [[Economic Cooperation Organization|ECO]], [[South Asian Free Trade Area|SAFTA]], [[ | | organs = [[Economic Cooperation Organization|ECO]], [[South Asian Free Trade Area|SAFTA]], [[WTO]], [[AIIB]], [[Asian Development Bank|ADB]], [[SAARC]] [[OIC]] | ||
| group = {{plainlist| | | group = {{plainlist| | ||
*[[ | *[[Developing economy]]<ref>{{cite web |url=https://www.imf.org/external/pubs/ft/weo/2019/01/weodata/weoselco.aspx?g=2200&sg=All+countries+%2f+Emerging+market+and+developing+economies |title=World Economic Outlook Database, April 2019 |website=[[International Monetary Fund]] |archive-url=https://web.archive.org/web/20191222001529/https://www.imf.org/external/pubs/ft/weo/2019/01/weodata/weoselco.aspx?g=2200&sg=All+countries+%2f+Emerging+market+and+developing+economies |archive-date=22 December 2019 |access-date=29 September 2019}}</ref> | ||
| population = | *[[List of countries by GNI (nominal) per capita|Lower-middle income economy]]<ref>{{cite web |url=https://datahelpdesk.worldbank.org/knowledgebase/articles/906519-world-bank-country-and-lending-groups |title=World Bank Country and Lending Groups |publisher=[[World Bank]] |website=datahelpdesk.worldbank.org |access-date=29 September 2019}}</ref>}} | ||
| gdp = {{plainlist| | | population = 257,390,405 (2026) | ||
*{{ | | gdp = {{plainlist| | ||
*{{increase}} $1. | * {{increase}} $410.5 billion ([[GDP (nominal)|nominal]]; 2026)<ref name="gdp2026">{{cite web |title=World Economic Outlook (October 2025) |url=https://www.imf.org/external/datamapper/profile/PAK}}</ref> | ||
* {{increase}} $1.76 trillion ([[GDP (PPP)|PPP]]; 2026)<ref name="gdp2026"/> | |||
}} | }} | ||
| gdp rank = {{plainlist| | | gdp rank = {{plainlist| | ||
*[[List of countries by GDP (nominal)| | * [[List of countries by GDP (nominal)|41st (nominal; 2025)]] | ||
*[[List of countries by GDP (PPP)| | * [[List of countries by GDP (PPP)|26th (PPP; 2025)]] | ||
}} | }} | ||
| growth = {{plainlist| | | growth = {{plainlist| | ||
* {{ | * {{Decrease}} -0.2% (2023)<ref name="IMF DataMapper" /> | ||
* {{ | * {{Increase}} 2.5% (2024)<ref name="IMF DataMapper" /> | ||
*{{Increase}} 3. | * {{Increase}} 2.7% (2025)<ref name="IMF DataMapper" /> | ||
* {{Increase}} 3.6% (2026 forecast)<ref name="IMF DataMapper" /> | |||
}} | }} | ||
| per capita = {{plainlist| | | per capita = {{plainlist| | ||
*{{ | * {{increase}} $1,710 ([[GDP (nominal)|nominal]]; 2025)<ref name="gdp2026" /> | ||
*{{increase}} $ | * {{increase}} $7,120 ([[GDP (PPP)|PPP]]; 2026)<ref name="gdp2026"/> | ||
}} | }} | ||
| per capita rank = {{plainlist| | | per capita rank = {{plainlist| | ||
*[[List of countries by GDP (nominal) per capita| | * [[List of countries by GDP (nominal) per capita|161st (nominal; 2025)]]{{efn|name=fn1|Excluded territories}} | ||
*[[List of countries by GDP (PPP) per capita| | * [[List of countries by GDP (PPP) per capita|142nd (PPP; 2025)]]{{efn|name=fn1}} | ||
}} | }} | ||
| sectors = {{plainlist| | | sectors = {{plainlist| | ||
*[[Primary sector of the economy|Agriculture]]: {{ | *[[Primary sector of the economy|Agriculture]]: {{increase}} 23.17% | ||
*[[Secondary sector of the economy|Industry]]: {{ | *[[Secondary sector of the economy|Industry]]: {{decrease}} 18.41% | ||
*[[Tertiary sector of the economy|Services]]: {{increase}} 58. | *[[Tertiary sector of the economy|Services]]: {{increase}} 58.42% | ||
*(FY | *(FY 2023)<ref>{{cite web |url=https://www.pbs.gov.pk/sites/default/files/tables/national_accounts/2022-23/Table_7a.pdf|title=Sectoral Shares in GDP |publisher=[[Pakistan Bureau of Statistics]] |access-date=17 April 2024}}</ref>}} | ||
| components = {{plainlist| | | components = {{plainlist| | ||
* [[Gross domestic product#Determining gross domestic product (GDP)|Household consumption]]: 82.0% | * [[Gross domestic product#Determining gross domestic product (GDP)|Household consumption]]: 82.0% | ||
| Line 50: | Line 51: | ||
* [[Gross domestic product#Determining gross domestic product (GDP)|Exports of goods and services]]: 8.2% | * [[Gross domestic product#Determining gross domestic product (GDP)|Exports of goods and services]]: 8.2% | ||
* [[Gross domestic product#Determining gross domestic product (GDP)|Imports of goods and services]]: −17.6% | * [[Gross domestic product#Determining gross domestic product (GDP)|Imports of goods and services]]: −17.6% | ||
* (2017 est.)<ref>{{cite web |url=https://www.cia.gov/the-world-factbook/field/gdp-composition-by-end-use |title=GDP – composition, by end use-CIA World Factbook |publisher=[[The World Factbook]] |access-date=23 May 2022}}</ref> | * (2017 est.)<ref>{{cite web |url=https://www.cia.gov/the-world-factbook/field/gdp-composition-by-end-use |archive-url=https://web.archive.org/web/20210108204716/https://www.cia.gov/the-world-factbook/field/gdp-composition-by-end-use |url-status=dead |archive-date=8 January 2021 |title=GDP – composition, by end use-CIA World Factbook |publisher=[[The World Factbook]] |access-date=23 May 2022}}</ref> | ||
}} | }} | ||
| inflation = {{plainlist| | | inflation = {{plainlist| | ||
*{{ | * {{increaseNegative}} 4.5% (2025)<ref name="ES">{{cite web |title=Pakistan Economic Survey 2025 |url=https://finance.gov.pk/survey_2025.html}}</ref> | ||
| bankrate = {{ | | bankrate = {{decreasepositive}} 11.00% (May 2025)<ref>{{Cite news|title=Monetary Policy Statement|url=https://www.sbp.org.pk/m_policy/2025/MPS-May-2025-Eng.pdff|date=5 May 2025|access-date=20 May 2025}}{{Dead link|date=December 2025 |bot=InternetArchiveBot }}</ref>}}<ref>https://www.imf.org/external/datamapper/PCPIPCH@WEO/WEOWORLD/PAK</ref> | ||
| poverty = {{plainlist| | | poverty = {{plainlist| | ||
*{{decreasePositive}} | *{{DecreasePositive}} 88% on less than $8.30/day (2018) | ||
*{{decreasePositive}} | *{{decreasePositive}} 21.6% on less than $3.65/day (2025)<ref name="WBOctober2021">{{cite book |last=World Bank |date=October 2021 |title=Shifting Gears : Digitization and Services-Led Development |url=https://openknowledge.worldbank.org/handle/10986/36317 |series=South Asia Economic Focus |publisher=[[World Bank]] |page=218 |doi=10.1596/978-1-4648-1797-7 |hdl=10986/36317 |isbn=978-1-4648-1797-7 |s2cid=244900022 |access-date=23 May 2022}}</ref><ref>{{cite web |title=Country Profile-Pakistan |series=Macro Poverty Oulook |publisher=[[World Bank]] |url=https://thedocs.worldbank.org/en/doc/5d1783db09a0e09d15bbcea8ef0cec0b-0500052021/related/mpo-pak.pdf |access-date=23 May 2022}}</ref><ref>{{cite web |url=https://data.worldbank.org/indicator/SI.POV.LMIC?locations=PK&name_desc=false |title=Poverty headcount ratio at $3.20 a day (2011 PPP) (% of population) – Pakistan |publisher=[[World Bank]] |website=data.worldbank.org |access-date=20 October 2020}}</ref> | ||
*{{decreasePositive}} 2% in [[extreme poverty]] less than $1.90{{nowrap| (2025)<ref name="World Poverty Clock">{{cite web |url=https://worldpoverty.io/index.html |title=Select by country:Pakistan |work=World Poverty Clock |access-date=23 May 2022}}</ref><br />{{small|8% (rural); 0.3% (urban)}}}} | |||
}} | }} | ||
| gini = 31.6 {{color|darkorange|medium}} (2018, [[World Bank]])<ref name="wb-gini">{{cite web |url=https://data.worldbank.org/indicator/SI.POV.GINI?locations=PK |title=GINI index (World Bank estimate) |publisher=[[World Bank]] | website=data.worldbank.org |access-date=18 July 2021}}</ref> | | gini = 31.6 {{color|darkorange|medium}} (2018, [[World Bank]])<ref name="wb-gini">{{cite web |url=https://data.worldbank.org/indicator/SI.POV.GINI?locations=PK |title=GINI index (World Bank estimate) |publisher=[[World Bank]] | website=data.worldbank.org |access-date=18 July 2021}}</ref> | ||
| hdi = | | hdi = *{{increase}} 0.544 {{color|red|low}} (2025)<ref name="HDI">{{cite web |url=http://hdr.undp.org/en/indicators/137506 |title=Human Development Index (HDI) |publisher=[[Human Development Report|HDRO (Human Development Report Office)]] [[United Nations Development Programme]] |website=hdr.undp.org |access-date=31 August 2025}}</ref> ([[List of countries by Human Development Index|168th]]) | ||
*{{ | * {{increase}} 0.364 {{color|brown|low}} (2023, [[List of countries by inequality-adjusted HDI|IHDI 138th]])<ref name="HDI" /> | ||
*{{ | | labour = *{{increase}} 78,863,000 (2025)<ref name="laboursur">{{cite web|title=Pakistan Labour Survey|url=https://www.pbs.gov.pk/sites/default/files/labour_force/publications/lfs2020_21/LFS_2020-21_Report.pdf |publisher=PBS|accessdate=23 March 2023}}</ref> | ||
| labour = | |||
*{{increase}} | |||
| occupations = {{plainlist| | | occupations = {{plainlist| | ||
*[[Primary sector of the economy|Agriculture]]: {{decrease}} 37.4% | *[[Primary sector of the economy|Agriculture]]: {{decrease}} 37.4% | ||
| Line 75: | Line 74: | ||
*[[Food processing]] | *[[Food processing]] | ||
*[[Pharmaceuticals]] | *[[Pharmaceuticals]] | ||
* | *Surgical instruments | ||
*[[Construction materials]] | *[[Construction materials]] | ||
*[[Fertilizer]] | *[[Fertilizer]] | ||
*[[ | *[[Freelancing|Overseas remote freelancing]] | ||
*[[Seafood]] | |||
*Luxury products | |||
*[[Technology]] | |||
*[[Pulp and paper industry|Paper products]] | *[[Pulp and paper industry|Paper products]] | ||
| exports = {{ | *[[Automotive]] | ||
*[[Telecommunication]] | |||
*[[Marble]] | |||
*[[Glass manufacturing]] | |||
*[[Shipbreaking]] | |||
*Ornamentations | |||
*[[Banking]] | |||
*[[Energy]] | |||
*Precious minerals & metals | |||
*[[Defense industry]] | |||
*[[Mass media|Media]] | |||
*[[Education]] | |||
*[[Tourism]] | |||
*[[Financial services]] | |||
*[[Human resources]] | |||
| exports = {{increase}} $40.69 billion (2025)<ref name="sbpExp">{{cite web|title=Exports and Imports of Goods & Services|publisher=SBP |url=https://www.sbp.org.pk/ecodata/ExportsImports-Goods.pdf|access-date=8 August 2025}}</ref> | |||
| export-goods = {{plainlist| | | export-goods = {{plainlist| | ||
*[[Textiles]]: $16, | *[[Textiles]]: $16,301 million | ||
*[[Food]]: $ | *[[Food]]: $7,082 million | ||
*[[Chemicals]] and [[ | *[[Chemicals]] and [[pharmaceuticals]]: $1,421 million | ||
*[[Leather goods]]: $ | *[[Leather goods]]: $877 million | ||
*[[Sports goods]]: $ | *[[Sports goods]]: $439 million | ||
*[[Petroleum]]: $ | *[[Petroleum]]: $553 million<ref>{{cite web|title=External Sector|publisher=SBP |url=https://www.sbp.org.pk/ecodata/Export_Receipts_by_Commodities_and_Groups.pdf|access-date=2024-08-10}}</ref>}} | ||
| export-partners = {{plainlist| | | export-partners = {{plainlist| | ||
*{{flag| | *{{flag|China}} 8.7% | ||
*{{flag| | *{{flag|United Arab Emirates}} 6.7% | ||
*{{flag|United Kingdom}} | *{{flag|United Kingdom}} 6.5% | ||
*{{flag|Germany}} | *{{flag|Germany}} 4.9% | ||
*{{flag| | *{{flag|Spain}} 4.7% | ||
*{{flag|Netherlands}} | *{{flag|Netherlands}} 4.4% | ||
*{{flag| | *{{flag|United States}} 17.5% | ||
*{{flag|Italy}} | *{{flag|Italy}} 3.6% | ||
*( | *(2024 est.)<ref>{{cite web|url=https://www.sbp.org.pk/ecodata/Export_Receipts_by_Selected_Countries_or_Regions.pdf|title=SBP Export Receipts by Country | publisher=SBP|year=2021–2022|access-date=2024-08-10}}</ref>}} | ||
| imports = {{ | | imports = {{increase}} $78.02 billion (2025)<ref name="sbpExp"/> | ||
| import-goods = {{plainlist| | | import-goods = {{plainlist| | ||
*[[Petroleum]]: | *[[Petroleum]]: 15,162 million | ||
*[[Agriculture]] and other [[chemicals]]: $8, | *[[Agriculture]] and other [[chemicals]]: $8,944 million | ||
*[[Machinery]]: $ | *[[Machinery]]: $7,406 million | ||
*[[Food]]: $7, | *[[Food]]: $7,111 million | ||
*[[ | *[[Metal]]: $4,668 million | ||
*[[ | *[[Textile]]: $3,890 million | ||
*[[Transport]]: $1, | *[[Transport]]: $1,621 million<ref>{{cite web |title=Imports Payments by Commodity | publisher=SBP|url=https://www.sbp.org.pk/ecodata/Import_Payments_by_Commodities_and_Groups.pdf|access-date=2024-08-10}}</ref>}} | ||
| import-partners = {{plainlist| | | import-partners = {{plainlist| | ||
*{{flag|China}} | *{{flag|China}} 25.4% | ||
*{{flag|United Arab Emirates}} | *{{flag|United Arab Emirates}} 11.9% | ||
*{{flag|Saudi Arabia}} | *{{flag|Saudi Arabia}} 8.5% | ||
*{{flag|Singapore}} | *{{flag|Singapore}} 4.6% | ||
*{{flag| | *{{flag|Indonesia}} 4.5% | ||
*{{flag| | *{{flag|Kuwait}} 3.4% | ||
*{{flag| | *{{flag|Russia}} 2.0% | ||
*{{flag| | *{{flag|United States}} 3.6% | ||
*( | *(2024 est.)<ref>{{cite web|title=Import Payments by Selected Countries/Regions | ||
| current account = {{increase}} | |url=https://www.sbp.org.pk/ecodata/Import_Payments_by_Selected_Countries_&_Regions.pdf|publisher=SBP|accessdate=2024-08-10}}</ref>}} | ||
| current account = {{increase}} 1.8 billion US$ (FY 2025)<ref>{{cite web |title=Pakistan Economic Survey 2025|url=https://finance.gov.pk/survey_2025.html}}</ref> | |||
| FDI = {{plainlist| | | FDI = {{plainlist| | ||
*{{decrease}} | *{{decrease}} $31.540 billion | ||
*{{decrease}} Abroad: $1.870 billion (31 Dec 2021)<ref>{{cite web |title=Pakistan: Foreign Investment | publisher=SBP|url=https://www.sbp.org.pk/publications/IIPP/2021/DataTables.pdf|access-date=2023 | *{{decrease}} Abroad: $1.870 billion (31 Dec 2021)<ref>{{cite web |title=Pakistan: Foreign Investment | publisher=SBP|url=https://www.sbp.org.pk/publications/IIPP/2021/DataTables.pdf|access-date=27 July 2023}}</ref>}} | ||
| gross external debt = {{ | | gross external debt = {{increasenegative}} $131 billion (2025)<ref>{{cite web|title=External Sector|publisher=SBP |url=https://www.sbp.org.pk/ecodata/pakdebt.pdf|access-date=27 July 2023}}</ref> | ||
| debt = {{ | | debt = {{decreasepositive}} 61.4% of GDP (Jun 2024)<ref>{{cite web|title=Pakistan's Debt and Liabilities-Summary|publisher=SBP |url=https://www.sbp.org.pk/ecodata/Summary.pdf|access-date=13 September 2024}}</ref> | ||
| balance = {{ | | balance = {{decreasepositive}} −5.6% of GDP (FY 2024)<ref name="IMF DataMapper">{{cite web |url=https://www.imf.org/external/datamapper/profile/PAK |title=IMF DataMapper: Pakistan |website=[[International Monetary Fund]] |date= 2025 |access-date=19 May 2025}}</ref> | ||
| revenue = {{ | | revenue = {{increase}} 12.5% of GDP; 13,269 billion PKR or $47 billion (FY 2024)<ref name="FO">{{cite web|url=https://www.finance.gov.pk/fiscal_main.html |title=Consolidated Fiscal Operations|publisher=Finance Division|date=30 July 2024 |access-date=13 September 2024}}</ref> | ||
| expenses = {{increasenegative}} 19. | | expenses = {{increasenegative}} 19.3% of GDP; 20,476 billion PKR $72 billion (FY 2024)<ref name="FO"/> | ||
| credit = {{plainlist| | | credit = {{plainlist| | ||
*[[Standard & Poor's]]:<ref name="Sovereigns rating list">{{cite web | url= | *[[Standard & Poor's]]:<ref name="Sovereigns rating list">{{cite web |url=https://disclosure.spglobal.com/ratings/en/regulatory/article/-/view/type/HTML/id/3222256 | title=Sovereigns rating list | publisher=Standard & Poor's | access-date=30 July 2024}}</ref> | ||
* | *CCC+ (long term) | ||
* | *C (short term) | ||
*Outlook: stable | |||
*Outlook: | *[[Moody's]]:<ref>{{cite web | url=https://www.moodys.com/research/docid--PBC_1414324 | title=Moody's upgrades Pakistan's rating to Caa2; outlook positive| date=2 September 2024 }}</ref> | ||
*[[Moody's]]:<ref>{{cite web | url=https://www.moodys.com/research/ | *{{increase}} Caa2 | ||
*{{ | *Outlook: positive | ||
*Outlook: | *[[Fitch Ratings|Fitch]]:<ref>{{Cite web|url=https://www.fitchratings.com/research/sovereigns/fitch-revises-pakistan-outlook-to-negative-affirms-at-b-18-07-2022|title=Fitch Revises Pakistan's Outlook to Negative; Affirms at 'B-'|date=2022-07-18|work=Fitch Ratings|access-date=2025-07-19}}</ref> | ||
*[[Fitch Ratings|Fitch]]:<ref>https://www.fitchratings.com/research/sovereigns/fitch-revises-pakistan-outlook-to-negative-affirms-at-b-18-07-2022</ref> | *{{increase}} B− (April 2025)<ref name="FitchRating">{{cite news|url=https://www.fitchratings.com/entity/pakistan-94558490#ratings |title=Fitch Upgrades Pakistan's Rating Citing Improved External Liquidity|publisher=Fitch|date=15 April 2025}}</ref> | ||
*{{ | *Outlook: stable}} | ||
| reserves = {{increase}} $20 billion (2025)<ref>{{Cite web|title=Liquid Foreign Exchange Reserves|url=https://www.sbp.org.pk/ecodata/forex.pdf |access-date=2024-11-06 |website=www.sbp.org.pk |language=en}}</ref> | |||
*Outlook: | |||
| reserves = {{increase}} $ | |||
| aid = {{increase}} $2.6983 billion (2021)<ref name="WBaid">{{cite web|title=Net official development assistance and official aid received (current US$)|url=https://data.worldbank.org/indicator/DT.ODA.ALLD.CD|publisher=[[World Bank]]|access-date=14 March 2023}}</ref> | | aid = {{increase}} $2.6983 billion (2021)<ref name="WBaid">{{cite web|title=Net official development assistance and official aid received (current US$)|url=https://data.worldbank.org/indicator/DT.ODA.ALLD.CD|publisher=[[World Bank]]|access-date=14 March 2023}}</ref> | ||
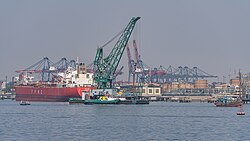
| image = | | image = PK_Karachi_asv2020-02_img47_container_port.jpg | ||
| image_size = 350px | | image_size = 350px | ||
| caption = [[Karachi]], the | | caption = [[Karachi]], the industrial capital of Pakistan<ref>{{cite web|title=About Karachi|url=https://www.pqa.gov.pk/en/about-us/about-us/port-qasim-at-glance/about-karachi|publisher=Government of Pakistan|access-date=13 September 2025}}</ref> | ||
| unemployment = {{plainlist| | | unemployment = {{plainlist| | ||
* {{increasenegative}} | * {{increasenegative}} 6.9% (2025)<ref name="IMFData">{{cite web|url=https://www.imf.org/external/datamapper/profile/PAK|title=Unemployment rate|website=[[International Monetary Fund]]}}</ref>}} | ||
}} | }} | ||
The | The economy of Pakistan is classified as a [[developing economy]]. It is the [[List of countries by GDP (PPP)|26th-largest]] economy by [[GDP]] ([[purchasing power parity|PPP]]) and the [[List of countries by GDP (nominal)|41st-largest]] in terms of nominal GDP in the world. In terms of per capita income, the country ranks [[List of countries by GDP (nominal) per capita|161st by GDP (nominal)]] and [[List of countries by GDP per capita (PPP)|142nd by GDP (PPP)]], according to the [[International Monetary Fund]] (IMF) in 2025.<ref name="WE"/><ref>{{Cite web |title=https://www.imf.org/external/datamapper/profile/PAK |url=https://www.imf.org/external/datamapper/profile/PAK |access-date=2025-10-29 |website=www.imf.org}}</ref> | ||
In the | In its early years, the economy of Pakistan relied heavily on private industries. The [[Nationalisation in Pakistan|nationalization]] of a significant portion of the sector, including financial services, manufacturing, and transportation, began in the early 1970s under [[Zulfikar Ali Bhutto]]. During the regime of [[Zia-ul Haq]] in the 1980s, an [[Islamic economics|Islamic model of economy]] was adopted, outlawing economic practices forbidden in [[Sharīʿah]]. The economy started privatizing again in the 1990s. Pakistan was classified as a semi-industrial economy for the first time in the late 1990s, albeit an [[Periphery countries|underdeveloped country]]<ref>Dunn, Kawana, Brewer, ''Trade Globalization since 1795'', American Sociological Review, 2000 February, Vol. 65 [https://www.jstor.org/stable/2657290 article], [http://www.irows.ucr.edu/cd/appendices/asr00/asr00app.htm#Table%20A2 Appendix with the country list] {{Webarchive|url=https://web.archive.org/web/20100718051219/http://www.irows.ucr.edu/cd/appendices/asr00/asr00app.htm#Table%20A2|date=18 July 2010}}</ref> with a heavy dependence on agriculture, particularly the textile industry relying on cotton production.<ref>{{Cite journal |last1=Henneberry |first1=S. |year=2000 |title=An analysis of industrial–agricultural interactions: A case study in Pakistan |url=http://ageconsearch.umn.edu/record/175305/files/agec2000v022i001a002.pdf |journal=Agricultural Economics |volume=22 |pages=17–27 |doi=10.1016/S0169-5150(99)00041-9 |doi-broken-date=25 August 2025}}</ref><ref name="WB2">{{cite web |year=2008 |title=World Bank Document |url=http://siteresources.worldbank.org/PAKISTANEXTN/Resources/293051-1241610364594/6097548-1257441952102/balochistaneconomicreportvol2.pdf |access-date=2 January 2010 |page=14}}</ref><ref>{{cite web |year=2010 |title=Pakistan Country Report |url=http://www.rad-aid.org/UploadedFiles/RAD-AID%20Pakistan%20Health%20Care%20Radiology%20Report%202011.pdf |url-status=dead |archive-url=https://web.archive.org/web/20120112021042/http://www.rad-aid.org/UploadedFiles/RAD-AID%20Pakistan%20Health%20Care%20Radiology%20Report%202011.pdf |archive-date=12 January 2012 |access-date=26 December 2011 |work=RAD-AID |pages=3, 7}}</ref> | ||
Pakistan is presently recovering from a major [[Pakistani economic crisis (2021–2024)|economic crisis]] and undergoing economic liberalization, including the [[Privatisation in Pakistan|privatization of all government corporations]], aimed at attracting foreign investment and reducing budget deficits.<ref>{{cite web|url=http://tribune.com.pk/story/664292/privatisation-process-govt-to-sell-assets-in-sole-offering/|title=Privatisation process: Govt to sell assets in sole offering|work=The Express Tribune|date=27 January 2014 }}</ref> As of 11 February 2026, the Governor of the [[State Bank of Pakistan]] stated that the economy was projected to grow between 3.75% and 4.75% in fiscal year 2026, exceeding a recent IMF forecast. The central bank kept its policy rate at 10.5% following earlier reductions, and projected the current account deficit to remain within 0–1% of GDP, while emphasizing the need for continued structural reforms to sustain growth.<ref>{{Cite web |last=Shahid |first=Ariba |date=11 February 2026 |title=Pakistan central bank chief expects broader recovery than IMF forecast |url=https://www.reuters.com/world/asia-pacific/pakistan-central-bank-chief-expects-broader-recovery-than-imf-forecast-2026-02-11/}}</ref> | |||
Pakistan | The economic growth centers in Pakistan are located along the [[Indus River]];<ref name="WB">{{cite web |year=2008 |title=World Bank Document |url=http://siteresources.worldbank.org/PAKISTANEXTN/Resources/293051-1241610364594/6097548-1257441952102/balochistaneconomicreportvol2.pdf |access-date=2 January 2010 |page=14}}</ref><ref>{{Cite web |title=Arquivo.pt |url=http://gecon.yale.edu/Pakistan.htm |url-status=dead |archive-url=http://arquivo.pt/wayback/20090720074224/http://gecon.yale.edu/Pakistan.htm |archive-date=20 July 2009 |access-date=6 April 2022 |website=arquivo.pt}}</ref> these include the diversified economies of [[Economy of Karachi|Karachi]] and major urban centers in [[Punjab, Pakistan#Economy|Punjab]] (such as [[Faisalabad]], [[Lahore]], [[Sialkot]], [[Rawalpindi]], and [[Gujranwala]]), alongside less developed areas in other parts of the country.<ref name="WB">{{cite web |year=2008 |title=World Bank Document |url=http://siteresources.worldbank.org/PAKISTANEXTN/Resources/293051-1241610364594/6097548-1257441952102/balochistaneconomicreportvol2.pdf |access-date=2 January 2010 |page=14}}</ref> In recent decades, regional connectivity initiatives such as the [[China–Pakistan Economic Corridor|China-Pakistan Economic Corridor]] (CPEC) have emerged as pivotal contributors to infrastructure and energy development, with long-term implications for economic stability. Primary export commodities include textiles, leather goods, sports equipment, chemicals, and carpets/rugs.<ref>{{cite web |last=Design |first=Websynergi |title=Pakistan Trade, Pakistan Industries, India Pakistan Trade Unit |url=http://www.iptu.co.uk/content/pakistan_economy.asp |url-status=dead |archive-url=https://web.archive.org/web/20190914171838/http://www.iptu.co.uk/content/pakistan_economy.asp |archive-date=14 September 2019 |access-date=9 October 2014 |website=iptu.co.uk}}</ref><ref>{{Cite web |title=Pakistan's Top 10 Exports 2020 |url=https://www.worldstopexports.com/pakistans-top-10-exports/ |access-date=6 April 2022 |website=worldstopexports.com}}</ref> | ||
==Economic history== | ==Economic history== | ||
{{Main|Economic history of Pakistan}} | {{Main|Economic history of Pakistan}} | ||
=== | === Inception === | ||
In the late 1940s, | In the late 1940s, upon its establishment, Pakistan had an agrarian-based economy. Agriculture constituted 53% of the country's GDP in 1947 and slightly increased to 53.2% in 1949–50. With a population of approximately 30 million, including around 6 million residing in urban areas, about 65% of the labor force was engaged in agriculture. The agricultural sector played a crucial role, contributing to 99.2% of exports and making up nearly 90% of foreign exchange earnings. | ||
Despite possessing significant land and mineral resources in both [[East Pakistan|East]] and [[West Pakistan]], including natural gas, crude oil, coal, limestone, and marble, Pakistan faced numerous challenges. In 1950, its [[per capita income]] was around $360 (in 1985 international dollars), and the literacy rate was only 10%. The nation encountered a lack of economic infrastructure, financial resources, and an industrial foundation, particularly with poverty rates ranging from 55% to 60% in the West Pakistan region. | |||
Due to limited capital in the small private sector, the government opted to focus on the public sector to foster economic and industrial development. In the fiscal year 1949–50, Pakistan recorded a national savings rate of 2%, a foreign savings rate of 2%, and an investment rate of 4%. Manufacturing contributed 7.8% to the GDP, while services, trade, and other sectors accounted for a significant 39%, reflecting a policy centered around [[Import substitution industrialization|import-substituting industrialization]]. The trade balance of payments indicated a deficit of 66 million rupees (Rs) during the period spanning 1949/50 to 1950/51.<ref name="BH">{{Cite journal |last1=Anjum |first1=Muhammad Iqbal |last2=Michael Sgro |first2=Pasquale |date=26 June 2017 |title=A brief history of Pakistan's economic development |url=http://www.paecon.net/PAEReview/issue80/AnjumSgro80.pdf |journal=Real-World Economics Review |issue=80 |pages=171–178}}</ref> | |||
=== 1950s === | |||
The 1950s marked the initiation of planned development in Pakistan, with the introduction of the [[Colombo Plan]] in 1951 leading to a series of [[Five-Year Plans of Pakistan|Five-Year Plans]] from 1955 to 1998. Concurrently, a Ten-Year Perspective Plan was implemented, complemented by a rolling Three-Year Development Plan. | |||
During the 1950s, Pakistan pursued a policy of import-substituting industrialization. Notably, the [[Korean War]] (1950–1953) brought substantial merchant profits to Pakistan's public and emerging private sectors, fueling industrialization. | |||
In 1952, Pakistan imposed bans on the imports of cotton textiles and luxury goods, followed by comprehensive import regulations in 1953, propelling the country into the ranks of the fastest-growing nations. However, biased policies against agriculture and unfavorable trade terms between agriculture and industry led to a decline in the annual growth rate of agriculture. | |||
By the late 1950s, Pakistan achieved self-sufficiency in cotton textiles, emphasizing export development. The influx of US military and economic aid amounting to US$500 million during 1955–58 contributed to Pakistan's growth reliant on foreign aid. | |||
In 1959, after a [[1958 Pakistani coup d'état|military coup d'état in 1958]], the martial law regime introduced export bonus vouchers as import licenses and exempted certain goods from licensing. During this period, Pakistan faced a worsening trade balance, with deficits increasing from −831 million Rupees in 1950/51 to −1043 million rupees in 1959/60. | |||
Economically, agriculture grew at an annual rate of 1.6%, while manufacturing expanded impressively at 7.7% per annum during the 1950s. In the fiscal year 1959–60, the Per Capita [[Gross National Product]] (GNP) stood at Rs. 355 in West Pakistan and Rs. 269 in [[East Pakistan]], indicating a growing economic disparity between the two regions.<ref name="BH"/> | |||
=== | === 1960s === | ||
In the 1960s, amid a substantial influx of American aid, Pakistan enjoyed political stability, fostering robust economic growth. Poverty, measured by the poverty headcount ratio, fluctuated from nearly 50% in the early 1960s to 54% in 1963–64. | |||
During the | During the 1960s, Pakistan achieved an impressive annual agricultural growth rate of 5%, driven by substantial investments in water resources, increased farmer incentives, mechanization, greater use of fertilizers and pesticides, and expanded cultivation of high-yielding rice and wheat varieties in the [[Green Revolution]]. | ||
Large-scale manufacturing experienced significant growth, expanding at a remarkable rate of 16% per annum from 1960/61 to 1964/65, fueled by protective measures for domestic industries, including export subsidies. | |||
However, the [[Indo-Pakistani War of 1965|Pakistan-India War of 1965]] led to reduced foreign economic assistance, impacting the growth rate of large-scale manufacturing. From 1965 to 1970, this sector grew at a comparatively lower rate of 10% per annum. | |||
In | Despite challenges, Pakistan achieved an impressive average annual GDP growth rate of 6.7% throughout the 1960s. In the fiscal year 1969–70, the poverty incidence rate decreased to 46%. Per Capita GNP was Rs. 504 in West Pakistan and Rs. 314 in East Pakistan, indicating a widening regional economic disparity.<ref name="BH"/> | ||
=== 1970s === | |||
The economic landscape in the early 1970s witnessed growing disparities between East and West Pakistan, leading to [[Independence of Bangladesh|East Pakistan's declaration of independence]] and the emergence of [[Bangladesh]] in 1971. Subsequently, Pakistan underwent notable transformations in both its political and economic spheres. | |||
Under martial law authorities, amidst challenging macroeconomic conditions, the socialist [[Pakistan Peoples Party Parliamentarians|Pakistan People's Party]] gained empowerment. This period grappled with numerous economic challenges, including a surge in poverty incidence to 55% during 1971–72. Pakistan also confronted heightened import costs due to the global [[1973 oil crisis|oil price shock in October 1973]], a severe [[1973–1975 recession|global recession]] from 1974 to 1977, cotton sector failures in 1974–75, pest infestations affecting crops, and massive floods in 1973, 1974, and 1976–77. | |||
One significant economic issue during this time was high inflation, with prices increasing by an average of 15% per annum between 1972 and 1977. The fiscal deficit/GDP ratio averaged 8.1% during 1973–77, indicating substantial fiscal challenges. Trade imbalances were apparent, with trade deficits rising from US$337 million in 1970–71 to US$1,184 million in 1976–77. | |||
The [[1977 Pakistani military coup|military coup d'état of 1977]], leading to the establishment of a [[Presidency of Muhammad Zia-ul-Haq|martial law regime]] that initiated denationalization, deregulation, and privatization policies. Agriculture experienced modest growth at a rate of 2.4% per annum, while large-scale manufacturing expanded at a rate of 5.5% per annum during the 1970s. | |||
Large and medium-scale private manufacturing played a significant role, contributing 75% of the total value-added and investment in manufacturing during the 1970s. The remaining 25% of value-added came from small-scale manufacturing. | |||
Overall, this period was marked by significant political and economic changes, driven by challenges posed by economic disparities, political shifts, and efforts to address issues such as inflation, fiscal deficits, and trade imbalances.<ref name="BH"/> | |||
=== | === 1980s === | ||
The economic landscape in the | The 1980s brought substantial changes to Pakistan's economic landscape, moving away from the [[Nationalisation in Pakistan|nationalization policies of the 1970s]] and fostering private sector industrial investment, which greatly contributed to robust economic growth. Notable developments in this era included a drop in the poverty headcount ratio to 29.1% in 1986–87, showcasing a decline in poverty incidence. The unemployment rate exhibited a positive trend, decreasing from 3.7% in 1980 to 2.6% in 1990. | ||
Between 1985 and 1988, the government endeavored to implement an [[Islamic banking and finance|Islamic interest-free banking system]], introducing business partnerships based on profit and loss sharing. The national savings/GDP ratio reached a notable 16% in 1986–87, largely due to significant worker remittances from the Middle East. Despite this growth, challenges emerged, including negative public savings and a declining public investment/GDP ratio throughout the 1980s. | |||
To address increasing budget deficits in the early 1980s, the government heavily relied on non-bank domestic borrowing, resulting in substantial domestic debt growth. Consequently, the public debt/GDP ratio surged to 77.1% in 1988, 81.9% in 1989, and 82.6% in 1990, leading to significant interest payments and persistent fiscal deficits. | |||
In 1985, [[1985 Pakistani general election|democracy was restored in Pakistan]], marking a pivotal political development. The country experienced a commendable average annual GDP growth rate of 6.3% between 1980 and 1990. The 1980s saw a surge in manufacturing exports, with an annual large-scale manufacturing growth rate of 8.8%, and solid growth in agriculture, with an annual agricultural growth rate of 5.4%. | |||
These highlights underscore a transformative and recovering economic period in the 1980s, characterized by a shift in economic policies, improved fiscal performance, and substantial progress in poverty reduction and employment. The era also witnessed efforts to align financial practices with Islamic principles and significant economic growth in the manufacturing and agricultural sectors.<ref name="BH"/> | |||
=== 1990s === | |||
The 1990s posed a formidable economic landscape for Pakistan, marked by a series of challenges and developments. Declining worker remittances and escalating external deficits set the tone for economic strains. Simultaneously, the decade witnessed the [[Periods of stagflation in Pakistan|second-worst inflation]] in Pakistan's history, driven by diminishing GDP growth rates. Unemployment surged, reaching 5.9% in 1991 and escalating further to 7.2% in 2000. | |||
Pakistan's external debt tripled, soaring to US$30 billion by 1995. The external debt/GDP ratio rose from 42% to 50%, accompanied by increases in the external debt/exports ratio (from 209% to 258%) and the debt service ratio (from 18% to 27%). A deteriorating external debt profile led to a rise in domestic debt, reaching Rs. 909 billion, and a domestic debt/GDP ratio of 42%. | |||
The late 1990s witnessed a severe debt crisis, with the public debt/GDP ratio skyrocketing from 57.5% in 1975–77 to 102% in 1998–99. The public debt/revenues ratio surged to 624%, and the interest payments/revenues ratio reached 42.6%, rendering Pakistan's public debt unsustainable. Concerns over external debt default emerged in 1996 and 1998, triggered by Western economic sanctions in response to [[Chagai-I|Pakistan's nuclear tests]] in May 1998, causing massive capital flight. | |||
Despite these challenges, Pakistan managed to sustain an agricultural growth rate of 4.4% per annum and a large-scale manufacturing growth rate of 4.8% per annum throughout the 1990s. However, the era witnessed a significant increase in poverty incidence, reaching 30.6% in 1998–99. The decade encapsulated a complex economic narrative, as Pakistan navigated external debt burdens, fiscal imbalances, inflation, and rising unemployment. Amid these difficulties, there were positive aspects, including growth in key sectors like agriculture and manufacturing. Nonetheless, the 1990s also brought forth a looming threat of debt default, magnified by [[economic sanctions]] in response to nuclear tests.<ref name="BH"/> | |||
=== | === 2000s === | ||
The | The 2000s witnessed a period of substantial economic challenges and transformations for Pakistan. The impact of high public debt gained prominence, identified by the official Debt Reduction and Management Committee in 2001, contributing to a decline in the growth rate to less than 4% per annum. Despite an initial upturn in the growth rate, the decade unfolded with persistent macroeconomic crises. Although achieving a noteworthy growth rate of 8.6% in 2004–05, subsequent years were marred by a series of setbacks, including a growth slowdown, low growth, high inflation, an energy crisis, and worsening fiscal and balance of payments positions. | ||
The economic landscape reflected the complexities faced by the population, illustrated by a rise in poverty incidence to 34.5% in 2000–01. However, a subsequent decrease to 22.3% in 2005–06 offered a nuanced perspective on the decade's economic trajectory. The unemployment rate saw fluctuations, rising to 7.8% in 2002 but later declining to 5% by 2008. | |||
Efforts to enhance education and literacy rates were evident as adult literacy stood at 55% in 2007–08. Nevertheless, challenges persisted, and economic crises hit Pakistan in 2008, primarily influenced by the [[2008 financial crisis]]. Despite these adversities, economic growth in 2009–2010 reached a respectable 4.1%, with positive contributions from various sectors, including a 2% growth in agriculture, 4.9% growth in industrial output, 4.4% growth in large-scale manufacturing, and a 4.6% expansion in the services sector. | |||
By March 2010, public debt had accumulated to Rs. 8,160 billion, with a total public debt/GDP ratio of 56% and a foreign-currency denominated debt/GDP ratio of 25%. Amid these economic dynamics, Pakistan underwent a structural transition. The GDP share of agriculture declined from 53% in 1947 to 21.2% in 2010, while the GDP share of industry rose from 9.6% in 1949–50 to 25.4% in 2010. Additionally, the GDP share of the services sector increased from 37.2% in 1950 to 53.4% in 2010. The 2000s encapsulated a multifaceted economic narrative for Pakistan, marked by challenges, crises, and significant structural shifts, reflecting the nation's resilience and adaptability.<ref name="BH"/> | |||
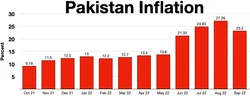
In late 2021, Pakistan entered a severe [[Pakistani economic crisis (2021–2024)|economic crisis]] as inflation surged, the rupee plunged in value, gas supplies dried up, foreign reserves declined and debt increased significantly.<ref>{{Cite web |last=Dawn.com |date=2021-12-27 |title=2021 in review: Business stories that captured the waves |url=https://www.dawn.com/news/1665416 |access-date=2026-03-01 |website=Dawn |language=en}}</ref><ref>{{Cite news |last=Schmall |first=Emily |last2=Masood |first2=Salman |date=2021-11-23 |title=As Inflation Surges, Pakistan Seeks a $6 Billion I.M.F. Lifeline |url=https://www.nytimes.com/2021/11/23/business/economy/pakistan-imf-economy.html |access-date=2026-03-01 |work=The New York Times |language=en-US |issn=0362-4331}}</ref><ref>{{Cite web |last=Ahmed |first=Ali |date=2022-01-01 |title=December: Inflation reading comes in at 12.3%, highest in 22 months |url=https://www.brecorder.com/news/40144034 |access-date=2026-03-01 |website=Brecorder |language=en}}</ref> | |||
== Data == | == Data == | ||
=== Gross domestic product (GDP) === | === Gross domestic product (GDP) === | ||
{{See also|List of Pakistani provinces by gross domestic product}}The | {{See also|List of Pakistani provinces by gross domestic product}}The table below displays key economic indicators from 1980 to 2025. Inflation rates below 5% are highlighted in green.<ref name="WE">{{Cite web |title=World Economic Outlook database: April 2025 |url=https://www.imf.org/en/Publications/WEO/weo-database/2025/april/weo-report?c=564,&s=NGDP_RPCH,NGDPD,PPPGDP,NGDPRPPPPC,NGDPDPC,PPPPC,PCPIPCH,LUR,GGXWDG_NGDP,&sy=1980&ey=2025&ssm=0&scsm=1&scc=0&ssd=1&ssc=0&sic=0&sort=country&ds=.&br=1 |access-date=2025-10-21 |website=imf.org}}</ref> | ||
{| class="wikitable mw-datatable" style="white-space: nowrap;" | {| class="wikitable mw-datatable" style="white-space:nowrap;" | ||
|- | |- | ||
! Year | ! Year | ||
!GDP | !GDP | ||
<small>(Billion US $ PPP)</small> | <small>(Billion US$ PPP)</small> | ||
!GDP per capita | !GDP per capita | ||
<small>(US$ PPP)</small> | <small>(US$ PPP)</small> | ||
!GDP | !GDP | ||
<small>(Billion US $ nominal)</small> | <small>(Billion US$ nominal)</small> | ||
!GDP per capita | !GDP per capita | ||
<small>(US$ nominal)</small> | <small>(US$ nominal)</small> | ||
! style="text-align:center" | GDP growth | ! style="text-align:center"| GDP growth | ||
<small>(Real)</small> | <small>(Real)</small> | ||
! style="text-align:center" | Inflation rate | ! style="text-align:center"| Inflation rate | ||
<small>(Percent)</small> | <small>(Percent)</small> | ||
!Unemployment | !Unemployment | ||
<small>(Percent)</small> | <small>(Percent)</small> | ||
! style="text-align:center" | Government debt | ! style="text-align:center"| Government debt | ||
<small>(% of GDP)</small> | <small>(% of GDP)</small> | ||
|- | |- | ||
!1980 | !1980 | ||
| style="text-align:center" | | | style="text-align:center" |75 | ||
| style="text-align:center" |950.0 | | style="text-align:center" |950.0 | ||
| style="text-align:center" | | | style="text-align:center" |38.6 | ||
| style="text-align:center" |418.9 | | style="text-align:center" |418.9 | ||
| style="text-align:center" |{{increase}} | | style="text-align:center" |{{increase}}6.9% | ||
| style="text-align:center" |{{IncreaseNegative}}11.9% | | style="text-align:center" |{{IncreaseNegative}}11.9% | ||
| style="text-align:center" |n/a | | style="text-align:center" |n/a | ||
| Line 286: | Line 284: | ||
|- | |- | ||
!1981 | !1981 | ||
| style="text-align:center" |{{increase}} | | style="text-align:center" |{{increase}}87 | ||
| style="text-align:center" |{{increase}}1,072.8 | | style="text-align:center" |{{increase}}1,072.8 | ||
| style="text-align:center" |{{increase}} | | style="text-align:center" |{{increase}}45.7 | ||
| style="text-align:center" |{{increase}}481.3 | | style="text-align:center" |{{increase}}481.3 | ||
| style="text-align:center" |{{increase}}6. | | style="text-align:center" |{{increase}}6.2% | ||
| style="text-align:center" |{{IncreaseNegative}}11.9% | | style="text-align:center" |{{IncreaseNegative}}11.9% | ||
| style="text-align:center" |n/a | | style="text-align:center" |n/a | ||
| Line 296: | Line 294: | ||
|- | |- | ||
!1982 | !1982 | ||
| style="text-align:center" |{{increase}} | | style="text-align:center" |{{increase}}100 | ||
| style="text-align:center" |{{increase}}1,190.0 | | style="text-align:center" |{{increase}}1,190.0 | ||
| style="text-align:center" |{{increase}} | | style="text-align:center" |{{increase}}49.9 | ||
| style="text-align:center" |{{increase}}511.0 | | style="text-align:center" |{{increase}}511.0 | ||
| style="text-align:center" |{{increase}}7.6% | | style="text-align:center" |{{increase}}7.6% | ||
| Line 306: | Line 304: | ||
|- | |- | ||
!1983 | !1983 | ||
| style="text-align:center" |{{increase}} | | style="text-align:center" |{{increase}}110 | ||
| style="text-align:center" |{{increase}}1,283.6 | | style="text-align:center" |{{increase}}1,283.6 | ||
| style="text-align:center" |{{decrease}} | | style="text-align:center" |{{decrease}}46.6 | ||
| style="text-align:center" |{{decrease}}463.7 | | style="text-align:center" |{{decrease}}463.7 | ||
| style="text-align:center" |{{increase}}6.8% | | style="text-align:center" |{{increase}}6.8% | ||
| Line 316: | Line 314: | ||
|- | |- | ||
!1984 | !1984 | ||
| style="text-align:center" |{{increase}} | | style="text-align:center" |{{increase}}119 | ||
| style="text-align:center" |{{increase}}1,345.3 | | style="text-align:center" |{{increase}}1,345.3 | ||
| style="text-align:center" |{{increase}} | | style="text-align:center" |{{increase}}50.6 | ||
| style="text-align:center" |{{increase}}489.8 | | style="text-align:center" |{{increase}}489.8 | ||
| style="text-align:center" |{{increase}}4.0% | | style="text-align:center" |{{increase}}4.0% | ||
| Line 326: | Line 324: | ||
|- | |- | ||
!1985 | !1985 | ||
| style="text-align:center" |{{increase}} | | style="text-align:center" |{{increase}}133 | ||
| style="text-align:center" |{{increase}}1,468.4 | | style="text-align:center" |{{increase}}1,468.4 | ||
| style="text-align:center" |{{steady}} | | style="text-align:center" |{{steady}}50.6 | ||
| style="text-align:center" |{{decrease}}476.7 | | style="text-align:center" |{{decrease}}476.7 | ||
| style="text-align:center" |{{increase}}8.7% | | style="text-align:center" |{{increase}}8.7% | ||
| Line 336: | Line 334: | ||
|- | |- | ||
!1986 | !1986 | ||
| style="text-align:center" |{{increase}} | | style="text-align:center" |{{increase}}145 | ||
| style="text-align:center" |{{increase}}1,551.3 | | style="text-align:center" |{{increase}}1,551.3 | ||
| style="text-align:center" |{{increase}} | | style="text-align:center" |{{increase}}51.8 | ||
| style="text-align:center" |{{decrease}}475.3 | | style="text-align:center" |{{decrease}}475.3 | ||
| style="text-align:center" |{{increase}}6.4% | | style="text-align:center" |{{increase}}6.4% | ||
| Line 346: | Line 344: | ||
|- | |- | ||
!1987 | !1987 | ||
| style="text-align:center" |{{increase}} | | style="text-align:center" |{{increase}}157 | ||
| style="text-align:center" |{{increase}}1,638.5 | | style="text-align:center" |{{increase}}1,638.5 | ||
| style="text-align:center" |{{increase}} | | style="text-align:center" |{{increase}}54.2 | ||
| style="text-align:center" |{{increase}}483.9 | | style="text-align:center" |{{increase}}483.9 | ||
| style="text-align:center" |{{increase}}5.8% | | style="text-align:center" |{{increase}}5.8% | ||
| Line 356: | Line 354: | ||
|- | |- | ||
!1988 | !1988 | ||
| style="text-align:center" |{{increase}} | | style="text-align:center" |{{increase}}173 | ||
| style="text-align:center" |{{increase}}1,759.4 | | style="text-align:center" |{{increase}}1,759.4 | ||
| style="text-align:center" |{{increase}} | | style="text-align:center" |{{increase}}62.4 | ||
| style="text-align:center" |{{increase}}543.1 | | style="text-align:center" |{{increase}}543.1 | ||
| style="text-align:center" |{{increase}}6.4% | | style="text-align:center" |{{increase}}6.4% | ||
| Line 366: | Line 364: | ||
|- | |- | ||
!1989 | !1989 | ||
| style="text-align:center" |{{increase}} | | style="text-align:center" |{{increase}}188 | ||
| style="text-align:center" |{{increase}}1,868.3 | | style="text-align:center" |{{increase}}1,868.3 | ||
| style="text-align:center" |{{increase}} | | style="text-align:center" |{{increase}}65.0 | ||
| style="text-align:center" |{{increase}}552.0 | | style="text-align:center" |{{increase}}552.0 | ||
| style="text-align:center" |{{increase}}4.8% | | style="text-align:center" |{{increase}}4.8% | ||
| Line 376: | Line 374: | ||
|- | |- | ||
!1990 | !1990 | ||
| style="text-align:center" |{{increase}} | | style="text-align:center" |{{increase}}204 | ||
| style="text-align:center" |{{increase}}1,970.1 | | style="text-align:center" |{{increase}}1,970.1 | ||
| style="text-align:center" |{{increase}} | | style="text-align:center" |{{increase}}65.3 | ||
| style="text-align:center" |{{decrease}}538.4 | | style="text-align:center" |{{decrease}}538.4 | ||
| style="text-align:center" |{{increase}}4.6% | | style="text-align:center" |{{increase}}4.6% | ||
| Line 386: | Line 384: | ||
|- | |- | ||
!1991 | !1991 | ||
| style="text-align:center" |{{increase}} | | style="text-align:center" |{{increase}}222 | ||
| style="text-align:center" |{{increase}}2,094.8 | | style="text-align:center" |{{increase}}2,094.8 | ||
| style="text-align:center" |{{increase}} | | style="text-align:center" |{{increase}}74.2 | ||
| style="text-align:center" |{{increase}}598.4 | | style="text-align:center" |{{increase}}598.4 | ||
| style="text-align:center" |{{increase}}5.4% | | style="text-align:center" |{{increase}}5.4% | ||
| Line 396: | Line 394: | ||
|- | |- | ||
!1992 | !1992 | ||
| style="text-align:center" |{{increase}} | | style="text-align:center" |{{increase}}244 | ||
| style="text-align:center" |{{increase}}2,211.1 | | style="text-align:center" |{{increase}}2,211.1 | ||
| style="text-align:center" |{{increase}} | | style="text-align:center" |{{increase}}79.3 | ||
| style="text-align:center" |{{increase}}614.2 | | style="text-align:center" |{{increase}}614.2 | ||
| style="text-align:center" |{{increase}}7.6% | | style="text-align:center" |{{increase}}7.6% | ||
| Line 406: | Line 404: | ||
|- | |- | ||
!1993 | !1993 | ||
| style="text-align:center" |{{increase}} | | style="text-align:center" |{{increase}}255 | ||
| style="text-align:center" |{{increase}}2,252.4 | | style="text-align:center" |{{increase}}2,252.4 | ||
| style="text-align:center" |{{increase}} | | style="text-align:center" |{{increase}}83.4 | ||
| style="text-align:center" |{{increase}}633.6 | | style="text-align:center" |{{increase}}633.6 | ||
| style="text-align:center" |{{increase}}2.1% | | style="text-align:center" |{{increase}}2.1% | ||
| Line 416: | Line 414: | ||
|- | |- | ||
!1994 | !1994 | ||
| style="text-align:center" |{{increase}} | | style="text-align:center" |{{increase}}272 | ||
| style="text-align:center" |{{increase}}2,341.1 | | style="text-align:center" |{{increase}}2,341.1 | ||
| style="text-align:center" |{{increase}} | | style="text-align:center" |{{increase}}84.6 | ||
| style="text-align:center" |{{decrease}}622.8 | | style="text-align:center" |{{decrease}}622.8 | ||
| style="text-align:center" |{{increase}}4.4% | | style="text-align:center" |{{increase}}4.4% | ||
| Line 426: | Line 424: | ||
|- | |- | ||
!1995 | !1995 | ||
| style="text-align:center" |{{increase}} | | style="text-align:center" |{{increase}}292 | ||
| style="text-align:center" |{{increase}}2,449.6 | | style="text-align:center" |{{increase}}2,449.6 | ||
| style="text-align:center" |{{increase}} | | style="text-align:center" |{{increase}}98.9 | ||
| style="text-align:center" |{{increase}}709.9 | | style="text-align:center" |{{increase}}709.9 | ||
| style="text-align:center" |{{increase}}5.1% | | style="text-align:center" |{{increase}}5.1% | ||
| Line 436: | Line 434: | ||
|- | |- | ||
!1996 | !1996 | ||
| style="text-align:center" |{{increase}} | | style="text-align:center" |{{increase}}317 | ||
| style="text-align:center" |{{increase}}2,594.8 | | style="text-align:center" |{{increase}}2,594.8 | ||
| style="text-align:center" |{{increase}} | | style="text-align:center" |{{increase}}103.3 | ||
| style="text-align:center" |{{increase}}723.5 | | style="text-align:center" |{{increase}}723.5 | ||
| style="text-align:center" |{{increase}}6.6% | | style="text-align:center" |{{increase}}6.6% | ||
| Line 446: | Line 444: | ||
|- | |- | ||
!1997 | !1997 | ||
| style="text-align:center" |{{increase}} | | style="text-align:center" |{{increase}}328 | ||
| style="text-align:center" |{{increase}}2,620.8 | | style="text-align:center" |{{increase}}2,620.8 | ||
| style="text-align:center" |{{decrease}} | | style="text-align:center" |{{decrease}}101.8 | ||
| style="text-align:center" |{{decrease}}696.4 | | style="text-align:center" |{{decrease}}696.4 | ||
| style="text-align:center" |{{increase}}1.7% | | style="text-align:center" |{{increase}}1.7% | ||
| Line 456: | Line 454: | ||
|- | |- | ||
!1998 | !1998 | ||
| style="text-align:center" |{{increase}} | | style="text-align:center" |{{increase}}343 | ||
| style="text-align:center" |{{increase}}2,678.9 | | style="text-align:center" |{{increase}}2,678.9 | ||
| style="text-align:center" |{{decrease}} | | style="text-align:center" |{{decrease}}101.4 | ||
| style="text-align:center" |{{decrease}}677.0 | | style="text-align:center" |{{decrease}}677.0 | ||
| style="text-align:center" |{{increase}}3.5% | | style="text-align:center" |{{increase}}3.5% | ||
| Line 466: | Line 464: | ||
|- | |- | ||
!1999 | !1999 | ||
| style="text-align:center" |{{increase}} | | style="text-align:center" |{{increase}}363 | ||
| style="text-align:center" |{{increase}}2,765.6 | | style="text-align:center" |{{increase}}2,765.6 | ||
| style="text-align:center" |{{decrease}} | | style="text-align:center" |{{decrease}}96.0 | ||
| style="text-align:center" |{{decrease}}626.5 | | style="text-align:center" |{{decrease}}626.5 | ||
| style="text-align:center" |{{increase}}4.2% | | style="text-align:center" |{{increase}}4.2% | ||
| Line 476: | Line 474: | ||
|- | |- | ||
!2000 | !2000 | ||
| style="text-align:center" |{{increase}} | | style="text-align:center" |{{increase}}385 | ||
| style="text-align:center" |{{increase}}2,855.1 | | style="text-align:center" |{{increase}}2,855.1 | ||
| style="text-align:center" |{{increase}} | | style="text-align:center" |{{increase}}99.4 | ||
| style="text-align:center" |{{increase}}630.3 | | style="text-align:center" |{{increase}}630.3 | ||
| style="text-align:center" |{{increase}}3.9% | | style="text-align:center" |{{increase}}3.9% | ||
| Line 486: | Line 484: | ||
|- | |- | ||
!2001 | !2001 | ||
| style="text-align:center" |{{increase}} | | style="text-align:center" |{{increase}}408 | ||
| style="text-align:center" |{{increase}}2,916.7 | | style="text-align:center" |{{increase}}2,916.7 | ||
| style="text-align:center" |{{decrease}} | | style="text-align:center" |{{decrease}}96.8 | ||
| style="text-align:center" |{{decrease}}602.0 | | style="text-align:center" |{{decrease}}602.0 | ||
| style="text-align:center" |{{increase}}3.7% | | style="text-align:center" |{{increase}}3.7% | ||
| Line 496: | Line 494: | ||
|- | |- | ||
!2002 | !2002 | ||
| style="text-align:center" |{{increase}} | | style="text-align:center" |{{increase}}425 | ||
| style="text-align:center" |{{increase}}2,995.0 | | style="text-align:center" |{{increase}}2,995.0 | ||
| style="text-align:center" |{{increase}} | | style="text-align:center" |{{increase}}98.2 | ||
| style="text-align:center" |{{decrease}}593.9 | | style="text-align:center" |{{decrease}}593.9 | ||
| style="text-align:center" |{{increase}}2.4% | | style="text-align:center" |{{increase}}2.4% | ||
| Line 506: | Line 504: | ||
|- | |- | ||
!2003 | !2003 | ||
| style="text-align:center" |{{increase}} | | style="text-align:center" |{{increase}}456 | ||
| style="text-align:center" |{{increase}}3,119.8 | | style="text-align:center" |{{increase}}3,119.8 | ||
| style="text-align:center" |{{increase}} | | style="text-align:center" |{{increase}}112.5 | ||
| style="text-align:center" |{{increase}}666.1 | | style="text-align:center" |{{increase}}666.1 | ||
| style="text-align:center" |{{increase}}5.6% | | style="text-align:center" |{{increase}}5.6% | ||
| Line 516: | Line 514: | ||
|- | |- | ||
! 2004 | ! 2004 | ||
| style="text-align:center" |{{increase}} | | style="text-align:center" |{{increase}}505 | ||
| style="text-align:center" |{{increase}}3,376.5 | | style="text-align:center" |{{increase}}3,376.5 | ||
| style="text-align:center" |{{increase}} | | style="text-align:center" |{{increase}}132.2 | ||
| style="text-align:center" |{{increase}}767.8 | | style="text-align:center" |{{increase}}767.8 | ||
| style="text-align:center" |{{increase}}7.7% | | style="text-align:center" |{{increase}}7.7% | ||
| Line 526: | Line 524: | ||
|- | |- | ||
! 2005 | ! 2005 | ||
| style="text-align:center" |{{increase}} | | style="text-align:center" |{{increase}}562 | ||
| style="text-align:center" |{{increase}}3,722.9 | | style="text-align:center" |{{increase}}3,722.9 | ||
| style="text-align:center" |{{increase}} | | style="text-align:center" |{{increase}}145.2 | ||
| style="text-align:center" |{{increase}}842.0 | | style="text-align:center" |{{increase}}842.0 | ||
| style="text-align:center" |{{increase}}7.5% | | style="text-align:center" |{{increase}}7.5% | ||
| Line 536: | Line 534: | ||
|- | |- | ||
! 2006 | ! 2006 | ||
| style="text-align:center" |{{increase}} | | style="text-align:center" |{{increase}}612 | ||
| style="text-align:center" |{{increase}}3,986.8 | | style="text-align:center" |{{increase}}3,986.8 | ||
| style="text-align:center" |{{increase}} | | style="text-align:center" |{{increase}}161.9 | ||
| style="text-align:center" |{{increase}}961.4 | | style="text-align:center" |{{increase}}961.4 | ||
| style="text-align:center" |{{increase}}5.6% | | style="text-align:center" |{{increase}}5.6% | ||
| Line 546: | Line 544: | ||
|- | |- | ||
! 2007 | ! 2007 | ||
| style="text-align:center" |{{increase}} | | style="text-align:center" |{{increase}}661 | ||
| style="text-align:center" |{{increase}}4,244.6 | | style="text-align:center" |{{increase}}4,244.6 | ||
| style="text-align:center" |{{increase}} | | style="text-align:center" |{{increase}}184.1 | ||
| style="text-align:center" |{{increase}}1,048.4 | | style="text-align:center" |{{increase}}1,048.4 | ||
| style="text-align:center" |{{increase}}5.5% | | style="text-align:center" |{{increase}}5.5% | ||
| Line 556: | Line 554: | ||
|- | |- | ||
! 2008 | ! 2008 | ||
| style="text-align:center" |{{increase}} | | style="text-align:center" |{{increase}}704 | ||
| style="text-align:center" |{{increase}}4,362.9 | | style="text-align:center" |{{increase}}4,362.9 | ||
| style="text-align:center" |{{increase}} | | style="text-align:center" |{{increase}}202.2 | ||
| style="text-align:center" |{{increase}}1,124.0 | | style="text-align:center" |{{increase}}1,124.0 | ||
| style="text-align:center" |{{increase}}5.0% | | style="text-align:center" |{{increase}}5.0% | ||
| Line 566: | Line 564: | ||
|- | |- | ||
! 2009 | ! 2009 | ||
| style="text-align:center" |{{increase}} | | style="text-align:center" |{{increase}}715 | ||
| style="text-align:center" |{{decrease}}4, | | style="text-align:center" |{{decrease}}4,240.5 | ||
| style="text-align:center" |{{decrease}} | | style="text-align:center" |{{decrease}}187.1 | ||
| style="text-align:center" |{{decrease}}1,186.5 | | style="text-align:center" |{{decrease}}1,186.5 | ||
| style="text-align:center" |{{increase}}0.4% | | style="text-align:center" |{{increase}}0.4% | ||
| Line 576: | Line 574: | ||
|- | |- | ||
! 2010 | ! 2010 | ||
| style="text-align:center" |{{increase}} | | style="text-align:center" |{{increase}}740 | ||
| style="text-align:center" |{{increase}}4, | | style="text-align:center" |{{increase}}4,283.3 | ||
| style="text-align:center" |{{increase}} | | style="text-align:center" |{{increase}}196.7 | ||
| style="text-align:center" |{{decrease}}1,122.7 | | style="text-align:center" |{{decrease}}1,122.7 | ||
| style="text-align:center" |{{increase}}2.6% | | style="text-align:center" |{{increase}}2.6% | ||
| Line 586: | Line 584: | ||
|- | |- | ||
! 2011 | ! 2011 | ||
| style="text-align:center" |{{increase}} | | style="text-align:center" |{{increase}}780 | ||
| style="text-align:center" |{{increase}}4, | | style="text-align:center" |{{increase}}4,403.0 | ||
| style="text-align:center" |{{increase}} | | style="text-align:center" |{{increase}}230.6 | ||
| style="text-align:center" |{{increase}}1,325.8 | | style="text-align:center" |{{increase}}1,325.8 | ||
| style="text-align:center" |{{increase}}3.6% | | style="text-align:center" |{{increase}}3.6% | ||
| Line 596: | Line 594: | ||
|- | |- | ||
! 2012 | ! 2012 | ||
| style="text-align:center" |{{increase}} | | style="text-align:center" |{{increase}}820 | ||
| style="text-align:center" |{{increase}}4, | | style="text-align:center" |{{increase}}4,516.4 | ||
| style="text-align:center" |{{increase}} | | style="text-align:center" |{{increase}}250.1 | ||
| style="text-align:center" |{{increase}}1,364.8 | | style="text-align:center" |{{increase}}1,364.8 | ||
| style="text-align:center" |{{increase}}3.8% | | style="text-align:center" |{{increase}}3.8% | ||
| Line 606: | Line 604: | ||
|- | |- | ||
! 2013 | ! 2013 | ||
| style="text-align:center" |{{increase}} | | style="text-align:center" |{{increase}}866 | ||
| style="text-align:center" |{{increase}}4, | | style="text-align:center" |{{increase}}4,655.3 | ||
| style="text-align:center" |{{increase}} | | style="text-align:center" |{{increase}}258.7 | ||
| style="text-align:center" |{{increase}}1,378.6 | | style="text-align:center" |{{increase}}1,378.6 | ||
| style="text-align:center" |{{increase}}3.7% | | style="text-align:center" |{{increase}}3.7% | ||
| Line 616: | Line 614: | ||
|- | |- | ||
! 2014 | ! 2014 | ||
| style="text-align:center" |{{increase}} | | style="text-align:center" |{{increase}}912 | ||
| style="text-align:center" |{{increase}}4, | | style="text-align:center" |{{increase}}4,786.2 | ||
| style="text-align:center" |{{increase}} | | style="text-align:center" |{{increase}}271.4 | ||
| style="text-align:center" |{{increase}}1,428.4 | | style="text-align:center" |{{increase}}1,428.4 | ||
| style="text-align:center" |{{increase}}4.1% | | style="text-align:center" |{{increase}}4.1% | ||
| Line 626: | Line 624: | ||
|- | |- | ||
! 2015 | ! 2015 | ||
| style="text-align:center" |{{increase}} | | style="text-align:center" |{{increase}}956 | ||
| style="text-align:center" |{{increase}}4, | | style="text-align:center" |{{increase}}4,893.3 | ||
| style="text-align:center" |{{increase}} | | style="text-align:center" |{{increase}}299.9 | ||
| style="text-align:center" |{{increase}}1,550.5 | | style="text-align:center" |{{increase}}1,550.5 | ||
| style="text-align:center" |{{increase}}4.1% | | style="text-align:center" |{{increase}}4.1% | ||
| Line 636: | Line 634: | ||
|- | |- | ||
! 2016 | ! 2016 | ||
| style="text-align:center" |{{increase}}1, | | style="text-align:center" |{{increase}}1,004 | ||
| style="text-align:center" |{{increase}}5, | | style="text-align:center" |{{increase}}5,016.6 | ||
| style="text-align:center" |{{increase}}313.6 | | style="text-align:center" |{{increase}}313.6 | ||
| style="text-align:center" |{{increase}}1,566.6 | | style="text-align:center" |{{increase}}1,566.6 | ||
| Line 646: | Line 644: | ||
|- | |- | ||
! 2017 | ! 2017 | ||
| style="text-align:center" |{{increase}}1, | | style="text-align:center" |{{increase}}1,069 | ||
| style="text-align:center" |{{increase}}5, | | style="text-align:center" |{{increase}}5,212.2 | ||
| style="text-align:center" |{{increase}}339.2 | | style="text-align:center" |{{increase}}339.2 | ||
| style="text-align:center" |{{increase}}1,653.4 | | style="text-align:center" |{{increase}}1,653.4 | ||
| Line 656: | Line 654: | ||
|- | |- | ||
! 2018 | ! 2018 | ||
| style="text-align:center" |{{increase}}1, | | style="text-align:center" |{{increase}}1,130 | ||
| style="text-align:center" |{{increase}}5, | | style="text-align:center" |{{increase}}5,387.2 | ||
| style="text-align:center" |{{increase}}356.2 | | style="text-align:center" |{{increase}}356.2 | ||
| style="text-align:center" |{{increase}}1,698.0 | | style="text-align:center" |{{increase}}1,698.0 | ||
| Line 666: | Line 664: | ||
|- | |- | ||
! 2019 | ! 2019 | ||
| style="text-align:center" |{{increase}}1, | | style="text-align:center" |{{increase}}1,163 | ||
| style="text-align:center" |{{increase}}5, | | style="text-align:center" |{{increase}}5,434.3 | ||
| style="text-align:center" |{{decrease}}321.1 | | style="text-align:center" |{{decrease}}321.1 | ||
| style="text-align:center" |{{decrease}}1,500.7 | | style="text-align:center" |{{decrease}}1,500.7 | ||
| Line 673: | Line 671: | ||
| style="text-align:center" |{{IncreaseNegative}}6.7% | | style="text-align:center" |{{IncreaseNegative}}6.7% | ||
| style="text-align:center" |{{IncreaseNegative}}6.9% | | style="text-align:center" |{{IncreaseNegative}}6.9% | ||
| style="text-align:center" |{{IncreaseNegative}} | | style="text-align:center" |{{IncreaseNegative}}78.7% | ||
|- | |- | ||
!2020 | !2020 | ||
| style="text-align:center" |{{increase}}1, | | style="text-align:center" |{{increase}}1,186 | ||
| style="text-align:center" |{{ | | style="text-align:center" |{{increase}}5,435.7 | ||
| style="text-align:center" |{{decrease}}300.4 | | style="text-align:center" |{{decrease}}300.4 | ||
| style="text-align:center" |{{decrease}}1,376.5 | | style="text-align:center" |{{decrease}}1,376.5 | ||
| Line 683: | Line 681: | ||
| style="text-align:center" |{{IncreaseNegative}}10.7% | | style="text-align:center" |{{IncreaseNegative}}10.7% | ||
| style="text-align:center" |{{DecreasePositive}}6.6% | | style="text-align:center" |{{DecreasePositive}}6.6% | ||
| style="text-align:center" |{{IncreaseNegative}} | | style="text-align:center" |{{IncreaseNegative}}80.8% | ||
|- | |- | ||
!2021 | !2021 | ||
| style="text-align:center" |{{increase}}1, | | style="text-align:center" |{{increase}}1,285 | ||
| style="text-align:center" |{{increase}}5, | | style="text-align:center" |{{increase}}5,774.5 | ||
| style="text-align:center" |{{increase}}348. | | style="text-align:center" |{{increase}}348.5 | ||
| style="text-align:center" |{{increase}}1, | | style="text-align:center" |{{increase}}1,565.6 | ||
| style="text-align:center" |{{increase}}5. | | style="text-align:center" |{{increase}}5.8% | ||
| style="text-align:center" |{{ | | style="text-align:center" |{{IncreasePositive}}8.9% | ||
| style="text-align:center" |{{DecreasePositive}}6.3% | | style="text-align:center" |{{DecreasePositive}}6.3% | ||
| style="text-align:center" |{{DecreasePositive}}74. | | style="text-align:center" |{{DecreasePositive}}74.7% | ||
|- | |- | ||
!2022 | !2022 | ||
| style="text-align:center" |{{increase}}1, | | style="text-align:center" |{{increase}}1,462 | ||
| style="text-align:center" |{{increase}}6, | | style="text-align:center" |{{increase}}6,440.9 | ||
| style="text-align:center" |{{increase}} | | style="text-align:center" |{{increase}}374.8 | ||
| style="text-align:center" |{{increase}} | | style="text-align:center" |{{increase}}1651.3 | ||
| style="text-align:center" |{{increase}}6. | | style="text-align:center" |{{increase}}6.2% | ||
| style="text-align:center" |{{IncreaseNegative}}12. | | style="text-align:center" |{{IncreaseNegative}}12.2% | ||
| style="text-align:center" |{{DecreasePositive}}6.2% | | style="text-align:center" |{{DecreasePositive}}6.2% | ||
| style="text-align:center" |{{IncreaseNegative}}77.8% | | style="text-align:center" |{{IncreaseNegative}}77.3% | ||
|- | |||
!2023 | |||
| style="text-align:center" |{{increase}}1,512 | |||
| style="text-align:center" |{{increase}}6,530.9 | |||
| style="text-align:center" |{{decrease}}337.8 | |||
| style="text-align:center" |{{decrease}}1,459 | |||
| style="text-align:center" |{{decrease}}-0.2% | |||
| style="text-align:center" |{{IncreaseNegative}}29.2% | |||
| style="text-align:center" |{{IncreaseNegative}}8.5% | |||
| style="text-align:center" |{{IncreaseNegative}}78.2% | |||
|- | |||
!2024 | |||
| style="text-align:center" |{{increase}}1,587 | |||
| style="text-align:center" |{{increase}}6,724 | |||
| style="text-align:center" |{{increase}}373.1 | |||
| style="text-align:center" |{{increase}}1,581 | |||
| style="text-align:center" |{{increase}}2.5% | |||
| style="text-align:center" |{{increasenegative}}23.4% | |||
| style="text-align:center" |{{DecreasePositive}}8.2% | |||
| style="text-align:center" |{{DecreasePositive}}70.1% | |||
|- | |||
!2025 | |||
| style="text-align:center" |{{increase}}1,672 | |||
| style="text-align:center" |{{increase}}6,951 | |||
| style="text-align:center" |n/a | |||
| style="text-align:center" |n/a | |||
| style="text-align:center" |{{increase}}2.6% | |||
| style="text-align:center" |{{increasenegative}}5.1% | |||
| style="text-align:center" |{{DecreasePositive}}8.0% | |||
| style="text-align:center" |{{increasenegative}}73.6% | |||
|} | |} | ||
=== Stock market === | === Stock market === | ||
{{Main|Pakistan Stock Exchange}} | |||
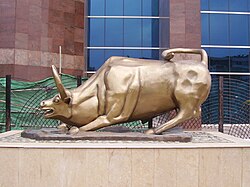
[[File:Islamabad Stock Exchange Bull.JPG|thumb|Statue of a bull outside the [[Islamabad Stock Exchange]]]] | |||
In the first four years of the twenty-first century, Pakistan's [[KSE 100 Index]] was the best-performing [[stock market index]] in the world | |||
In May 2017 American provider of stock market indexes and analysis tools, [[MSCI]] | In the first four years of the twenty-first century, Pakistan's [[KSE 100 Index]] was declared the best-performing [[stock market index]] in the world by the international magazine "Business Week".<ref>{{cite news|last=Shirajiv|first=Sirimane|title=Pakistan-Sri Lanka trade zooming to US$ one billion mark|url=http://www.dailynews.lk/2007/05/23/fin03.asp|archive-url=https://archive.today/20130703021733/http://www.dailynews.lk/2007/05/23/fin03.asp|url-status=dead|archive-date=3 July 2013|access-date=23 May 2007}}</ref>{{Citation needed|date=January 2009}} The stock market capitalization of listed companies in Pakistan was valued at $5,937 million in 2005 by the [[World Bank]].<ref>{{cite web |url=http://web.worldbank.org/WBSITE/EXTERNAL/DATASTATISTICS/0,,contentMDK:20394793~menuPK:1192714~pagePK:64133150~piPK:64133175~theSitePK:239419,00.html |title=Data – Finance |publisher=Web.worldbank.org |access-date=29 July 2010 |url-status=dead |archive-url=https://web.archive.org/web/20100405102322/http://web.worldbank.org/WBSITE/EXTERNAL/DATASTATISTICS/0%2C%2CcontentMDK%3A20394793~menuPK%3A1192714~pagePK%3A64133150~piPK%3A64133175~theSitePK%3A239419%2C00.html |archive-date=5 April 2010 }}</ref> On 11 January 2016, with the aim of reducing market fragmentation and creating a strong case for attracting strategic partnerships necessary for providing technological expertise, all three stock exchanges, including Karachi Stock Exchange, Lahore Stock Exchange, and Islamabad Stock Exchange, were inducted into a unified [[Pakistan Stock Exchange]].<ref>{{cite web|url=https://www.dawn.com/news/1232253|title=Pakistan Stock Exchange formally launched Index |date=11 January 2016 |access-date=12 September 2017|work=Dawn News}}</ref> | ||
In May 2017, the American provider of stock market indexes and analysis tools, [[MSCI]], confirmed that the [[Pakistan Stock Exchange]] (PSX) had been reclassified from Frontier Markets to Emerging Markets in its semi-annual index review.<ref>{{cite web|url=https://www.dawn.com/news/1333488|title=Market dips as MSCI reclassifies PSX to Emerging Markets Index|date=16 May 2017 |access-date=12 September 2017|work=Dawn News}}</ref> The Pakistan Stock Exchange also successfully navigated through the initial COVID-19 induced economic downturn and earned the title of being the 'best Asian stock market and fourth best-performing market across the world in 2020.' The PSE-100 index continued to climb throughout the year. Nearly 40 percent growth in the PSE-100 Index in FY 2021 was driven by the government's large stimulus package, the central bank's stable policy rate, an uptick in large scale manufacturing, improvement in external accounts, and reforms introduced by the [[Security and Exchange Commission of Pakistan]] (SECP) and PSX in the wake of the [[COVID-19 pandemic|COVID-19]].<ref>{{cite web|title=Pakistan economic survey|url=https://www.finance.gov.pk/survey/chapters_21/06-Capital%20markets.pdf|url-status=live|access-date=3 September 2021|website=Finance Division|archive-url=https://web.archive.org/web/20210610225502/http://www.finance.gov.pk/survey/chapters_21/06-Capital%20markets.pdf |archive-date=10 June 2021 }}</ref> | |||
PSX 100 index growth rate over the previous years is as follows:<ref>{{Cite web|url=https://finance.gov.pk/survey/chapter_25/social_indicators.pdf|title=Social Indicators {{!}} Pakistan Economic Survey 2024-25}}</ref> | |||
{| class="wikitable" | {| class="wikitable" | ||
|- | |- | ||
! List | ! List | ||
! FY 2008 | ! FY 2008 | ||
! FY 2009 | ! FY 2009 | ||
| Line 733: | Line 763: | ||
! FY 2021 | ! FY 2021 | ||
! FY 2022 | ! FY 2022 | ||
!FY 2023 | |||
!FY 2024 | |||
|- | |- | ||
|<small>'''PSX 100 index growth %'''</small> | |<small>'''PSX 100 index growth %'''</small> | ||
| style="text-align:center" | {{decrease}} -10.8 | | style="text-align:center" | {{decrease}} -10.8 | ||
| style="text-align:center" | {{decrease}} -41.7 | | style="text-align:center" | {{decrease}} -41.7 | ||
| Line 752: | Line 782: | ||
| style="text-align:center" | {{increase}} 37.6 | | style="text-align:center" | {{increase}} 37.6 | ||
| style="text-align:center" |{{decrease}} -12.3 | | style="text-align:center" |{{decrease}} -12.3 | ||
|{{decrease}} -0.2 | |||
|{{increase}} 89.2 | |||
|} | |} | ||
The sales of all | |||
The sales of all non-financial companies surged to Rs 16,815 billion in the fiscal year 2023, marking a substantial increase of Rs 1,864 billion compared to the preceding year. However, the [[net profit margin]] of all companies declined to 5.98% in FY23 from 6.34% in FY22. [[Return on assets]] (ROA) and [[return on equity]] (ROE) of all companies also dropped to 6.05 percent and 17.76 percent respectively in FY23. The key statistics for the last six years of all public and private non-financial companies listed at the [[Pakistan Stock Exchange]] are provided in the following table:<ref>{{Cite web |title=Financial Statements Analysis (Non-financial Companies) |url=https://www.sbp.org.pk/reports/annual/FSANFC/2023/PDF/Complete.pdf |access-date=2024-09-14 |website=sbp.org.pk}}</ref> | |||
{| class="wikitable" | {| class="wikitable" | ||
|+Financial | |+Financial analysis of companies (non-financial) (billion rupees) | ||
!List | !List | ||
!2018 | !2018 | ||
!2019 | !2019 | ||
!2020 | !2020 | ||
!2021 | !2021 | ||
!2022 | |||
!2023 | |||
|- | |- | ||
|Total | |Total assets | ||
| | |{{increase}} 8,811 | ||
|{{increase}} | |{{increase}} 10,097 | ||
|{{increase}} | |{{increase}} 10,755 | ||
|{{increase}} | |{{increase}} 12,201 | ||
|{{increase}} | |{{increase}} 15,685 | ||
|{{increase}} | |{{increase}} 17,549 | ||
|- | |- | ||
|Total | |Total liabilities | ||
| | |{{IncreaseNegative}} 5,574 | ||
|{{IncreaseNegative}} | |{{IncreaseNegative}} 6,610 | ||
|{{IncreaseNegative}} | |{{IncreaseNegative}} 7,029 | ||
|{{IncreaseNegative}} | |{{IncreaseNegative}} 7,869 | ||
|{{ | |{{increase}} 10,568 | ||
|{{ | |{{increase}} 11,346 | ||
|- | |- | ||
| | |Total sales | ||
| | |{{increase}} 7,662 | ||
|{{increase}} | |{{increase}} 8,811 | ||
|{{ | |{{decrease}} 7,999 | ||
|{{increase}} | |{{increase}} 9,437 | ||
|{{increase}} | |{{increase}} 14,568 | ||
|{{increase}} | |{{increase}} 16,815 | ||
|- | |- | ||
|Profit before tax | |||
|{{increase}} 608 | |||
|Profit | |||
|{{increase}} | |||
|{{decrease}} 612 | |{{decrease}} 612 | ||
|{{decrease}} | |{{decrease}} 480 | ||
|{{increase}} | |{{increase}} 1,011 | ||
|{{increase}} 1,439 | |||
|{{increase}} 1,624 | |||
|- | |- | ||
|Profit | |Profit after tax | ||
| | |{{decrease}} 427 | ||
|{{ | |{{decrease}} 413 | ||
|{{decrease}} | |{{decrease}} 320 | ||
|{{ | |{{increase}} 749 | ||
|{{ | |{{increase}} 924 | ||
|{{increase}} | |{{increase}} 1,005 | ||
|- | |- | ||
! colspan=" | ! colspan="5" |'''%''' | ||
! | |||
! | |||
|- | |- | ||
|Net | |Net profit margin | ||
| | |{{decrease}} 5.57 | ||
|{{ | |{{decrease}} 4.68 | ||
|{{decrease}} | |{{decrease}} 4.00 | ||
|{{ | |{{increase}} 7.93 | ||
|{{decrease}} | |{{decrease}} 6.34 | ||
|{{ | |{{decrease}} 5.98 | ||
|- | |- | ||
|Return on | |Return on assets | ||
| | |{{increase}} 5.19 | ||
|{{ | |{{decrease}} 4.36 | ||
|{{ | |{{decrease}} 3.07 | ||
|{{ | |{{increase}} 6.52 | ||
|{{ | |{{increase}} 6.63 | ||
|{{ | |{{decrease}} 6.05 | ||
|- | |- | ||
|Return on | |Return on equity | ||
|13. | |{{decrease}} 13.65 | ||
|{{ | |{{decrease}} 12.27 | ||
|{{decrease}} | |{{decrease}} 8.87 | ||
|{{ | |{{increase}} 18.59 | ||
|{{ | |{{increase}} 19.56 | ||
|{{ | |{{decrease}} 17.76 | ||
|- | |- | ||
| | |Earnings per share | ||
|{{decrease}} 4.43 | |||
|{{decrease}} 4. | |||
|{{decrease}} 4.17 | |{{decrease}} 4.17 | ||
|{{decrease}} 3. | |{{decrease}} 3.15 | ||
|{{increase}} | |{{increase}} 7.07 | ||
|{{increase}} 8.31 | |||
|{{increase}}8.32 | |||
|} | |} | ||
=== Informal economy === | |||
The [[informal economy]] in Pakistan comprises economic activities and assets that are not fully captured by formal regulation, taxation, or national accounts. Estimates of its size vary according to methodology and definitions, but multiple sources indicate that the informal sector remains a substantial component of the country’s economic structure. A ''[[Dawn (newspaper)|Dawn]]'' analysis noted that the documented economy was estimated at about US $340 billion in 2023, whereas the informal economy was projected at roughly US $457 billion, indicating that the informal economy may exceed the formal economy in overall size.<ref>{{Cite web |last=Bokhari |first=Jawaid |date=2024-12-02 |title=Documenting the informal economy |url=https://www.dawn.com/news/1876163 |access-date=2026-01-21 |website=Dawn |language=en}}</ref> | |||
According to a recent labour force survey, 72.1% of non-agricultural employment was classified as informal in 2024–25, with informal work particularly prevalent in rural areas.<ref>{{Cite web |last= |title=Over 72% of workers employed in informal sector in Pakistan during 2024-25 |url=https://www.inp.net.pk/ur/article-detail/inp-wealthpk/over-72-of-workers-employed-in-informal-sector-in-pakistan-during-2024-25 |access-date=2026-01-21 |website=www.inp.net.pk |language=en}}</ref> The informal economy in Pakistan includes a wide range of activities such as unregistered manufacturing, retail, construction, transport, domestic work, and small enterprises. While it provides livelihoods for many households, its unrecorded nature complicates taxation and regulation, and policymakers have periodically highlighted the challenges and fiscal implications of informality.<ref>{{Cite web |last=Kardar |first=Nadeem ul Haque {{!}} Shahid |date=2025-07-18 |title=In defence of the informal economy |url=https://www.dawn.com/news/1924927 |access-date=2026-01-21 |website=Dawn |language=en}}</ref> | |||
Households also accumulate physical commodities such as gold and jewellery as part of their saving strategies; a significant portion of savings in Pakistan resides in informal instruments and physical assets, including gold, which are not entirely captured by formal statistics. Historical estimates once suggest Pakistanis might hold 3,000 to 5,000 tonnes of gold, indicating a possible range of US $40 billion to US $70 billion in household gold wealth as of 2025.<ref>{{Cite web |title=How much gold do Pakistanis own? {{!}} Nukta |url=https://nukta.com/pakistan-gold-ownership |access-date=2026-01-21 |website=nukta.com |language=en}}</ref> | |||
=== Middle class === | === Middle class === | ||
{{See also|Labour force of Pakistan}} | {{See also|Labour force of Pakistan}} | ||
[[File:Office Building Karachi Pakistan.png|thumb|The Dawood Centre in [[Karachi]], M.T. Khan Road]] | |||
Separately, consumer financing recorded at Rs. 179 billion during | {{as of|2017}}, according to the ''[[Wall Street Journal]]'', citing estimates largely based on income and the purchase of consumption goods, had suggested that as many as 42% of Pakistan's population may now belong to the [[Upper class|upper]] and [[middle class]]es. If these numbers are correct, or even indicative in any broad sense, then 87 million Pakistanis belong to the middle and upper classes, a population size which is larger than that of Germany.<ref name="CH">{{cite web |title=Credit for Housing and Construction |url=https://www.sbp.org.pk/MpMG/progress.html |access-date=22 August 2022 |website=sbp.org.pk}}</ref> Official figures also show that the proportion of households that own a motorcycle and washing machines has grown impressively over the past 15 years.<ref>{{cite web|url=https://tribune.com.pk/story/1398602/pakistans-middle-class-continues-grow-rapid-pace/|title=Pakistan's middle class continues to grow at a rapid pace|date=2 May 2017|website=The Express Tribune|access-date=30 September 2018}}</ref> Furthermore, the IBA-SBP Consumer Confidence Index recorded its highest-ever level of 174.9 points in January 2017, showing an increase of 17 points from July 2016. | ||
Separately, consumer financing recorded at Rs. 179 billion during FY 2022. Auto finance continued to be the dominant segment, followed by house building, which showed remarkable growth after the ''Mera Pakistan Mera Ghar'' scheme initiated by the State Bank of Pakistan in December 2020.<ref name="CH"/><ref name="CL"/> | |||
=== Poverty alleviation expenditures === | === Poverty alleviation expenditures === | ||
{{Main|Poverty in Pakistan}} | {{Main|Poverty in Pakistan}} | ||
Pakistan government spent over 1 trillion rupees (about $16.7 billion) on poverty alleviation | |||
The Pakistan government spent over 1 trillion rupees (about $16.7 billion) on poverty alleviation programs during the past four years, reducing poverty from 35% in 2000–01 to 29.3% in 2013 and further to 17% in 2015.<ref>{{cite web|url=http://data.worldbank.org/country/pakistan|title=Pakistan – Data|website=data.worldbank.org}}</ref> Rural poverty remains a pressing issue, as development in those areas has been significantly slower than in major urban areas. | |||
However, according to a World Bank report released in June 2025, around 45% of Pakistan's population was living below the poverty line. The updated figure was based on revised poverty thresholds and survey data from 2018 to 2019. The report also noted a sharp rise in extreme poverty, with the proportion increasing from 4.9% to 16.5%.<ref>{{Cite web |last=Kiani |first=Khaleeq |date=2025-06-06 |title=45pc of Pakistanis live below poverty line: WB |url=https://www.dawn.com/news/1915759 |access-date=2025-06-17 |website=DAWN.COM |language=en}}</ref> As of 2025, the World Bank cautioned that over 10 million additional individuals in Pakistan faced the looming threat of descending into poverty.<ref>{{Cite web |last=Rana |first=Shahbaz |date=2024-04-03 |title=Over 10m Pakistanis may slip into poverty: WB |url=https://tribune.com.pk/story/2461459/over-10m-pakistanis-may-slip-into-poverty-wb |access-date=2025-06-17 |website=The Express Tribune |language=en}}</ref> | |||
=== Employment === | === Employment === | ||
The high population growth in the past few decades has | The high population growth in the past few decades has led to a significant number of young people entering the labor market. Although Pakistan is among the six most populous Asian nations, excessive red tape in the past made firing from jobs, and consequently hiring, difficult.<ref>{{cite web |title=Financial Statements Analysis of Companies |url=https://www.sbp.org.pk/departments/stats/FSA(Non).pdf |url-status=live |archive-url=https://web.archive.org/web/20190303101525/http://www.sbp.org.pk/departments/stats/FSA(Non).pdf |archive-date=3 March 2019 |access-date=25 July 2022 |website=sbp.org.pk |publisher=SBP }}</ref> Significant progress in taxation and business reforms has ensured that many firms are no longer compelled to operate in the underground economy.<ref>{{cite web|url=https://www.cia.gov/library/publications/the-world-factbook/rankorder/2129rank.html|title=The World Factbook — Central Intelligence Agency|website=cia.gov|access-date=30 May 2007|archive-date=22 April 2016|archive-url=https://web.archive.org/web/20160422083303/https://www.cia.gov/library/publications/the-world-factbook/rankorder/2129rank.html|url-status=dead}}</ref> | ||
=== Government revenues and expenditures === | === Government revenues and expenditures === | ||
{{Main|Taxation in Pakistan}} | {{Main|Taxation in Pakistan}} | ||
[[File:Clifton Beach, Karachi - Pakistan.jpg|thumb|[[Clifton, Karachi|Clifton]] in Karachi]] | |||
Conversely, government expenditures are strategically allocated across multiple sectors, including defense, social services, infrastructure development, and debt servicing. Current expenditures, covering operational costs, interest payments, pensions, and other obligations, are carefully balanced against development expenditures aimed at fostering long-term growth and progress. The challenge of achieving equilibrium between revenue generation and expenditure allocation leads to budgetary deficits that can necessitate borrowing to bridge the gap. | Although the country is a Federation with constitutional division of taxation powers between the [[Government of Pakistan|Federal Government]] and the four provinces, the revenue department of the Federal Government, the [[Federal Board of Revenue]], collects more than 80% of the entire national tax collection. The government's revenue streams primarily stem from two sources: [[taxation]] and [[non-tax revenue]]. Taxation, which includes [[income tax]], [[sales tax]], and [[customs duties]], constitutes a substantial portion of revenues, bolstering both federal and provincial government finances. Non-tax revenue sources, such as mark-up from state enterprises, surplus profits from the [[State Bank of Pakistan]], and royalties on oil and gas, further contribute significantly to the fiscal framework. | ||
Conversely, government expenditures are strategically allocated across multiple sectors, including defense, social services, infrastructure development, and debt servicing. Current expenditures, covering operational costs, interest payments, pensions, and other obligations, are carefully balanced against development expenditures aimed at fostering long-term growth and progress. The challenge of achieving equilibrium between revenue generation and expenditure allocation leads to [[Government budget balance|budgetary deficits]] that can necessitate borrowing to bridge the gap. | |||
The data has been sourced from the Ministry of Finance.<ref>{{cite web |title=consolidated fiscal operations |url=http://www.finance.gov.pk/fiscal_main.html |url-status=live |archive-url=https://web.archive.org/web/20100608090837/http://www.finance.gov.pk/fiscal_main.html |archive-date=8 June 2010 |access-date=2024-08-03 |website=Ministry of Finance }}</ref> | |||
{| class="wikitable" | {| class="wikitable" | ||
|+Consolidated | |+Consolidated federal and provincial fiscal operations (amounts in billion PKR) | ||
! List | ! List | ||
! FY 2008 | ! FY 2008 | ||
| Line 887: | Line 930: | ||
! FY 2022 | ! FY 2022 | ||
!FY 2023 | !FY 2023 | ||
!FY2024 | |||
!FY 2025 | |||
|- | |- | ||
| style="text-align:left" | '''Total | | style="text-align:left" | '''Total revenue''' | ||
| style="text-align:center" |{{increase}} | | style="text-align:center" |{{increase}} 1,499 | ||
| style="text-align:center" |{{increase}} | | style="text-align:center" |{{increase}} 1,851 | ||
| style="text-align:center" |{{increase}} | | style="text-align:center" |{{increase}} 2,078 | ||
| style="text-align:center" |{{increase}} | | style="text-align:center" |{{increase}} 2,253 | ||
| style="text-align:center" |{{increase}} | | style="text-align:center" |{{increase}} 2,567 | ||
| style="text-align:center" |{{increase}} | | style="text-align:center" |{{increase}} 2,982 | ||
| style="text-align:center" |{{increase}} | | style="text-align:center" |{{increase}} 3,637 | ||
| style="text-align:center" |{{increase}} | | style="text-align:center" |{{increase}} 3,931 | ||
| style="text-align:center" |{{increase}} | | style="text-align:center" |{{increase}} 4,447 | ||
| style="text-align:center" |{{increase}} | | style="text-align:center" |{{increase}} 4,937 | ||
| style="text-align:center" |{{increase}} | | style="text-align:center" |{{increase}} 5,228 | ||
| style="text-align:center" |{{decrease}} | | style="text-align:center" |{{decrease}} 4,901 | ||
| style="text-align:center" |{{increase}} | | style="text-align:center" |{{increase}} 6,272 | ||
| style="text-align:center" |{{increase}} | | style="text-align:center" |{{increase}} 6,903 | ||
| style="text-align:center" |{{increase}} | | style="text-align:center" |{{increase}} 8,035 | ||
| style="text-align:center" |{{increase}} | | style="text-align:center" |{{increase}} 9,634 | ||
| style="text-align:center" |{{increase}}13,269 | |||
| style="text-align:center" |{{increase}}17,997 | |||
|- | |- | ||
| style="text-align:center" | Tax | | style="text-align:center" | Tax revenue | ||
| style="text-align:center" |{{increase}} | | style="text-align:center" |{{increase}} 1,065 | ||
| style="text-align:center" |{{increase}} | | style="text-align:center" |{{increase}} 1,317 | ||
| style="text-align:center" |{{increase}} | | style="text-align:center" |{{increase}} 1,473 | ||
| style="text-align:center" |{{increase}} | | style="text-align:center" |{{increase}} 1,699 | ||
| style="text-align:center" |{{increase}} | | style="text-align:center" |{{increase}} 2,053 | ||
| style="text-align:center" |{{increase}} | | style="text-align:center" |{{increase}} 2,199 | ||
| style="text-align:center" |{{increase}} | | style="text-align:center" |{{increase}} 2,565 | ||
| style="text-align:center" |{{increase}} | | style="text-align:center" |{{increase}} 3,018 | ||
| style="text-align:center" |{{increase}} | | style="text-align:center" |{{increase}} 3,660 | ||
| style="text-align:center" |{{increase}} | | style="text-align:center" |{{increase}} 3,969 | ||
| style="text-align:center" |{{increase}} | | style="text-align:center" |{{increase}} 4,467 | ||
| style="text-align:center" |{{increase}} | | style="text-align:center" |{{increase}} 4,473 | ||
| style="text-align:center" |{{increase}} | | style="text-align:center" |{{increase}} 4,748 | ||
| style="text-align:center" |{{increase}} | | style="text-align:center" |{{increase}} 5,272 | ||
| style="text-align:center" |{{increase}} | | style="text-align:center" |{{increase}} 6,755 | ||
| style="text-align:center" |{{increase}} | | style="text-align:center" |{{increase}} 7,819 | ||
| style="text-align:center" |{{increase}}10,085 | |||
| style="text-align:center" |{{increase}}12,723 | |||
|- | |- | ||
| style="text-align:right" | | style="text-align:right" |FBR taxes | ||
| style="text-align:center" |{{increase}} | | style="text-align:center" |{{increase}} 1,008 | ||
| style="text-align:center" |{{increase}} | | style="text-align:center" |{{increase}} 1,161 | ||
| style="text-align:center" |{{increase}} | | style="text-align:center" |{{increase}} 1,327 | ||
| style="text-align:center" |{{increase}} | | style="text-align:center" |{{increase}} 1,558 | ||
| style="text-align:center" |{{increase}} | | style="text-align:center" |{{increase}} 1,883 | ||
| style="text-align:center" |{{increase}} | | style="text-align:center" |{{increase}} 1,946 | ||
| style="text-align:center" |{{increase}} | | style="text-align:center" |{{increase}} 2,255 | ||
| style="text-align:center" |{{increase}} | | style="text-align:center" |{{increase}} 2,590 | ||
| style="text-align:center" |{{increase}} | | style="text-align:center" |{{increase}} 3,113 | ||
| style="text-align:center" |{{increase}} | | style="text-align:center" |{{increase}} 3,368 | ||
| style="text-align:center" |{{increase}} | | style="text-align:center" |{{increase}} 3,842 | ||
| style="text-align:center" |{{decrease}} | | style="text-align:center" |{{decrease}} 3,830 | ||
| style="text-align:center" |{{increase}} | | style="text-align:center" |{{increase}} 3,998 | ||
| style="text-align:center" |{{increase}} | | style="text-align:center" |{{increase}} 4,764 | ||
| style="text-align:center" |{{increase}} | | style="text-align:center" |{{increase}} 6,143 | ||
| style="text-align:center" |{{increase}} | | style="text-align:center" |{{increase}} 7,169 | ||
| style="text-align:center" |{{increase}} 9,311 | |||
| style="text-align:center" |{{increase}}11,744 | |||
|- | |- | ||
| '''Total | | '''Total expenditure''' | ||
| style="text-align:center" |{{IncreaseNegative}} | | style="text-align:center" |{{IncreaseNegative}} 2,277 | ||
| style="text-align:center" |{{IncreaseNegative}} | | style="text-align:center" |{{IncreaseNegative}} 2,531 | ||
| style="text-align:center" |{{IncreaseNegative}} | | style="text-align:center" |{{IncreaseNegative}} 3,007 | ||
| style="text-align:center" |{{IncreaseNegative}} | | style="text-align:center" |{{IncreaseNegative}} 3,447 | ||
| style="text-align:center" |{{IncreaseNegative}} | | style="text-align:center" |{{IncreaseNegative}} 3,936 | ||
| style="text-align:center" |{{IncreaseNegative}} | | style="text-align:center" |{{IncreaseNegative}} 4,816 | ||
| style="text-align:center" |{{IncreaseNegative}} | | style="text-align:center" |{{IncreaseNegative}} 5,026 | ||
| style="text-align:center" |{{IncreaseNegative}} | | style="text-align:center" |{{IncreaseNegative}} 5,388 | ||
| style="text-align:center" |{{IncreaseNegative}} | | style="text-align:center" |{{IncreaseNegative}} 5,796 | ||
| style="text-align:center" |{{IncreaseNegative}} | | style="text-align:center" |{{IncreaseNegative}} 6,801 | ||
| style="text-align:center" |{{IncreaseNegative}} | | style="text-align:center" |{{IncreaseNegative}} 7,488 | ||
| style="text-align:center" |{{IncreaseNegative}} | | style="text-align:center" |{{IncreaseNegative}} 8,346 | ||
| style="text-align:center" |{{IncreaseNegative}} | | style="text-align:center" |{{IncreaseNegative}} 9,649 | ||
| style="text-align:center" |{{IncreaseNegative}} | | style="text-align:center" |{{IncreaseNegative}} 10,307 | ||
| style="text-align:center" |{{IncreaseNegative}} | | style="text-align:center" |{{IncreaseNegative}} 13,295 | ||
| style="text-align:center" |{{IncreaseNegative}} | | style="text-align:center" |{{IncreaseNegative}} 16,155 | ||
| style="text-align:center" |{{IncreaseNegative}}20,476 | |||
| style="text-align:center" |{{IncreaseNegative}}24,166 | |||
|- | |- | ||
|'''Fiscal | |'''Fiscal deficit''' | ||
| style="text-align:center" |{{IncreaseNegative}}777 | | style="text-align:center" |{{IncreaseNegative}}777 | ||
| style="text-align:center" |{{DecreasePositive}}680 | | style="text-align:center" |{{DecreasePositive}}680 | ||
| style="text-align:center" |{{IncreaseNegative}}929 | | style="text-align:center" |{{IncreaseNegative}}929 | ||
| style="text-align:center" |{{IncreaseNegative}} | | style="text-align:center" |{{IncreaseNegative}}1,194 | ||
| style="text-align:center" |{{IncreaseNegative}} | | style="text-align:center" |{{IncreaseNegative}}1,370 | ||
| style="text-align:center" |{{IncreaseNegative}} | | style="text-align:center" |{{IncreaseNegative}}1,834 | ||
| style="text-align:center" |{{DecreasePositive}} | | style="text-align:center" |{{DecreasePositive}}1,389 | ||
| style="text-align:center" |{{IncreaseNegative}} | | style="text-align:center" |{{IncreaseNegative}}1,457 | ||
| style="text-align:center" |{{DecreasePositive}} | | style="text-align:center" |{{DecreasePositive}}1,349 | ||
| style="text-align:center" |{{IncreaseNegative}} | | style="text-align:center" |{{IncreaseNegative}}1,864 | ||
| style="text-align:center" |{{IncreaseNegative}} | | style="text-align:center" |{{IncreaseNegative}}2,260 | ||
| style="text-align:center" |{{IncreaseNegative}} | | style="text-align:center" |{{IncreaseNegative}}3,445 | ||
| style="text-align:center" |{{DecreasePositive}} | | style="text-align:center" |{{DecreasePositive}}3,376 | ||
| style="text-align:center" |{{IncreaseNegative}} | | style="text-align:center" |{{IncreaseNegative}}3,403 | ||
| style="text-align:center" |{{IncreaseNegative}} | | style="text-align:center" |{{IncreaseNegative}}5,260 | ||
| style="text-align:center" |{{IncreaseNegative}} | | style="text-align:center" |{{IncreaseNegative}}6,521 | ||
| style="text-align:center" |{{IncreaseNegative}} 7,207 | |||
| style="text-align:center" |{{DecreasePositive}}6,168 | |||
|- | |- | ||
! colspan=" | ! colspan="19" |'''As % of GDP''' | ||
|- | |- | ||
| Total Revenue | | Total Revenue | ||
| Line 999: | Line 1,052: | ||
| style="text-align:center" |{{decrease}}12.0 | | style="text-align:center" |{{decrease}}12.0 | ||
| style="text-align:center" |{{decrease}}11.4 | | style="text-align:center" |{{decrease}}11.4 | ||
| style="text-align:center" |{{increase}} 12.5 | |||
| style="text-align:center" |{{increase}}15.7 | |||
|- | |- | ||
|Tax | |Tax revenue | ||
| style="text-align:center" |{{increase}}9.9 | | style="text-align:center" |{{increase}}9.9 | ||
| style="text-align:center" |{{decrease}}9.1 | | style="text-align:center" |{{decrease}}9.1 | ||
| Line 1,017: | Line 1,072: | ||
| style="text-align:center" |{{increase}}10.1 | | style="text-align:center" |{{increase}}10.1 | ||
| style="text-align:center" |{{decrease}}9.2 | | style="text-align:center" |{{decrease}}9.2 | ||
| style="text-align:center" |{{increase}}9.5 | |||
| style="text-align:center" |{{increase}}11.1 | |||
|- | |- | ||
| Total | | Total expenditure | ||
| style="text-align:center" |{{IncreaseNegative}}21.4 | | style="text-align:center" |{{IncreaseNegative}}21.4 | ||
| style="text-align:center" |{{Decreasepositive}}19.2 | | style="text-align:center" |{{Decreasepositive}}19.2 | ||
| Line 1,035: | Line 1,092: | ||
| style="text-align:center" |{{IncreaseNegative}}19.9 | | style="text-align:center" |{{IncreaseNegative}}19.9 | ||
| style="text-align:center" |{{DecreasePositive}}19.1 | | style="text-align:center" |{{DecreasePositive}}19.1 | ||
| style="text-align:center" |{{IncreaseNegative}} 19.3 | |||
| style="text-align:center" |{{IncreaseNegative}} 21.1 | |||
|- | |- | ||
|[[Government budget deficit|Fiscal | |[[Government budget deficit|Fiscal deficit]] | ||
| style="text-align:center" |{{IncreaseNegative}}7.3 | | style="text-align:center" |{{IncreaseNegative}}7.3 | ||
| style="text-align:center" |{{Decreasepositive}}5.2 | | style="text-align:center" |{{Decreasepositive}}5.2 | ||
| Line 1,053: | Line 1,112: | ||
| style="text-align:center" |{{IncreaseNegative}}7.9 | | style="text-align:center" |{{IncreaseNegative}}7.9 | ||
| style="text-align:center" |{{DecreasePositive}}7.7 | | style="text-align:center" |{{DecreasePositive}}7.7 | ||
| style="text-align:center" |{{DecreasePositive}} 6.8 | |||
| style="text-align:center" |{{DecreasePositive}}5.4 | |||
|} | |} | ||
| Line 1,059: | Line 1,120: | ||
=== Rupee === | === Rupee === | ||
The Pakistani rupee was [[Fixed exchange rate system|pegged]] to the [[pound sterling]] until 1982, when the government of [[General Zia-ul-Haq]], changed it to a [[managed float regime]]. | The basic unit of currency is the [[Pakistani rupee|rupee]], ISO code PKR, and abbreviated Rs, which is divided into 100 paisas. Currently, the 5,000 rupee note is the largest denomination in circulation. From 13 August 2005, the SBP started introducing its fifth generation design of banknotes with additional security features, with the Rs. 20 note being the first issuance. New designs of Rs. 5 (July 2008, later replaced by a coin), 10 (May 2006), Rs. 20 (March 2008, new color scheme), Rs. 50 (July 2008), Rs. 100 (November 2006), Rs. 500 (January 2010), Rs. 1000 (February 2007), and Rs. 5000 (May 2006) were gradually introduced.<ref>{{Cite web |title=State Bank of Pakistan |url=https://www.sbp.org.pk/BankNotes/banknotes.htm |access-date=6 April 2022 |website=sbp.org.pk}}</ref><ref>{{Cite web |last=Dawn.com |date=9 November 2021 |title=SBP rejects reports of new designs for currency notes |url=https://www.dawn.com/news/1656982 |access-date=6 April 2022 |website=Dawn |language=en}}</ref><ref>{{Cite web |title=State Bank of Pakistan |url=https://www.sbp.org.pk/finance/Pak-his.asp |access-date=6 April 2022 |website=sbp.org.pk}}</ref> | ||
The Pakistani rupee was [[Fixed exchange rate system|pegged]] to the [[pound sterling]] until 1982, when the government of [[General Zia-ul-Haq]], changed it to a [[managed float regime]]. As a result, the rupee devalued by 38.5% between 1982/83, and many of the industries built by his predecessor suffered a huge surge in import costs. After years of appreciation under [[Zulfikar Ali Bhutto]] and despite huge increases in foreign aid, the rupee depreciated. | |||
=== Foreign exchange rate === | === Foreign exchange rate === | ||
The Pakistani rupee depreciated against the US dollar until around the start of the 21st century, when Pakistan's large current-account surplus pushed the value of the rupee up versus the dollar. Pakistan's central bank then | The Pakistani rupee depreciated against the US dollar until around the start of the 21st century, when Pakistan's large current-account surplus pushed the value of the rupee up versus the dollar. Pakistan's central bank then stabilized by lowering interest rates and buying dollars, in order to preserve the country's export competitiveness. | ||
{| class="wikitable" | {| class="wikitable" | ||
|+US$ to PKR average exchange rates<ref>{{cite web |title=Monthly Average Exchange Rates |url=https://www.sbp.org.pk/ecodata/IBF_Arch.xls |url-status=live |archive-url=https://web.archive.org/web/20101130004519/http://sbp.org.pk/ecodata/IBF_arch.xls |archive-date=30 November 2010 |access-date=2023 | |+US$ to PKR average exchange rates<ref>{{cite web |title=Monthly Average Exchange Rates |url=https://www.sbp.org.pk/ecodata/IBF_Arch.xls |url-status=live |archive-url=https://web.archive.org/web/20101130004519/http://sbp.org.pk/ecodata/IBF_arch.xls |archive-date=30 November 2010 |access-date=21 August 2023 |website=SBP}}</ref> | ||
!2008 | !2008 | ||
!2009 | !2009 | ||
| Line 1,083: | Line 1,146: | ||
!2022 | !2022 | ||
!2023 | !2023 | ||
!2024 | |||
!2025 | |||
|- | |- | ||
|62.55 | |style="text-align:center" | {{IncreaseNegative}}62.55 | ||
|78.50 | |style="text-align:center" |{{IncreaseNegative}}78.50 | ||
|83.80 | |style="text-align:center" |{{IncreaseNegative}}83.80 | ||
|85.50 | |style="text-align:center" |{{IncreaseNegative}}85.50 | ||
|89.23 | |style="text-align:center" |{{IncreaseNegative}}89.23 | ||
|96.73 | |style="text-align:center" |{{IncreaseNegative}}96.73 | ||
|102.86 | |style="text-align:center" |{{IncreaseNegative}}102.86 | ||
|101.29 | |style="text-align:center" |{{DecreasePositive}}101.29 | ||
|104.23 | |style="text-align:center" |{{IncreaseNegative}}104.23 | ||
|104.70 | |style="text-align:center" |{{IncreaseNegative}}104.70 | ||
|109.84 | |style="text-align:center" |{{IncreaseNegative}}109.84 | ||
|136.09 | |style="text-align:center" |{{IncreaseNegative}}136.09 | ||
|158.02 | |style="text-align:center" |{{IncreaseNegative}}158.02 | ||
|160.02 | |style="text-align:center" |{{IncreaseNegative}}160.02 | ||
|177.45 | |style="text-align:center" |{{IncreaseNegative}}177.45 | ||
|248.04 | |style="text-align:center" |{{IncreaseNegative}}248.04 | ||
|style="text-align:center" |{{IncreaseNegative}}282.90 | |||
|style="text-align:center" |{{DecreasePositive}}279.35 | |||
|} | |} | ||
=== Foreign exchange reserves === | === Foreign exchange reserves === | ||
Pakistan maintains foreign reserves with the [[State Bank of Pakistan]]. The currency of the reserves was solely the US dollar, incurring speculated losses after the dollar prices fell during 2005, forcing the then Governor SBP [[Ishrat Hussain]] to step down. In the same year, the SBP issued an official statement proclaiming diversification of reserves in currencies including Euro and Yen, withholding the ratio of diversification. | |||
[[File:Skyline view in Karachi after lockdown.jpg|thumb|Karachi, the economic capital of Pakistan]] | |||
Following the international credit crisis and spikes in crude oil prices, Pakistan's economy could not withstand the pressure, and on 11 October 2008, the State Bank of Pakistan reported that the country's foreign exchange reserves had gone down by $571.9 million to $7,749.7 million.<ref>{{cite web|url=http://www.forexpk.com/ |title=Forex Currency Rates Pakistan – Forex Open Market Rates – Prize Bond Draw Result – Rates and schedule – Finance News & Updates |publisher=Forexpk.com |date=6 January 2014 |access-date=11 January 2014}}</ref> The foreign exchange reserves had declined by more than $10 billion to a level of $6.59 billion. In June 2013, Pakistan was on the brink of default on its financial commitments. The country's forex reserves were at a historic low, covering only two weeks' worth of imports. In January 2020, Pakistan's foreign exchange reserves stood at US$11.503 billion.<ref>{{cite web|title=State Bank of Pakistan forex reserves rise to $11.5bln|url=https://www.thenews.com.pk/print/596060-state-bank-of-pakistan-forex-reserves-rise-to-11-5bln|website=thenews.com.pk|date=10 January 2020|access-date=6 November 2020}}</ref> | |||
{| class="wikitable" | {| class="wikitable" | ||
|+Amounts in | |+Amounts in billion US dollars<ref>{{cite web|title=Liquid Foreign Exchange Reserves|url=http://www.sbp.org.pk/ecodata/Forex_Arch.xlsx|access-date=15 May 2020|website=SBP}}</ref><ref>{{cite web |title=Liquid Foreign Exchange Reserves |url=https://www.sbp.org.pk/ecodata/Forex_Arch.xlsx |access-date=27 July 2023 |website=SBP}}</ref> | ||
! List | ! List | ||
! Jun 2008 | ! Jun 2008 | ||
| Line 1,126: | Line 1,195: | ||
! Jun 2022 | ! Jun 2022 | ||
!Jun 2023 | !Jun 2023 | ||
!Jun 2024 | |||
!Jun 2025 | |||
|- | |- | ||
| style="text-align:left" |'''Total | | style="text-align:left" |'''Total reserves''' | ||
| style="text-align:center" |{{decrease}} 11.4 | | style="text-align:center" |{{decrease}} 11.4 | ||
| style="text-align:center" |{{increase}} 12.4 | | style="text-align:center" |{{increase}} 12.4 | ||
| Line 1,144: | Line 1,215: | ||
| style="text-align:center" |{{decrease}} 15.5 | | style="text-align:center" |{{decrease}} 15.5 | ||
| style="text-align:center" |{{decrease}} 9.2 | | style="text-align:center" |{{decrease}} 9.2 | ||
|style="text-align:center" |{{increase}} 14.0 | |||
|style="text-align:center" |{{increase}}19.3 | |||
|- | |- | ||
| style="text-align:right" |SBP | | style="text-align:right" |SBP reserves | ||
|8.6 | |8.6 | ||
|9.1 | |9.1 | ||
| Line 1,162: | Line 1,235: | ||
|9.9 | |9.9 | ||
|4.5 | |4.5 | ||
|9.4 | |||
|14.5 | |||
|- | |- | ||
| style="text-align:right" |Banks | | style="text-align:right" |Banks reserves | ||
|2.8 | |2.8 | ||
|3.3 | |3.3 | ||
| Line 1,180: | Line 1,255: | ||
|5.6 | |5.6 | ||
|4.7 | |4.7 | ||
|4.6 | |||
|4.8 | |||
|} | |} | ||
== Structure of economy == | == Structure of economy == | ||
{{See also|Economic liberalisation in Pakistan}} | {{See also|Economic liberalisation in Pakistan}} | ||
Agriculture accounted for about 53% of the GDP in 1947. While per-capita agricultural output has grown since then, it has been outpaced by the growth of the non-agricultural sectors, and the share of agriculture has dropped to roughly one-fifth of Pakistan's economy. In recent years, the country has seen rapid growth in industries | |||
Agriculture accounted for about 53% of the GDP in 1947. While per-capita agricultural output has grown since then, it has been outpaced by the growth of the non-agricultural sectors, and the share of agriculture has dropped to roughly one-fifth of Pakistan's economy. In recent years, the country has seen rapid growth in industries, such as apparel, textiles, and cement, and services, such as telecommunications, transportation, advertising, and finance. | |||
{| class="wikitable" | {| class="wikitable" | ||
|+Sectoral | |+Sectoral shares % in GDP (at constant basic prices)<ref name="SS">{{cite web |title=Sectoral Shares in GDP (at constant basic prices) |url=https://www.pbs.gov.pk/wp-content/uploads/2020/07/Table_7a-3.pdf |access-date=2025-12-19 |website=PBS}}</ref> | ||
!Sectors | !Sectors | ||
!FY 2000 | !FY 2000 | ||
| Line 1,193: | Line 1,272: | ||
!FY 2015 | !FY 2015 | ||
!FY 2020 | !FY 2020 | ||
!FY | !FY 2025 | ||
|- | |- | ||
|Agricultural | |Agricultural | ||
| Line 1,201: | Line 1,280: | ||
|{{decrease}} 24.83 | |{{decrease}} 24.83 | ||
|{{decrease}} 23.53 | |{{decrease}} 23.53 | ||
|{{ | |{{increase}} 23.54 | ||
|- | |- | ||
|Industrial | |Industrial | ||
| Line 1,209: | Line 1,288: | ||
|{{increase}} 19.11 | |{{increase}} 19.11 | ||
|{{decrease}} 18.53 | |{{decrease}} 18.53 | ||
|{{decrease}} 18. | |{{decrease}} 18.07 | ||
|- | |- | ||
|Services | |Services | ||
| Line 1,217: | Line 1,296: | ||
|{{increase}} 56.06 | |{{increase}} 56.06 | ||
|{{increase}} 57.94 | |{{increase}} 57.94 | ||
|{{increase}} 58. | |{{increase}} 58.39 | ||
|} | |} | ||
== Major sectors == | == Major sectors == | ||
=== Agriculture === | === Agriculture === | ||
{{Main|Agriculture in Pakistan}} | {{Main|Agriculture in Pakistan}} | ||
{{see also|Rice production in Pakistan}} | |||
[[File:Yellow and green fields in Punjab Pakistan after raining showing rainbow.jpg|thumb|Yellow and green fields in [[Punjab, Pakistan|Punjab]]]] | |||
The majority of the population, directly or indirectly, is dependent on this sector, contributing about 23.0% of the gross domestic product (GDP) and accounting for 37.4% of the employed labor force in 2021. It is the largest source of foreign exchange earnings.<ref>{{cite web|title=Agriculture|url=http://www.sbp.org.pk/reports/stat_reviews/Bulletin/2020/Feb/NationalAccounts.pdf|access-date=22 February 2020|website=SBP}}</ref> The most important crops are wheat, [[sugarcane]], cotton, and rice, accounting for more than 75% of the value of total crop output. Pakistan's largest food crop is wheat. In 2017, Pakistan produced 26,674,000 tonnes of wheat, almost equal to all of Africa (27.1 million tonnes) and more than all of South America (25.9 million tonnes), according to the [[FAOSTAT]].<ref>{{cite web|url=http://www.fao.org/faostat/en/#data/QC|title=wheat production|website=fao.org|access-date=20 April 2019}}</ref> In the market year of 2018/19, Pakistan exported a record 4.5 million tonnes of rice.<ref>{{cite web|url=https://apps.fas.usda.gov/newgainapi/api/Report/DownloadReportByFileName?fileName=Grain%20and%20Feed%20Update_Islamabad_Pakistan_12-30-2019|title=Pakistan Grain and Feed Update|website=gain.fas.usda.gov|access-date=22 February 2020}}</ref> | |||
Pakistan is a net food exporter, except in occasional years when its harvest is adversely affected by droughts. Pakistan exports rice, cotton, fish, fruits (especially Oranges and Mangoes), and vegetables and imports vegetable oil, wheat, pulses, and consumer foods.<ref>{{cite web|title=Pakistan Business Facts|url=https://bizpages.org/countries--PK--Pakistan|url-status=live|archive-url=https://web.archive.org/web/20200420195826/https://bizpages.org/countries--PK--Pakistan |archive-date=20 April 2020 }}</ref> The economic importance of agriculture has declined since independence when its share of GDP was around 53%. | |||
{| class="wikitable" | {| class="wikitable" | ||
|+% growth <ref name=" | |+% growth<ref name="SI">{{cite web |title=Social Indicators |url=https://www.finance.gov.pk/survey/chapter_25/social_indicators.pdf |access-date=2025-12-19 |website=Finance Division}}</ref><ref name="GR">{{cite web |title=Real Growth Rates of GDP at constant basic prices |url=https://www.pbs.gov.pk/wp-content/uploads/2020/07/Table_6-5.pdf |access-date=2025-12-19 |website=Pakistan Bureau of Statistics}}</ref> | ||
|- | |- | ||
! List | ! List | ||
| Line 1,244: | Line 1,330: | ||
! FY 2021 | ! FY 2021 | ||
! FY 2022 | ! FY 2022 | ||
!FY 2023 | |||
!FY 2024 | |||
!FY 2025 | |||
|- | |- | ||
|Agriculture sector | |Agriculture sector | ||
| style="text-align:center" |{{increase}} | | style="text-align:center" |{{increase}} 0.81 | ||
| style="text-align:center" |{{increase}} | | style="text-align:center" |{{increase}} 3.41 | ||
| style="text-align:center" |{{increase}} 0.31 | | style="text-align:center" |{{increase}} 0.31 | ||
| style="text-align:center" |{{increase}} 2.71 | | style="text-align:center" |{{increase}} 2.71 | ||
| style="text-align:center" |{{increase}} | | style="text-align:center" |{{increase}} 3.23 | ||
| style="text-align:center" |{{increase}} | | style="text-align:center" |{{increase}} 3.14 | ||
| style="text-align:center" |{{increase}} | | style="text-align:center" |{{increase}} 2.42 | ||
| style="text-align:center" |{{increase}} | | style="text-align:center" |{{increase}} 1.78 | ||
| style="text-align:center" |{{increase}} | | style="text-align:center" |{{increase}} 0.41 | ||
| style="text-align:center" |{{increase}} | | style="text-align:center" |{{increase}} 2.22 | ||
| style="text-align:center" |{{increase}} | | style="text-align:center" |{{increase}} 3.88 | ||
| style="text-align:center" |{{increase}} | | style="text-align:center" |{{increase}} 0.94 | ||
| style="text-align:center" |{{increase}} | | style="text-align:center" |{{increase}} 3.91 | ||
| style="text-align:center" |{{increase}} | | style="text-align:center" |{{increase}} 3.52 | ||
| style="text-align:center" |{{increase}} | | style="text-align:center" |{{increase}} 4.21 | ||
| style="text-align:center" |{{increase}} 2.24 | |||
| style="text-align:center" |{{increase}} 6.40 | |||
|{{increase}}0.56 | |||
|- | |- | ||
! colspan=" | ! colspan="18" |Production of important crops (million tonnes) | ||
! | ! | ||
|- | |- | ||
|[[Wheat]] | |[[Wheat]] | ||
| style="text-align:center" |{{decrease}} | | style="text-align:center" |{{decrease}} 20.9 | ||
| style="text-align:center" |{{increase}} | | style="text-align:center" |{{increase}} 24.0 | ||
| style="text-align:center" |{{decrease}} | | style="text-align:center" |{{decrease}} 23.3 | ||
| style="text-align:center" |{{increase}} 25.2 | | style="text-align:center" |{{increase}} 25.2 | ||
| style="text-align:center" |{{decrease}} | | style="text-align:center" |{{decrease}} 23.5 | ||
| style="text-align:center" |{{increase}} | | style="text-align:center" |{{increase}} 24.2 | ||
| style="text-align:center" |{{increase}} | | style="text-align:center" |{{increase}} 26.0 | ||
| style="text-align:center" |{{decrease}} | | style="text-align:center" |{{decrease}} 25.1 | ||
| style="text-align:center" |{{increase}} | | style="text-align:center" |{{increase}} 25.6 | ||
| style="text-align:center" |{{increase}} | | style="text-align:center" |{{increase}} 26.7 | ||
| style="text-align:center" |{{decrease}} | | style="text-align:center" |{{decrease}} 25.1 | ||
| style="text-align:center" |{{decrease}} | | style="text-align:center" |{{decrease}} 24.3 | ||
| style="text-align:center" |{{increase}} | | style="text-align:center" |{{increase}} 25.2 | ||
| style="text-align:center" |{{increase}} | | style="text-align:center" |{{increase}} 27.5 | ||
| style="text-align:center" |{{decrease}} | | style="text-align:center" |{{decrease}} 26.2 | ||
| style="text-align:center" |{{increase}} 28.2 | |||
| style="text-align:center" |{{increase}} 31.8 | |||
|{{decrease}}28.4 | |||
|- | |- | ||
|[[Rice]] | |[[Rice]] | ||
| style="text-align:center" |{{increase}} | | style="text-align:center" |{{increase}} 5.6 | ||
| style="text-align:center" |{{increase}} | | style="text-align:center" |{{increase}} 6.9 | ||
| style="text-align:center" |{{steady}} | | style="text-align:center" |{{steady}} 6.9 | ||
| style="text-align:center" |{{decrease}} | | style="text-align:center" |{{decrease}} 4.8 | ||
| style="text-align:center" |{{increase}} | | style="text-align:center" |{{increase}} 6.2 | ||
| style="text-align:center" |{{decrease}} | | style="text-align:center" |{{decrease}} 5.6 | ||
| style="text-align:center" |{{increase}} | | style="text-align:center" |{{increase}} 6.8 | ||
| style="text-align:center" |{{increase}} | | style="text-align:center" |{{increase}} 7.0 | ||
| style="text-align:center" |{{decrease}} | | style="text-align:center" |{{decrease}} 6.8 | ||
| style="text-align:center" |{{steady}} | | style="text-align:center" |{{steady}} 6.8 | ||
| style="text-align:center" |{{increase}} | | style="text-align:center" |{{increase}} 7.5 | ||
| style="text-align:center" |{{decrease}} | | style="text-align:center" |{{decrease}} 7.2 | ||
| style="text-align:center" |{{increase}} | | style="text-align:center" |{{increase}} 7.4 | ||
| style="text-align:center" |{{increase}} | | style="text-align:center" |{{increase}} 8.4 | ||
| style="text-align:center" |{{increase}} | | style="text-align:center" |{{increase}} 9.3 | ||
| style="text-align:center" |{{decrease}} 7.3 | |||
| style="text-align:center" |{{increase}} 9.9 | |||
|{{decrease}} 9.7 | |||
|- | |- | ||
|[[Sugarcane]] | |[[Sugarcane]] | ||
| style="text-align:center" |{{increase}} | | style="text-align:center" |{{increase}} 63.9 | ||
| style="text-align:center" |{{decrease}} | | style="text-align:center" |{{decrease}} 50.0 | ||
| style="text-align:center" |{{decrease}} 49.4 | | style="text-align:center" |{{decrease}} 49.4 | ||
| style="text-align:center" |{{increase}} 55.3 | | style="text-align:center" |{{increase}} 55.3 | ||
| style="text-align:center" |{{increase}} | | style="text-align:center" |{{increase}} 58.4 | ||
| style="text-align:center" |{{increase}} | | style="text-align:center" |{{increase}} 63.8 | ||
| style="text-align:center" |{{increase}} | | style="text-align:center" |{{increase}} 67.5 | ||
| style="text-align:center" |{{decrease}} | | style="text-align:center" |{{decrease}} 62.8 | ||
| style="text-align:center" |{{increase}} | | style="text-align:center" |{{increase}} 65.5 | ||
| style="text-align:center" |{{increase}} | | style="text-align:center" |{{increase}} 75.5 | ||
| style="text-align:center" |{{increase}} | | style="text-align:center" |{{increase}} 83.3 | ||
| style="text-align:center" |{{decrease}} | | style="text-align:center" |{{decrease}} 67.2 | ||
| style="text-align:center" |{{decrease}} | | style="text-align:center" |{{decrease}} 66.4 | ||
| style="text-align:center" |{{increase}} | | style="text-align:center" |{{increase}} 81.0 | ||
| style="text-align:center" |{{increase}} | | style="text-align:center" |{{increase}} 88.7 | ||
| style="text-align:center" |{{increase}} 88.0 | |||
| style="text-align:center" |{{decrease}} 87.6 | |||
|{{decrease}}84.2 | |||
|- | |- | ||
|[[Cotton]] * | |[[Cotton]] * | ||
| style="text-align:center" |{{decrease}} | | style="text-align:center" |{{decrease}} 11.7 | ||
| style="text-align:center" |{{increase}} | | style="text-align:center" |{{increase}} 11.8 | ||
| style="text-align:center" |{{increase}} | | style="text-align:center" |{{increase}} 12.9 | ||
| style="text-align:center" |{{decrease}} | | style="text-align:center" |{{decrease}} 11.5 | ||
| style="text-align:center" |{{increase}} | | style="text-align:center" |{{increase}} 13.6 | ||
| style="text-align:center" |{{decrease}} | | style="text-align:center" |{{decrease}} 13.0 | ||
| style="text-align:center" |{{decrease}} | | style="text-align:center" |{{decrease}} 12.8 | ||
| style="text-align:center" |{{increase}} | | style="text-align:center" |{{increase}} 14.0 | ||
| style="text-align:center" |{{decrease}} | | style="text-align:center" |{{decrease}} 9.9 | ||
| style="text-align:center" |{{increase}} | | style="text-align:center" |{{increase}} 10.7 | ||
| style="text-align:center" |{{increase}} | | style="text-align:center" |{{increase}} 11.9 | ||
| style="text-align:center" |{{decrease}} | | style="text-align:center" |{{decrease}} 9.9 | ||
| style="text-align:center" |{{decrease}} | | style="text-align:center" |{{decrease}} 9.1 | ||
| style="text-align:center" |{{decrease}} | | style="text-align:center" |{{decrease}} 7.1 | ||
| style="text-align:center" |{{increase}} | | style="text-align:center" |{{increase}} 8.3 | ||
| style="text-align:center" |{{decrease}} 4.9 | |||
| style="text-align:center" |{{increase}} 10.2 | |||
|{{decrease}} 7.1 | |||
|- | |- | ||
|[[Maize]] | |[[Maize|Maize / corn]] | ||
| style="text-align:center" |{{increase}} 3.6 | | style="text-align:center" |{{increase}} 3.6 | ||
| style="text-align:center" |{{steady}} | | style="text-align:center" |{{steady}} 3.6 | ||
| style="text-align:center" |{{decrease}} 3.3 | | style="text-align:center" |{{decrease}} 3.3 | ||
| style="text-align:center" |{{increase}} 3.7 | | style="text-align:center" |{{increase}} 3.7 | ||
| Line 1,349: | Line 1,453: | ||
| style="text-align:center" |{{increase}} 8.9 | | style="text-align:center" |{{increase}} 8.9 | ||
| style="text-align:center" |{{increase}} 9.5 | | style="text-align:center" |{{increase}} 9.5 | ||
| style="text-align:center" |{{increase}} 11.0 | |||
| style="text-align:center" |{{decrease}} 9.7 | |||
|{{decrease}} 9.0 | |||
|} | |} | ||
<nowiki>*</nowiki> | <nowiki>*</nowiki> Cotton production in million bales. | ||
Pakistan's principal natural resources are [[arable land]] and water. About 25% of Pakistan's total land area is under cultivation and is watered by one of the largest irrigation systems in the world. Pakistan irrigates three times more acres than Russia. Pakistan agriculture also benefits from year-round warmth. [[Zarai Taraqiati Bank Limited]] is the largest financial institution geared towards the development of the agriculture sector through the provision of financial services and technical expertise. | |||
===== Fishing ===== | |||
{{Main|Fishing industry in Pakistan}} | |||
===== Forestry ===== | |||
{{Main|Forestry in Pakistan}} | |||
===== Livestock ===== | |||
{{Main|Animal husbandry in Pakistan}} | |||
=== Industry === | === Industry === | ||
{{Main|Industry of Pakistan}} | {{Main|Industry of Pakistan}} | ||
Pakistan's [[Industry (manufacturing)|industrial]] sector accounts for approximately 19.12% of GDP.<ref name=" | [[File:Sunset in Pakistan DSC 1588E.jpg|thumb|[[Factory]] in Pakistan]] | ||
Pakistan's [[Industry (manufacturing)|industrial]] sector accounts for approximately 19.12% of GDP.<ref name="SS"/> In 2021, it recorded a growth of 7.81%, compared to the negative 5.75% in 2020.<ref name="GR"/> The government is privatizing large-scale industrial units, and the public sector accounts for a shrinking proportion of industrial output, while growth in overall industrial output (including the private sector) has accelerated. Government policies aim to diversify the country's industrial base and bolster export industries. Large Scale Manufacturing is the fastest-growing sector in the Pakistani economy.<ref>{{cite web |date=4 June 2014 |title=Manufacturing sector grows by 5.2 percent |url=http://www.app.com.pk/en_/index.php?option=com_content&task=view&id=78582&Itemid=173 |url-status=dead |archive-url=https://web.archive.org/web/20140808121112/http://www.app.com.pk/en_/index.php?option=com_content&task=view&id=78582&Itemid=173 |archive-date=8 August 2014 |website=Associated Press Of Pakistan}}</ref> Major industries include [[textiles]], [[fertiliser]], cement, [[oil refineries]], [[dairy products]], food processing, [[beverages]], [[construction materials]], [[clothing]], paper products, and [[shrimp]]. | |||
In Pakistan [[Small and medium enterprises|SMEs]] have a significant contribution | In Pakistan, [[Small and medium enterprises|SMEs]] have a significant contribution to the total GDP of Pakistan. According to [[SMEDA]] and Economic survey reports, the share in the annual GDP is 40%, with SMEs generating significant employment opportunities for skilled workers and entrepreneurs. Small and medium-scale firms represent nearly 90% of all enterprises in Pakistan and employ 80% of the non-agricultural labor force. These figures indicate the potential and further growth in this sector. | ||
{| class="wikitable" | {| class="wikitable" | ||
|+'''% growth<ref name=" | |+'''% growth<ref name="GR"/>''' | ||
! List | ! List | ||
! FY 2008 | ! FY 2008 | ||
| Line 1,382: | Line 1,498: | ||
! FY 2021 | ! FY 2021 | ||
!FY 2022 | !FY 2022 | ||
!FY 2023 | |||
!FY 2024 | |||
!FY 2025 | |||
|- | |- | ||
| style="text-align:left" | Industrial sector | | style="text-align:left" | Industrial sector | ||
| style="text-align:center" |{{increase}} | | style="text-align:center" |{{increase}} 8.78 | ||
| style="text-align:center" |{{decrease}} -4.15 | | style="text-align:center" |{{decrease}} -4.15 | ||
| style="text-align:center" |{{increase}} | | style="text-align:center" |{{increase}} 3.95 | ||
| style="text-align:center" |{{increase}} | | style="text-align:center" |{{increase}} 4.87 | ||
| style="text-align:center" |{{increase}} | | style="text-align:center" |{{increase}} 2.33 | ||
| style="text-align:center" |{{increase}} | | style="text-align:center" |{{increase}} 1.16 | ||
| style="text-align:center" |{{increase}} | | style="text-align:center" |{{increase}} 4.34 | ||
| style="text-align:center" |{{increase}} | | style="text-align:center" |{{increase}} 5.40 | ||
| style="text-align:center" |{{increase}} | | style="text-align:center" |{{increase}} 6.01 | ||
| style="text-align:center" |{{increase}} | | style="text-align:center" |{{increase}} 4.61 | ||
| style="text-align:center" |{{increase}} | | style="text-align:center" |{{increase}} 9.18 | ||
| style="text-align:center" |{{increase}} | | style="text-align:center" |{{increase}} 0.25 | ||
| style="text-align:center" |{{decrease}} -5.75 | | style="text-align:center" |{{decrease}} -5.75 | ||
| style="text-align:center" |{{increase}} | | style="text-align:center" |{{increase}} 8.20 | ||
| style="text-align:center" |{{increase}} | | style="text-align:center" |{{increase}} 7.01 | ||
| style="text-align:center" |{{decrease}}-3.88 | |||
| style="text-align:center" |{{increase}}-1.37 | |||
|4.77 | |||
|- | |- | ||
| style="text-align:right" |[[Manufacturing]] | | style="text-align:right" |[[Manufacturing]] | ||
| style="text-align:center" |{{increase}} | | style="text-align:center" |{{increase}} 6.14 | ||
| style="text-align:center" |{{decrease}} | | style="text-align:center" |{{decrease}} -3.94 | ||
| style="text-align:center" |{{increase}} | | style="text-align:center" |{{increase}} 1.73 | ||
| style="text-align:center" |{{increase}} | | style="text-align:center" |{{increase}} 2.61 | ||
| style="text-align:center" |{{increase}} | | style="text-align:center" |{{increase}} 2.01 | ||
| style="text-align:center" |{{increase}} | | style="text-align:center" |{{increase}} 5.37 | ||
| style="text-align:center" |{{increase}} | | style="text-align:center" |{{increase}} 5.76 | ||
| style="text-align:center" |{{increase}} | | style="text-align:center" |{{increase}} 4.12 | ||
| style="text-align:center" |{{increase}} | | style="text-align:center" |{{increase}} 4.03 | ||
| style="text-align:center" |{{increase}} | | style="text-align:center" |{{increase}} 4.87 | ||
| style="text-align:center" |{{increase}} | | style="text-align:center" |{{increase}} 7.08 | ||
| style="text-align:center" |{{increase}} 4.52 | | style="text-align:center" |{{increase}} 4.52 | ||
| style="text-align:center" |{{decrease}} -7.80 | | style="text-align:center" |{{decrease}} -7.80 | ||
| style="text-align:center" |{{increase}} | | style="text-align:center" |{{increase}} 10.52 | ||
| style="text-align:center" |{{increase}} 10.86 | | style="text-align:center" |{{increase}} 10.86 | ||
| style="text-align:center" |{{decrease}}-5.26 | |||
| style="text-align:center" |{{increase}}3.03 | |||
|1.34 | |||
|- | |- | ||
| style="text-align:right" | Mining | | style="text-align:right" | Mining | ||
| style="text-align:center" |{{increase}} | | style="text-align:center" |{{increase}} 3.70 | ||
| style="text-align:center" |{{decrease}} -1.04 | | style="text-align:center" |{{decrease}} -1.04 | ||
| style="text-align:center" |{{increase}} | | style="text-align:center" |{{increase}} 2.42 | ||
| style="text-align:center" |{{decrease}} -4.04 | | style="text-align:center" |{{decrease}} -4.04 | ||
| style="text-align:center" |{{increase}} | | style="text-align:center" |{{increase}} 5.26 | ||
| style="text-align:center" |{{increase}} | | style="text-align:center" |{{increase}} 1.77 | ||
| style="text-align:center" |{{increase}} | | style="text-align:center" |{{increase}} 1.02 | ||
| style="text-align:center" |{{increase}} | | style="text-align:center" |{{increase}} 3.95 | ||
| style="text-align:center" |{{increase}} | | style="text-align:center" |{{increase}} 5.64 | ||
| style="text-align:center" |{{decrease}} -0.89 | | style="text-align:center" |{{decrease}} -0.89 | ||
| style="text-align:center" |{{increase}} | | style="text-align:center" |{{increase}} 7.26 | ||
| style="text-align:center" |{{increase}} | | style="text-align:center" |{{increase}} 0.54 | ||
| style="text-align:center" |{{decrease}} -7.17 | | style="text-align:center" |{{decrease}} -7.17 | ||
| style="text-align:center" |{{increase}} | | style="text-align:center" |{{increase}} 1.72 | ||
| style="text-align:center" |{{decrease}} - | | style="text-align:center" |{{decrease}} -6.66 | ||
| style="text-align:center" |{{decrease}}-3.23 | |||
| style="text-align:center" |{{increase}}-4.02 | |||
| -3.38 | |||
|- | |- | ||
| style="text-align:right" |Construction | | style="text-align:right" |Construction | ||
| Line 1,449: | Line 1,577: | ||
| style="text-align:center" |{{decrease}}-3.08 | | style="text-align:center" |{{decrease}}-3.08 | ||
| style="text-align:center" |{{increase}} 2.39 | | style="text-align:center" |{{increase}} 2.39 | ||
| style="text-align:center" |{{increase}} 1. | | style="text-align:center" |{{increase}} 1.83 | ||
| style="text-align:center" |{{decrease}}-10.25 | |||
| style="text-align:center" |{{increase}}-1.14 | |||
|6.61 | |||
|} | |} | ||
==== Manufacturing ==== | ==== Manufacturing ==== | ||
Manufacturing is the largest of Pakistan's industrial sectors, accounting for approximately 12.13% of GDP.<ref>{{cite web|url=https://data.worldbank.org/indicator/NV.IND.MANF.ZS?locations=PK|title=Manufacturing, value added (% of GDP)|website=The World Bank}}</ref> The manufacturing sub-sector is further divided into three components: large-scale manufacturing (LSM) with a share of 79.6% in the manufacturing sector, small-scale manufacturing with a share of 13.8% in the manufacturing sector, while slaughtering contributes 6.5% to manufacturing.<ref>{{Cite book |url=http://www.finance.gov.pk/survey_1718.html |title=Pakistan Economic Survey 2017–18 |chapter-url=http://www.finance.gov.pk/survey/chapters_18/03-Manufacturing.pdf |chapter=Chapter 3: Manufacturing and Mining |publisher=Ministry of Finance |access-date=25 May 2019}}</ref> Major sectors in industries include [[cement]], [[fertiliser]], [[edible oil]], [[sugar]], [[steel]], [[tobacco]], [[chemicals]], [[machinery]], [[food processing]], and medical instruments, primarily surgical.<ref>{{cite report |title=The Sectoral Analysis of Surgical Instruments of Pakistan |author=M. Rizwan Manzoor |url=http://www.pitad.org.pk/Publications/27-Pakistan%20India%20Trade%20Liberalization%20Sectoral%20Study%20on%20Surgical%20Industry.pdf |publisher=PITAD |access-date=25 May 2019}}</ref><ref>{{cite report |url=http://rcci.org.pk/wp-content/uploads/2012/12/SurgicalIndustry.pdf |title=Pakistan Surgical Industry |author=Aaliya Ahmed |date=1 September 2010 |publisher=The Rawalpindi Chamber of Commerce & Industry |access-date=25 May 2019 |archive-date=8 March 2018 |archive-url=https://web.archive.org/web/20180308231400/http://rcci.org.pk/wp-content/uploads/2012/12/SurgicalIndustry.pdf |url-status=dead }}</ref><ref>{{cite report |title=Surgical & Medical Instruments Industry of Pakistan |url=http://www.tdap.gov.pk/doc_reports/TDAP_Report_on_Surgical_%26_Medical_Instuments_Industry_in_Pakistan.pdf |publisher=TDAP |access-date=25 May 2019 |archive-date=5 August 2020 |archive-url=https://web.archive.org/web/20200805073738/https://www.tdap.gov.pk/doc_reports/TDAP_Report_on_Surgical_%26_Medical_Instuments_Industry_in_Pakistan.pdf |url-status=dead }}</ref> Pakistan is one of the largest manufacturers and exporters of [[surgical instruments]].<ref>{{cite web |url=https://www.tradeford.com/forum/world-s-leading-surgical-instruments-producers_f255.html |title=World's Leading Surgical Instruments Producers |author=Chin |date=24 May 2012 |website=TradeFord}}</ref><ref>{{cite web |url=https://www.dawn.com/news/1279191 |title=Pakistan's shadow surgical instruments' sector |first=Mubarak Zeb|last=Khan|date=22 August 2016 |work=Dawn News |access-date=25 May 2019}}</ref> | |||
{| class="wikitable" | {| class="wikitable" | ||
|+Production of | |+Production of selected manufactured goods<ref>{{Cite web |title=PBS statistics |url=https://www.pbs.gov.pk/content/qim |access-date=2024-09-17 |website=pbs.gov.pk}}</ref> | ||
!Manufactured | !Manufactured goods | ||
!Unit of quantity | !Unit of quantity | ||
!2016 | !2016 | ||
| Line 1,465: | Line 1,597: | ||
!2021 | !2021 | ||
!2022 | !2022 | ||
!2023 | |||
!2024 | |||
|- | |- | ||
!Cotton | !Cotton yarn | ||
| rowspan="10" |Metric | | rowspan="10" |Metric tonne (000) | ||
|3,406 | |3,406 | ||
|3,428 | |{{increase}}3,428 | ||
|3,430 | |{{increase}}3,430 | ||
|3,431 | |{{increase}}3,431 | ||
|3,060 | |{{decrease}}3,060 | ||
|3,442 | |{{increase}}3,442 | ||
|3,459 | |{{increase}}3,459 | ||
|{{decrease}}2,695 | |||
|{{decrease}}2,477 | |||
|- | |- | ||
!Jute | !Jute goods | ||
|55 | |55 | ||
|60 | |{{increase}}60 | ||
|74 | |{{increase}}74 | ||
|67 | |{{decrease}}67 | ||
|65 | |{{decrease}}65 | ||
|70 | |{{increase}}70 | ||
|58 | |{{decrease}}58 | ||
|{{increase}}63 | |||
|{{decrease}}41 | |||
|- | |- | ||
!Cooking oil | |||
!Cooking | |||
|380 | |380 | ||
|390 | |{{increase}}390 | ||
|391 | |{{increase}}391 | ||
|406 | |{{increase}}406 | ||
|442 | |{{increase}}442 | ||
|460 | |{{increase}}460 | ||
|510 | |{{increase}}510 | ||
|{{increase}}567 | |||
|{{increase}}642 | |||
|- | |- | ||
!Sugar | !Sugar | ||
|5,115 | |5,115 | ||
|7,049 | |{{increase}}7,049 | ||
|6,566 | |{{decrease}}6,566 | ||
|5,260 | |{{decrease}}5,260 | ||
|4,881 | |{{decrease}}4,881 | ||
|5,694 | |{{increase}}5,694 | ||
|7,921 | |{{increase}}7,921 | ||
|{{decrease}}6,709 | |||
|{{increase}}6,796 | |||
|- | |- | ||
!Cement | !Cement | ||
|35,432 | |35,432 | ||
|37,022 | |{{increase}}37,022 | ||
|41,148 | |{{increase}}41,148 | ||
|39,924 | |{{decrease}}39,924 | ||
|39,121 | |{{decrease}}39,121 | ||
|49,797 | |{{increase}}49,797 | ||
|48,011 | |{{decrease}}48,011 | ||
|{{decrease}}41,448 | |||
|{{decrease}}39,566 | |||
|- | |- | ||
!Paper & | !Paper & board | ||
|610 | |610 | ||
|669 | |{{increase}}669 | ||
|731 | |{{increase}}731 | ||
|704 | |{{decrease}}704 | ||
|707 | |{{increase}}707 | ||
|730 | |{{increase}}730 | ||
|825 | |{{increase}}825 | ||
|{{decrease}}792 | |||
|{{decrease}}787 | |||
|- | |- | ||
!Caustic | !Caustic soda | ||
|225 | |225 | ||
|224 | |{{decrease}}224 | ||
|270 | |{{increase}}270 | ||
|247 | |{{decrease}}247 | ||
|342 | |{{increase}}342 | ||
|394 | |{{increase}}394 | ||
|405 | |{{increase}}405 | ||
|{{increase}}476 | |||
|{{increase}}497 | |||
|- | |- | ||
!Hydrogen | !Hydrogen chloride | ||
|172 | |172 | ||
|177 | |{{increase}}177 | ||
|251 | |{{increase}}251 | ||
|425 | |{{increase}}425 | ||
|361 | |{{decrease}}361 | ||
|417 | |{{increase}}417 | ||
|510 | |{{increase}}510 | ||
|{{increase}}525 | |||
|{{decrease}}507 | |||
|- | |- | ||
!Sulphuric | !Sulphuric acid | ||
|75 | |75 | ||
|56 | |{{decrease}}56 | ||
|49 | |{{decrease}}49 | ||
|49 | |{{steady}}49 | ||
|40 | |{{decrease}}40 | ||
|72 | |{{increase}}72 | ||
|111 | |{{increase}}111 | ||
|{{decrease}}71 | |||
|{{decrease}}64 | |||
|- | |- | ||
!Cotton | !Vegetable ghee | ||
|Million | |1,241 | ||
|{{increase}}1,280 | |||
|{{increase}}1,347 | |||
|{{increase}}1,392 | |||
|{{increase}}1,454 | |||
|{{increase}}1,455 | |||
|{{decrease}}1,393 | |||
|{{increase}}1,554 | |||
|{{decrease}}1,493 | |||
|- | |||
!Cotton cloth | |||
|Million meters | |||
|1,039 | |1,039 | ||
|1,043 | |{{increase}}1,043 | ||
|1,044 | |{{increase}}1,044 | ||
|1,046 | |{{increase}}1,046 | ||
|935 | |{{decrease}}935 | ||
|1,048 | |{{increase}}1,048 | ||
|1,051 | |{{increase}}1,051 | ||
|{{decrease}}921 | |||
|{{decrease}}871 | |||
|- | |- | ||
!Cigarettes | !Cigarettes | ||
|Billion | |Billion | ||
|54 | |54 | ||
|34 | |{{decrease}}34 | ||
|59 | |{{increase}}59 | ||
|61 | |{{increase}}61 | ||
|46 | |{{decrease}}46 | ||
|52 | |{{increase}}52 | ||
|60 | |{{increase}}60 | ||
|{{decrease}}43 | |||
|{{decrease}}33 | |||
|- | |- | ||
!Nitrogenous | !Nitrogenous fertilizers | ||
| rowspan="2" |NT (000) | | rowspan="2" |NT (000) | ||
|3,018 | |3,018 | ||
|3,063 | |{{increase}}3,063 | ||
|2,758 | |{{decrease}}2,758 | ||
|2,990 | |{{increase}}2,990 | ||
|3,139 | |{{increase}}3,139 | ||
|3,324 | |{{increase}}3,324 | ||
|3,391 | |{{increase}}3,391 | ||
|{{decrease}}3,163 | |||
|{{increase}}3,483 | |||
|- | |- | ||
!Phosphatic | !Phosphatic fertilizers | ||
|664 | |664 | ||
|683 | |{{increase}}683 | ||
|619 | |{{decrease}}619 | ||
|633 | |{{increase}}633 | ||
|631 | |{{decrease}}631 | ||
|748 | |{{increase}}748 | ||
|804 | |{{increase}}804 | ||
|{{decrease}}616 | |||
|{{increase}}756 | |||
|- | |- | ||
!Cycle | !Cycle tyres & tubes | ||
| rowspan="9" |Numbers (000) | | rowspan="9" |Numbers (000) | ||
|11,490 | |11,490 | ||
|11,507 | |{{increase}}11,507 | ||
|11,470 | |{{decrease}}11,470 | ||
|14,491 | |{{increase}}14,491 | ||
|13,496 | |{{decrease}}13,496 | ||
|10,314 | |{{decrease}}10,314 | ||
|10,876 | |{{increase}}10,876 | ||
|{{decrease}}10,702 | |||
|{{increase}}10,943 | |||
|- | |- | ||
!Motor | !Motor tyres & tubes | ||
|34,202 | |34,202 | ||
|34,345 | |{{increase}}34,345 | ||
|35,057 | |{{increase}}35,057 | ||
|36,321 | |{{increase}}36,321 | ||
|35,678 | |{{decrease}}35,678 | ||
|31,906 | |{{decrease}}31,906 | ||
|30,296 | |{{decrease}}30,296 | ||
|{{increase}}30,515 | |||
|{{increase}}31,107 | |||
|- | |- | ||
! | !Motorcycles | ||
|2,071 | |2,071 | ||
|2,501 | |{{increase}}2,501 | ||
|2,825 | |{{increase}}2,825 | ||
|2,460 | |{{decrease}}2,460 | ||
|1,813 | |{{decrease}}1,813 | ||
|2,476 | |{{increase}}2,476 | ||
|2,190 | |{{decrease}}2,190 | ||
|{{decrease}}1,289 | |||
|{{decrease}}1,235 | |||
|- | |- | ||
! | !Bicycles | ||
|199 | |199 | ||
|200 | |{{increase}}200 | ||
|200 | |{{steady}}200 | ||
|174 | |{{decrease}}174 | ||
|141 | |{{decrease}}141 | ||
|79 | |{{decrease}}79 | ||
|141 | |{{increase}}141 | ||
|{{increase}}146 | |||
|{{increase}}159 | |||
|- | |- | ||
!Electric | !Electric transformers | ||
|33 | |33 | ||
|37 | |{{increase}}37 | ||
|47 | |{{increase}}47 | ||
|31 | |{{decrease}}31 | ||
|23 | |{{decrease}}23 | ||
|29 | |{{increase}}29 | ||
|35 | |{{increase}}35 | ||
|{{decrease}}32 | |||
|{{decrease}}22 | |||
|- | |- | ||
!Refrigerators | !Refrigerators | ||
|1,477 | |1,477 | ||
|1,834 | |{{increase}}1,834 | ||
|1,348 | |{{decrease}}1,348 | ||
|1,084 | |{{decrease}}1,084 | ||
|716 | |{{decrease}}716 | ||
|1,351 | |{{increase}}1,351 | ||
|1,389 | |{{increase}}1,389 | ||
|{{decrease}}1,008 | |||
|{{decrease}}818 | |||
|- | |- | ||
!Air | !Air conditioners | ||
|388 | |388 | ||
|471 | |{{increase}}471 | ||
|451 | |{{decrease}}451 | ||
|518 | |{{increase}}518 | ||
|216 | |{{decrease}}216 | ||
|508 | |{{increase}}508 | ||
|540 | |{{increase}}540 | ||
|{{decrease}}347 | |||
|{{decrease}}224 | |||
|- | |- | ||
!Electric | !Electric fans | ||
|2,033 | |2,033 | ||
|2,523 | |{{increase}}2,523 | ||
|2,596 | |{{increase}}2,596 | ||
|2,591 | |{{decrease}}2,591 | ||
|2,124 | |{{decrease}}2,124 | ||
|2,499 | |{{increase}}2,499 | ||
|2,600 | |{{increase}}2,600 | ||
|{{decrease}}2,182 | |||
|{{increase}}2,283 | |||
|- | |- | ||
!Electric | !Electric meters | ||
|1,310 | |1,310 | ||
|1,923 | |{{increase}}1,923 | ||
|1,715 | |{{decrease}}1,715 | ||
|1,550 | |{{decrease}}1,550 | ||
|1,039 | |{{decrease}}1,039 | ||
|1,419 | |{{increase}}1,419 | ||
|2,030 | |{{increase}}2,030 | ||
|{{increase}}2,038 | |||
|{{increase}}2,117 | |||
|- | |||
!Motor spirits/petrol | |||
| rowspan="3" |Million liters | |||
|2,216 | |||
|{{increase}}2,518 | |||
|{{increase}}2,988 | |||
|{{increase}}3,085 | |||
|{{decrease}}2,684 | |||
|{{increase}}3,424 | |||
|{{decrease}}3,392 | |||
|{{decrease}}3,051 | |||
|{{increase}}3,294 | |||
|- | |||
!High speed diesel | |||
|5,236 | |||
|{{increase}}5,467 | |||
|{{increase}}6,283 | |||
|{{decrease}}5,665 | |||
|{{decrease}}4,529 | |||
|{{increase}}5,612 | |||
|{{increase}}5,615 | |||
|{{decrease}}4,655 | |||
|{{increase}}5,340 | |||
|- | |||
!Furnace oil | |||
|3,080 | |||
|{{increase}}3,215 | |||
|{{increase}}3,478 | |||
|{{decrease}}3,063 | |||
|{{decrease}}2,370 | |||
|{{increase}}2,717 | |||
|{{decrease}}2,567 | |||
|{{decrease}}2,191 | |||
|{{increase}}2,633 | |||
|- | |- | ||
!Jeeps & | !Jeeps & cars | ||
|Numbers | |Numbers | ||
|180,717 | |180,717 | ||
|193,996 | |{{increase}}193,996 | ||
|231,738 | |{{increase}}231,738 | ||
|218,845 | |{{decrease}}218,845 | ||
|106,764 | |{{decrease}}106,764 | ||
|182,389 | |{{increase}}182,389 | ||
|271,923 | |{{increase}}271,923 | ||
|{{decrease}}131,978 | |||
|{{decrease}}100,221 | |||
|- | |- | ||
!Tractors | !Tractors | ||
|Numbers | |Numbers | ||
|34,914 | |34,914 | ||
|53,975 | |{{increase}}53,975 | ||
|71,894 | |{{increase}}71,894 | ||
|49,902 | |{{decrease}}49,902 | ||
|32,608 | |{{decrease}}32,608 | ||
|50,700 | |{{increase}}50,700 | ||
|58,922 | |{{increase}}58,922 | ||
|{{decrease}}31,752 | |||
|{{increase}}46,275 | |||
|- | |- | ||
!Trucks & | !Trucks & buses | ||
|Numbers | |Numbers | ||
|8,331 | |8,331 | ||
|10,548 | |{{increase}}10,548 | ||
|13,425 | |{{increase}}13,425 | ||
|9,684 | |{{decrease}}9,684 | ||
|4,848 | |{{decrease}}4,848 | ||
|5,977 | |{{increase}}5,977 | ||
|7,934 | |{{increase}}7,934 | ||
|} | |{{decrease}}4,839 | ||
|{{decrease}}3,240 | |||
|} | |||
Their assets, sales and profit/loss for year | Pakistan's largest corporations are primarily engaged in utilities such as oil, gas, electricity, automobile, cement, food, chemicals, fertilizer, civil aviation, textile, and telecommunication. | ||
Their assets, sales, and profit/loss for the year 2023 are listed below:<ref>{{Cite web |title=Financial Statements Analysis of Companies (Non-Financial) Listed at Pakistan Stock Exchange 2023 |url=https://www.sbp.org.pk/reports/annual/FSANFC/2023/PDF/Complete.pdf |access-date=2024-09-14 |website=sbp.org.pk}}</ref> | |||
{| class="wikitable sortable" style="text-align:right;" | {| class="wikitable sortable" style="text-align:right;" | ||
|+Amounts are in | |+Amounts are in billion PKR. | ||
|- style="background:#EFEFEF;" | |- style="background:#EFEFEF;" | ||
! style="text-align:center;" | Name | ! style="text-align:center;" | Name | ||
!Total | !Total assets | ||
!Sales | !Sales | ||
! style="text-align:center;" | Profit / ( | ! style="text-align:center;" | Profit / (loss) after tax | ||
|- | |- | ||
| style="text-align:left;" | [[Oil and Gas Development Company|Oil and Gas Development Co. Ltd.]] | | style="text-align:left;" | [[Oil and Gas Development Company|Oil and Gas Development Co. Ltd.]] | ||
| style="text-align:center;" | | | style="text-align:center;" | 1,424 | ||
| style="text-align:center;" | | | style="text-align:center;" | 414 | ||
| style="text-align:center;" | | | style="text-align:center;" | 224.6 | ||
|- | |||
| style="text-align:left;" | [[Sui Northern Gas Pipelines Limited]] | |||
| style="text-align:center;" | 1,268 | |||
| style="text-align:center;" | 1,294 | |||
| style="text-align:center;" | 10.4 | |||
|- | |- | ||
| style="text-align:left;" | [[Pakistan State Oil|Pakistan State Oil Co. Ltd.]] | | style="text-align:left;" | [[Pakistan State Oil|Pakistan State Oil Co. Ltd.]] | ||
|style="text-align:center;" | | | style="text-align:center;" | 983 | ||
|style="text-align:center;" | | | style="text-align:center;" | 3,391 | ||
|style="text-align:center;" | | | style="text-align:center;" | 5.7 | ||
|- | |- | ||
| style="text-align:left;" | [[ | | style="text-align:left;" | [[K-Electric]] | ||
|style="text-align:center;" | | |style="text-align:center;" | 1,025 | ||
|style="text-align:center;" | | |style="text-align:center;" | 519 | ||
|style="text-align:center;" | | |style="text-align:center;" | (30.9) | ||
|- | |- | ||
| style="text-align:left;" | [[ | | style="text-align:left;" | [[Sui Southern Gas Company|Sui Southern Gas Co. Ltd]] | ||
|style="text-align:center;" | | | style="text-align:center;" | 798 | ||
|style="text-align:center;" | | | style="text-align:center;" | 376 | ||
|style="text-align:center;" | | | style="text-align:center;" | (11.4) | ||
|- | |- | ||
| style="text-align:left;" | [[Pakistan Petroleum|Pakistan Petroleum Ltd.]] | | style="text-align:left;" | [[Pakistan Petroleum|Pakistan Petroleum Ltd.]] | ||
| style="text-align:center;" | | | style="text-align:center;" | 790 | ||
| style="text-align:center;" | | | style="text-align:center;" | 286 | ||
| style="text-align:center;" | | | style="text-align:center;" | 97.9 | ||
|- | |- | ||
| style="text-align:left;" | [[ | | style="text-align:left;" | [[Lucky Cement|Lucky Cement Ltd.]] | ||
|style="text-align:center;" | | |style="text-align:center;" | 608 | ||
|style="text-align:center;" | | |style="text-align:center;" | 385 | ||
|style="text-align:center;" | | | style="text-align:center;" | 49.4 | ||
|- | |- | ||
| style="text-align:left;" | [[ | | style="text-align:left;" | [[Hub Power Company|The Hub Power Co. Ltd.]] | ||
|style="text-align:center;" | | | style="text-align:center;" | 406 | ||
|style="text-align:center;" | | | style="text-align:center;" | 114 | ||
| style="text-align:center;" | | | style="text-align:center;" | 62.0 | ||
|- | |- | ||
| style="text-align:left;" | [[ | | style="text-align:left;" | [[Attock Refinery Limited|Attock Refinery Ltd.]] | ||
| style="text-align:center;" | | | style="text-align:center;" | 193 | ||
| style="text-align:center;" | | | style="text-align:center;" | 369 | ||
| style="text-align:center;" | | | style="text-align:center;" | 28.0 | ||
|- | |- | ||
|style="text-align:left;" | [[ | | style="text-align:left;" |[[Fatima Fertilizer Company|Fatima Fertilizer Co. Ltd.]] | ||
|style="text-align:center;" | | | style="text-align:center;" |234 | ||
|style="text-align:center;" | | | style="text-align:center;" |235 | ||
|style="text-align:center;" | | | style="text-align:center;" |23.0 | ||
|- | |- | ||
| style="text-align:left;" | [[ | | style="text-align:left;" | [[Engro Fertilizers|Engro Fertilizers Ltd.]] | ||
| style="text-align:center;" | | | style="text-align:center;" | 161 | ||
| style="text-align:center;" | | | style="text-align:center;" | 224 | ||
| style="text-align:center;" | | | style="text-align:center;" | 26.2 | ||
|- | |- | ||
| style="text-align:left;" | [[ | | style="text-align:left;" | [[Fauji Fertilizer Company|Fauji Fertilizer Co. Ltd.]] | ||
| style="text-align:center;" | | | style="text-align:center;" | 327 | ||
| style="text-align:center;" | | | style="text-align:center;" | 181 | ||
| style="text-align:center;" | | | style="text-align:center;" | 19.7 | ||
|- | |- | ||
| style="text-align:left;" | [[Attock Petroleum Limited|Attock Petroleum Ltd.]] | | style="text-align:left;" | [[Attock Petroleum Limited|Attock Petroleum Ltd.]] | ||
|style="text-align:center;" | | | style="text-align:center;" | 108 | ||
|style="text-align:center;" | | | style="text-align:center;" | 474 | ||
|style="text-align:center;" | | | style="text-align:center;" | 12.5 | ||
|- | |- | ||
| style="text-align:left;" | [[ | | style="text-align:left;" | [[Toyota Indus|Indus Motor Co. Ltd.]] | ||
|style="text-align:center;" | | | style="text-align:center;" | 123 | ||
|style="text-align:center;" | | | style="text-align:center;" | 178 | ||
|style="text-align:center;" | | | style="text-align:center;" | 9.7 | ||
|- | |- | ||
| style="text-align:left;" | [[ | | style="text-align:left;" | [[Shell Pakistan|Shell Pakistan Ltd.]] | ||
| style="text-align:center;" | | | style="text-align:center;" | 106 | ||
| style="text-align:center;" | | | style="text-align:center;" | 432 | ||
| style="text-align:center;" | | | style="text-align:center;" | 5.8 | ||
|- | |- | ||
| style="text-align:left;" | [[ | | style="text-align:left;" | [[Fauji Fertilizer Bin Qasim|Fauji Fertilizer Bin Qasim Ltd.]] | ||
| style="text-align:center;" | | | style="text-align:center;" | 146 | ||
| style="text-align:center;" | | | style="text-align:center;" | 193 | ||
| style="text-align:center;" | 4.4 | |||
| style="text-align:center;" | | |||
|- | |- | ||
| style="text-align:left;" | [[National Refinery Limited|National Refinery Ltd.]] | | style="text-align:left;" | [[National Refinery Limited|National Refinery Ltd.]] | ||
|style="text-align:center;" | | | style="text-align:center;" | 112 | ||
|style="text-align:center;" | | | style="text-align:center;" | 299 | ||
|style="text-align:center;" | | | style="text-align:center;" | (4.5) | ||
|- | |- | ||
| style="text-align:left;" | [[Nestlé Pakistan|Nestle Pakistan Ltd.]] | | style="text-align:left;" | [[Nestlé Pakistan|Nestle Pakistan Ltd.]] | ||
|style="text-align:center;" | | | style="text-align:center;" | 98 | ||
|style="text-align:center;" | | | style="text-align:center;" | 201 | ||
|style="text-align:center;" | | | style="text-align:center;" | 16.5 | ||
|- | |- | ||
| style="text-align:left;" | [[ | | style="text-align:left;" | [[Cnergyico|Cnergyico PK Limited]] | ||
|style="text-align:center;" | | | style="text-align:center;" | 365 | ||
|style="text-align:center;" | | | style="text-align:center;" | 194 | ||
|style="text-align:center;" | | | style="text-align:center;" | (13.6) | ||
|- | |- | ||
| style="text-align:left;" | [[ | | style="text-align:left;" | [[PTCL|Pakistan Telecommunication Co. Ltd.]] | ||
|style="text-align:center;" | | | style="text-align:center;" | 644 | ||
|style="text-align:center;" | | | style="text-align:center;" | 188 | ||
|style="text-align:center;" | | | style="text-align:center;" | (15.5) | ||
|- | |||
| style="text-align:left;" | [[Pakistan International Airlines|Pakistan International Airlines Corporation Ltd.]] | |||
| style="text-align:center;" | 321 | |||
| style="text-align:center;" | 179 | |||
| style="text-align:center;" | (17.5) | |||
|- | |||
| style="text-align:left;" | [[Nishat Mills|Nishat Mills Ltd.]] | |||
| style="text-align:center;" | 170 | |||
| style="text-align:center;" | 142 | |||
| style="text-align:center;" | 12.2 | |||
|- | |- | ||
| style="text-align:left;" | [[ | | style="text-align:left;" | [[Fauji Cement|Fauji Cement Co. Ltd.]] | ||
| style="text-align:center;" | | | style="text-align:center;" | 139 | ||
| style="text-align:center;" | | | style="text-align:center;" | 90 | ||
| style="text-align:center;" | | | style="text-align:center;" | 29.5 | ||
|- | |- | ||
| style="text-align:left;" | [[ | | style="text-align:left;" | [[Gul Ahmed Textile Mills Limited|Gul Ahmed Textile Mills Ltd.]] | ||
| style="text-align:center;" | | | style="text-align:center;" | 134 | ||
| style="text-align:center;" | | | style="text-align:center;" | 139 | ||
| style="text-align:center;" | | | style="text-align:center;" | 4.9 | ||
|- | |- | ||
| style="text-align:left;" | [[ | | style="text-align:left;" | [[Interloop Limited|INTERLOOP (Pvt) Ltd.]] | ||
| style="text-align:center;" | | | style="text-align:center;" | 125 | ||
| style="text-align:center;" | | | style="text-align:center;" | 121 | ||
| style="text-align:center;" | | | style="text-align:center;" | 21.7 | ||
|- | |- | ||
| style="text-align:left;" | [[ | | style="text-align:left;" | [[Pakistan Tobacco Company|Pakistan Tobacco Co. Ltd.]] | ||
| style="text-align:center;" | | | style="text-align:center;" | 110 | ||
| style="text-align:center;" | | | style="text-align:center;" | 110 | ||
| style="text-align:center;" | | | style="text-align:center;" | 29.0 | ||
|- | |- | ||
| style="text-align:left;" | [[Bestway Cement|Bestway Cement Ltd]]. | | style="text-align:left;" | [[Bestway Cement|Bestway Cement Ltd]]. | ||
|style="text-align:center;" | | | style="text-align:center;" | 175 | ||
|style="text-align:center;" | | | style="text-align:center;" | 88 | ||
|style="text-align:center;" | 11. | | style="text-align:center;" | 11.9 | ||
|- | |- | ||
| style="text-align:left;" | [[ | | style="text-align:left;" | [[Pakistan Refinery Limited|Pakistan Refinery Ltd.]] | ||
| style="text-align:center;" | 105 | |||
| style="text-align:center;" | 262 | |||
| style="text-align:center;" | 1.8 | |||
|style="text-align:center;" | | |||
|style="text-align:center;" | | |||
|style="text-align:center;" | | |||
|} | |} | ||
===== Cement industry ===== | ===== Cement industry ===== | ||
In 1947, Pakistan | In 1947, Pakistan inherited four cement plants with a total capacity of 0.5 million tons. Some expansion occurred in 1956–66 but couldn't keep pace with economic development. The country resorted to cement imports in 1976–77, continuing until 1994–95. The cement sector, comprising 27 plants, contributes over Rs 30 billion to the national exchequer in taxes. By 2013, Pakistan's [[cement]] industry grew rapidly, driven by demand from [[Afghanistan]] and countries boosting the real estate sector. In April 2020, the government introduced an incentive package for the construction industry, including an amnesty scheme, tax exemptions, and a Rs 36 billion subsidy for [[Naya Pakistan Housing & Development Authority|Naya Pakistan Housing Scheme]]. Additionally, banks were directed to increase construction sector loans to 5 percent of their total loan book, and [[Excise|FED]] reduction on cement from Rs 2/kg to Rs 1.5/kg provided further impetus to the industry.<ref>{{cite web|title=Pakistan Economic Survey 2020–21|url=https://www.finance.gov.pk/survey/chapters_21/03-Manufacturing.pdf|url-status=live|access-date=2 September 2021|archive-url=https://web.archive.org/web/20210610182425/https://www.finance.gov.pk/survey/chapters_21/03-Manufacturing.pdf |archive-date=10 June 2021 }}</ref> | ||
{| class="wikitable" | {| class="wikitable" | ||
|+Cement production capacity & dispatches (million tonnes) | |+Cement production capacity & dispatches (million tonnes)<ref>{{cite web |title=Pakistan Economic Survey 2022–23 |url=https://www.finance.gov.pk/survey/chapters_23/03_Manufacturing_and_Mining.pdf |access-date=31 July 2023 |website=finance.gov.pk}}</ref><ref>{{Cite web |title=Cement dispatches declined |url=https://www.apcma.com/new-updates/2023/CementPR-June2023.pdf |access-date=29 August 2023}}</ref> | ||
!Indicators | !Indicators | ||
!2008 | !2008 | ||
| Line 1,877: | Line 2,105: | ||
!2023 | !2023 | ||
|- | |- | ||
|Production | |Production capacity | ||
|37.68 | |37.68 | ||
|42.28 | |42.28 | ||
| Line 1,889: | Line 2,117: | ||
|46.39 | |46.39 | ||
|48.66 | |48.66 | ||
| | |55.90 | ||
|63. | |63.53 | ||
|69. | |69.14 | ||
|69. | |69.29 | ||
|83.18 | |83.18 | ||
|- | |- | ||
|Local | |Local dispatches | ||
|22.58 | |22.58 | ||
|20.33 | |20.33 | ||
| Line 1,931: | Line 2,159: | ||
|4.57 | |4.57 | ||
|- | |- | ||
| | |Total dispatches | ||
|30.30 | |30.30 | ||
|31.31 | |31.31 | ||
| Line 1,951: | Line 2,179: | ||
===== Fertilizer industry ===== | ===== Fertilizer industry ===== | ||
There are nine urea manufacturing plants, one DAP, three NP, four SSP, two CAN, one SOP, and two plants of blended NPKs with a total production capacity of 9,172 thousand tonnes per annum in 2021. Urea is the main fertilizer, holding a 70 percent share in total production. The installed production capacity of 6,307 thousand tonnes per annum is sufficient to meet local demand, subject to the availability of uninterrupted gas and RLNG supply. | |||
{| class="wikitable" | {| class="wikitable" | ||
|+'''Fertilizer | |+'''Fertilizer offtake by nutrients ('000 tonnes)'''<ref>{{cite web |title=Historical Data on Fertilizer Offtake by Nutrients |url=http://www.nfdc.gov.pk/Web-Page%20Updating/Historic%20Offtake.htm |access-date=2024-07-31 |website=National Fertilizer Development Center}}</ref> | ||
!Nutrients | !Nutrients | ||
!2008 | !2008 | ||
| Line 1,969: | Line 2,198: | ||
!2020 | !2020 | ||
!2021 | !2021 | ||
!2022 | |||
|- | |- | ||
|Nitrogen | |Nitrogen | ||
| Line 1,985: | Line 2,215: | ||
|3415 | |3415 | ||
|3711 | |3711 | ||
|3838 | |||
|- | |- | ||
|Phosphorus | |Phosphorus | ||
| Line 2,001: | Line 2,232: | ||
|1084 | |1084 | ||
|1228 | |1228 | ||
|1093 | |||
|- | |- | ||
|Potassium | |Potassium | ||
| Line 2,017: | Line 2,249: | ||
|50 | |50 | ||
|69 | |69 | ||
|71 | |||
|} | |} | ||
| Line 2,022: | Line 2,255: | ||
{{Main|Defence industry of Pakistan}} | {{Main|Defence industry of Pakistan}} | ||
The defence industry of Pakistan, under the [[ | [[File:Al-Khalid IDEAS 2012.jpg|thumb|[[Heavy Industries Taxila|HIT]]-built [[Al-Khalid tank]] on display.]] | ||
The defence industry of Pakistan, under the [[Ministry of Defence Production]], was established in September 1951 to promote and coordinate the array of military production facilities that have emerged since independence. It is actively engaged in numerous joint production projects, such as the [[Al-Khalid tank|Al Khalid 2]] tank, advanced trainer aircraft, combat aircraft, artillery systems like MRLS, combat and surveillance drones like GIDS Shahpar-1 and Shahpar-2, battle management and surveillance radars, electronic warfare systems, navy ships, and submarines. | |||
Pakistan manufactures and sells weapons to over 40 countries, including European customers, generating $620 million annually. The country's sophisticated arms imports increased by 119 percent between 2004–2008 and 2009–13, with China providing 54 percent and the USA 27 percent of Pakistan's imports. | |||
===== Furniture industry ===== | |||
{{Main|Furniture industry in Pakistan}} | |||
===== Pharmaceutical industry ===== | |||
{{Main|Pharmaceutical industry of Pakistan}} | |||
===== Textiles industry ===== | ===== Textiles industry ===== | ||
{{Main|Textile industry in Pakistan}} | {{Main|Textile industry in Pakistan}} | ||
Most of the | Most of the textile industry is concentrated in Punjab. However, before 1990, the industry was predominantly located in Karachi. | ||
Presently, the textile industry comprises two main segments: a highly organized large-scale sector and a considerably fragmented cottage/small-scale sector. The organized sector mainly includes integrated Textile Mills, housing numerous spinning units and a limited number of shuttle-less [[loom]] units. Conversely, the unorganized sector encompasses downstream industries like [[Weaving]], Finishing, Garment, Towels, and [[Hosiery]], all of which possess significant export potential. Within this sector, certain enterprises have expanded to an international scale and exhibit progressive business philosophies. | |||
[[File:Karachi - Pakistan-market.jpg|thumb|Sunday textile market on the sidewalks of [[Karachi]], Pakistan]] | |||
As of June 2021, the Pakistani textile industry comprised 517 textile units, including 40 composite units and 477 spinning units. This landscape also included 28,500 shuttle-less looms and 375,000 conventional looms. The growth of the spinning sector has been fueled by export demands and cotton production, with subsequent growth observed in the weaving and processing sector. Notably, independent [[Air-jet loom|air-jet weaving]] units have emerged, both as standalone entities and in conjunction with spinning or processing units. | |||
A notable trend is the ongoing backward integration of some clothing units, while spinning units are actively developing weaving, finishing, and assembly capabilities to create a comprehensive supply chain. This symbiotic relationship between the textile and clothing sectors is leading to horizontal and vertical integration, often managed by the same entities or through business collaborations.<ref>{{Cite web |title=Performance of Textile Industry |url=https://www.tco.com.pk/documents/7098418c64.pdf |access-date=31 August 2023 |website=tco.com.pk}}</ref> | |||
===== Automobile | This sector contributes nearly one-fourth of industrial value-added and provides employment to about 40 percent of the industrial labor force. Excluding seasonal and cyclical fluctuations, textile products have maintained an average share of about 60 percent in national exports.{{citation needed|date=March 2025}} | ||
===== Automobile industry ===== | |||
{{Main|Automotive industry in Pakistan}} | {{Main|Automotive industry in Pakistan}} | ||
The auto sector | [[File:Karachi-Shahrah-e-Faisal boulevard.jpg|thumb|Cars on [[Shahrah-e-Faisal]] in Karachi]] | ||
The auto sector constituted about 7 percent of LSM in 2021, contributing significantly to the country's industrial output.<ref>{{cite web|title=The Wait Is Over|url=https://dnd.com.pk/pakistans-auto-policy-2021-2026-is-here/249336|url-status=live|access-date=2 September 2021|website=DND|date=7 July 2021|archive-url=https://web.archive.org/web/20210707104938/https://dnd.com.pk/pakistans-auto-policy-2021-2026-is-here/249336|archive-date=7 July 2021}}</ref> Given government support and the removal of obstacles, the industrial expansion is expected to yield positive results soon. Many new investors have joined with commercial production, while existing players have already made substantial investments, with more in the pipeline. Among the automakers yet to start production, [[Proton Holdings|Proton]], [[MG Motor|MG]], and [[Volkswagen]] are poised to make a significant impact in the local passenger vehicle market. Meanwhile, [[Kia|KIA]], [[Hyundai Motor Company|Hyundai]], [[Changan Automobile|Changan]], and [[DFSK Motor|Prince DFSK]] have already commenced productions in Pakistan.<ref>{{cite web|title=Here's The Status of Each New Car Company in Pakistan|url=https://propakistani.pk/2021/03/08/heres-the-status-of-each-new-car-company-in-pakistan/|url-status=live|access-date=5 September 2021|website=propakistani.pk|date=8 March 2021 |archive-url=https://web.archive.org/web/20210309005156/https://propakistani.pk/2021/03/08/heres-the-status-of-each-new-car-company-in-pakistan/ |archive-date=9 March 2021 }}</ref> | |||
{| class="wikitable" | {| class="wikitable" | ||
|+Production & | |+Production & sale of vehicles<ref>{{cite web |title=Production (P) & Sale (S) of Vehicles |url=https://pama.org.pk/wp-content/uploads/2025/07/Historical-Data-1995-2025.pdf |access-date=2025-08-11 |website=pama.org.pk}}</ref> | ||
!Type | !Type | ||
! | ! | ||
| Line 2,055: | Line 2,303: | ||
!2022 | !2022 | ||
!2023 | !2023 | ||
!2024 | |||
!2025 | |||
|- | |- | ||
| rowspan="2" |[[Car]] | | rowspan="2" |[[Car]] | ||
| Line 2,068: | Line 2,318: | ||
|226,433 | |226,433 | ||
|101,984 | |101,984 | ||
|79,573 | |||
|111,402 | |||
|- | |- | ||
!S | !S | ||
| Line 2,080: | Line 2,332: | ||
|234,180 | |234,180 | ||
|96,811 | |96,811 | ||
|81,577 | |||
|112,203 | |||
|- | |- | ||
| rowspan="2" |[[Truck]] | | rowspan="2" |[[Truck]] | ||
| Line 2,092: | Line 2,346: | ||
|3,808 | |3,808 | ||
|5,659 | |5,659 | ||
|3, | |3,074 | ||
|2,204 | |||
|4,366 | |||
|- | |- | ||
!S | !S | ||
| Line 2,105: | Line 2,361: | ||
|5,802 | |5,802 | ||
|3,182 | |3,182 | ||
|2,187 | |||
|4,444 | |||
|- | |- | ||
| rowspan="2" |[[Bus]] | | rowspan="2" |[[Bus]] | ||
| Line 2,118: | Line 2,376: | ||
|661 | |661 | ||
|701 | |701 | ||
|419 | |||
|796 | |||
|- | |- | ||
!S | !S | ||
| Line 2,130: | Line 2,390: | ||
|696 | |696 | ||
|654 | |654 | ||
|454 | |||
|788 | |||
|- | |- | ||
| rowspan="2" |[[Jeep]] & | | rowspan="2" |[[Jeep]] & pick-up | ||
!P | !P | ||
|21,624 | |21,624 | ||
| Line 2,143: | Line 2,405: | ||
|44,421 | |44,421 | ||
|31,333 | |31,333 | ||
|21,084 | |||
|36,807 | |||
|- | |- | ||
!S | !S | ||
| Line 2,155: | Line 2,419: | ||
|45,087 | |45,087 | ||
|30,067 | |30,067 | ||
|22,250 | |||
|35,820 | |||
|- | |- | ||
| rowspan="2" |[[Tractor|Farm | | rowspan="2" |[[Tractor|Farm tractor]] | ||
!P | !P | ||
|48,887 | |48,887 | ||
| Line 2,168: | Line 2,434: | ||
|58,880 | |58,880 | ||
|31,726 | |31,726 | ||
|45,529 | |||
|28,607 | |||
|- | |- | ||
!S | !S | ||
| Line 2,180: | Line 2,448: | ||
|58,947 | |58,947 | ||
|30,942 | |30,942 | ||
|45,484 | |||
|29,192 | |||
|- | |- | ||
| rowspan="2" |[[Motorcycle|2/3 | | rowspan="2" |[[Motorcycle|2/3 wheelers]] | ||
!P | !P | ||
|520,124 | |520,124 | ||
| Line 2,193: | Line 2,463: | ||
|1,826,467 | |1,826,467 | ||
|1,185,532 | |1,185,532 | ||
|1,150,090 | |||
|1,514,718 | |||
|- | |- | ||
!S | !S | ||
| Line 2,205: | Line 2,477: | ||
|1,821,885 | |1,821,885 | ||
|1,186,969 | |1,186,969 | ||
|1,150,112 | |||
|1,518,752 | |||
|} | |} | ||
After the entry of new models and brands by new entrants and due to the | Note: These figures do not include the production/sale of companies which are not members of the [[Pakistan Automotive Manufacturers Association|Pakistan Automotive Manufacturers Association (PAMA)]]. | ||
After the entry of new models and brands by new entrants and due to the significantly low benchmark interest rate of 7%, consumer financing hit an all-time high in 2021. This trend started when a new Automotive Development Policy (2016–2021) was first approved by the ECC in its meeting held on 18 March 2016. | |||
Such growth in demand for car financing was last seen during President [[Pervez Musharraf]]'s regime (2001–2008) when banks, having ample liquidity, lent a significant amount for cars without checking borrowers' capabilities to repay the debt. Later, the car financing bubble burst when a large number of people defaulted on paying off the car financing. | |||
{| class="wikitable" | {| class="wikitable" | ||
|+Outstanding | |+Outstanding loans of consumer financing for automobiles (billion PKR)<ref name="CL"/> | ||
!Jun 2006 | !Jun 2006 | ||
!Jun 2007 | !Jun 2007 | ||
| Line 2,225: | Line 2,501: | ||
!Jun 2022 | !Jun 2022 | ||
!Jun 2023 | !Jun 2023 | ||
!Jun 2024 | |||
|- | |- | ||
|97.78 | |97.78 | ||
| Line 2,238: | Line 2,515: | ||
|367.85 | |367.85 | ||
|293.728 | |293.728 | ||
|230.501 | |||
|} | |} | ||
| Line 2,243: | Line 2,521: | ||
{{Main|Mining in Pakistan}} | {{Main|Mining in Pakistan}} | ||
Pakistan is endowed with significant mineral resources and is emerging as a very promising area for prospecting/exploration for | [[File:Khewra Salt Mine - Crystal Deposits on the mine walls.jpg|thumb|[[Khewra Salt Mine]] in the [[Jhelum District]]]] | ||
Mining and quarrying | |||
Pakistan is endowed with significant mineral resources and is emerging as a very promising area for prospecting/exploration for mineral deposits. In the wake of the 18th amendment to the constitution, all the provinces are free to exploit and explore the mineral resources within their jurisdiction. | |||
Mining and quarrying contribute 13.19% to the industrial sector, with its share in GDP being 2.4%. | |||
In the recent past, exploration by government agencies as well as | In the recent past, exploration by government agencies as well as multinational mining companies presents ample evidence of the occurrences of sizeable mineral deposits. Recent discoveries of a thick oxidised zone underlain by sulphide zones in the shield area of the Punjab province, covered by thick alluvial cover, have opened new vistas for metallic minerals exploration. Pakistan has a large base for industrial minerals. The discovery of coal deposits with over 175 billion tonnes of reserves at Thar in the Sindh province has given an impetus to develop it as an alternative source of energy. There is vast potential for precious and dimension stones. | ||
Extraction of principal minerals in the last 10 fiscal years is given in the table below:<ref>{{cite web |title=Extraction of Principal Minerals |url=https://www.finance.gov.pk/survey/chapter_22/PES03-MANUFACTURING.pdf |url-status=live |archive-url=https://web.archive.org/web/20210610182425/https://www.finance.gov.pk/survey/chapters_21/03-Manufacturing.pdf |archive-date=10 June 2021 |access-date=10 June 2022 |website=Finance division}}</ref><ref>{{Cite web |title=Statistical Bulletin - August 2024 |url=https://www.sbp.org.pk/reports/stat_reviews/Bulletin/2024/Aug/Chap-9.pdf |access-date=2024-09-14 |website=sbp.org.pk}}</ref> | |||
{| class="wikitable" | {| class="wikitable" | ||
|- | |- | ||
! Minerals | ! Minerals | ||
! Unit of | ! Unit of quantity | ||
! FY 2015 | |||
! 2015 | ! FY 2016 | ||
! 2016 | ! FY 2017 | ||
! 2017 | ! FY 2018 | ||
! 2018 | ! FY 2019 | ||
! 2019 | ! FY 2020 | ||
! 2020 | ! FY 2021 | ||
! 2021 | ! FY 2022 | ||
|- | !FY 2023 | ||
| [[Coal]] | !FY 2024 | ||
| Metric ton (000) | |- | ||
| [[Coal]] | |||
| Metric ton (000) | |||
| style="text-align:center" | 3,407 | | style="text-align:center" | 3,407 | ||
| style="text-align:center" | {{increase}}3,750 | | style="text-align:center" | {{increase}}3,750 | ||
| Line 2,269: | Line 2,553: | ||
| style="text-align:center" | {{increase}}4,478 | | style="text-align:center" | {{increase}}4,478 | ||
| style="text-align:center" | {{increase}}5,407 | | style="text-align:center" | {{increase}}5,407 | ||
| style="text-align:center" | {{increase}}8,428 | | style="text-align:center" | {{increase}} 8,428 | ||
| style="text-align:center" |{{increase}}9,230 | | style="text-align:center" |{{increase}} 9,230 | ||
| style="text-align:center" |{{increase}}9, | | style="text-align:center" |{{increase}} 9,678 | ||
|{{increase}} 15,070 | |||
|{{increase}} 20,086 | |||
|- | |- | ||
| [[Natural | | [[Natural gas]] | ||
| MMCFT (000) | | MMCFT (000) | ||
| style="text-align:center" | 1,466 | | style="text-align:center" | 1,466 | ||
| Line 2,280: | Line 2,566: | ||
| style="text-align:center" | {{decrease}}1,459 | | style="text-align:center" | {{decrease}}1,459 | ||
| style="text-align:center" | {{decrease}}1,437 | | style="text-align:center" | {{decrease}}1,437 | ||
| style="text-align:center" | {{decrease}}1,317 | | style="text-align:center" | {{decrease}} 1,317 | ||
|style="text-align:center" |{{decrease}}1,279 | |style="text-align:center" |{{decrease}} 1,279 | ||
|style="text-align:center" |{{increase}}1,308 | |style="text-align:center" |{{increase}} 1,308 | ||
|{{decrease}} 1,190 | |||
|{{decrease}} 1,141 | |||
|- | |- | ||
| [[Crude | | [[Crude oil]] | ||
| JSB (000) | | JSB (000) | ||
| style="text-align:center" | 34,490 | | style="text-align:center" | 34,490 | ||
| Line 2,291: | Line 2,579: | ||
| style="text-align:center" | {{increase}}32,557 | | style="text-align:center" | {{increase}}32,557 | ||
| style="text-align:center" | {{decrease}}32,495 | | style="text-align:center" | {{decrease}}32,495 | ||
| style="text-align:center" | {{decrease}}28,091 | | style="text-align:center" | {{decrease}} 28,091 | ||
|style="text-align:center" |{{decrease}}27,560 | |style="text-align:center" |{{decrease}} 27,560 | ||
|style="text-align:center" |{{increase}}28,098 | |style="text-align:center" |{{increase}} 28,098 | ||
|{{decrease}} 25,360 | |||
|{{increase}} 25,812 | |||
|- | |- | ||
| [[Chromite]] | | [[Chromite]] | ||
| Line 2,303: | Line 2,593: | ||
| style="text-align:center" | {{increase}}138,244 | | style="text-align:center" | {{increase}}138,244 | ||
| style="text-align:center" | {{decrease}}121,435 | | style="text-align:center" | {{decrease}}121,435 | ||
|style="text-align:center" |{{increase}}134,000 | |style="text-align:center" |{{increase}} 134,000 | ||
|style="text-align:center" |{{increase}}195,000 | |style="text-align:center" |{{increase}}195,000 | ||
|{{decrease}} 156,000 | |||
|{{increase}} 259,000 | |||
|- | |- | ||
| [[Dolomite (mineral)|Dolomite]] | | [[Dolomite (mineral)|Dolomite]] | ||
| Line 2,314: | Line 2,606: | ||
| style="text-align:center" | {{decrease}}472,474 | | style="text-align:center" | {{decrease}}472,474 | ||
| style="text-align:center" | {{decrease}}302,045 | | style="text-align:center" | {{decrease}}302,045 | ||
| style="text-align:center" |{{increase}}388,000 | | style="text-align:center" |{{increase}} 388,000 | ||
| style="text-align:center" |{{increase}}487,000 | | style="text-align:center" |{{increase}}487,000 | ||
|{{increase}} 544,000 | |||
|{{decrease}} 502,000 | |||
|- | |- | ||
| [[Gypsum]] | | [[Gypsum]] | ||
| Line 2,324: | Line 2,618: | ||
| style="text-align:center" | {{increase}}2,476 | | style="text-align:center" | {{increase}}2,476 | ||
| style="text-align:center" | {{increase}}2,518 | | style="text-align:center" | {{increase}}2,518 | ||
| style="text-align:center" | {{decrease}}2,150 | | style="text-align:center" | {{decrease}} 2,150 | ||
| style="text-align:center" |{{increase}}2,527 | | style="text-align:center" |{{increase}} 2,527 | ||
| style="text-align:center" |{{decrease}}2,325 | | style="text-align:center" |{{decrease}} 2,325 | ||
|{{decrease}} 1,640 | |||
|{{increase}} 2,136 | |||
|- | |- | ||
| [[Limestone]] | | [[Limestone]] | ||
| Line 2,335: | Line 2,631: | ||
| style="text-align:center" | {{increase}}70,819 | | style="text-align:center" | {{increase}}70,819 | ||
| style="text-align:center" | {{increase}}75,596 | | style="text-align:center" | {{increase}}75,596 | ||
| style="text-align:center" | {{decrease}}65,810 | | style="text-align:center" | {{decrease}} 65,810 | ||
| style="text-align:center" |{{increase}}76,632 | | style="text-align:center" |{{increase}} 76,632 | ||
| style="text-align:center" |{{decrease}}58,362 | | style="text-align:center" |{{decrease}} 58,362 | ||
|{{increase}} 58,941 | |||
|{{increase}} 61,387 | |||
|- | |- | ||
| [[ | | [[Rock salt]] | ||
| Metric ton (000) | | Metric ton (000) | ||
| style="text-align:center" | 2,136 | | style="text-align:center" | 2,136 | ||
| Line 2,346: | Line 2,644: | ||
| style="text-align:center" | {{increase}}3,654 | | style="text-align:center" | {{increase}}3,654 | ||
| style="text-align:center" | {{increase}}3,799 | | style="text-align:center" | {{increase}}3,799 | ||
| style="text-align:center" | {{decrease}}3,369 | | style="text-align:center" | {{decrease}} 3,369 | ||
| style="text-align:center" |{{decrease}}3,366 | | style="text-align:center" |{{decrease}} 3,366 | ||
| style="text-align:center" |{{decrease}}2,716 | | style="text-align:center" |{{decrease}} 2,716 | ||
|{{increase}} 2,907 | |||
|{{increase}} 3,200 | |||
|- | |- | ||
| [[Sulphur]] | | [[Sulphur]] | ||
| Line 2,357: | Line 2,657: | ||
| style="text-align:center" | {{decrease}}22,040 | | style="text-align:center" | {{decrease}}22,040 | ||
| style="text-align:center" | {{decrease}}20,715 | | style="text-align:center" | {{decrease}}20,715 | ||
| style="text-align:center" | {{decrease}}19,948 | | style="text-align:center" | {{decrease}} 19,948 | ||
| style="text-align:center" |{{decrease}}19,000 | | style="text-align:center" |{{decrease}} 19,000 | ||
| style="text-align:center" |{{decrease}}16,000 | | style="text-align:center" |{{decrease}} 16,000 | ||
|{{decrease}} 11,690 | |||
|{{decrease}} 7,200 | |||
|- | |- | ||
| [[Barytes]] | | [[Barytes]] | ||
| Line 2,368: | Line 2,670: | ||
| style="text-align:center" | {{increase}}145,189 | | style="text-align:center" | {{increase}}145,189 | ||
| style="text-align:center" | {{decrease}}116,480 | | style="text-align:center" | {{decrease}}116,480 | ||
| style="text-align:center" | {{decrease}}55,341 | | style="text-align:center" | {{decrease}} 55,341 | ||
| style="text-align:center" |{{decrease}}52,000 | | style="text-align:center" |{{decrease}} 52,000 | ||
| style="text-align:center" |{{increase}}128,000 | | style="text-align:center" |{{increase}} 128,000 | ||
|{{increase}} 141,000 | |||
|{{increase}} 145,000 | |||
|- | |- | ||
| [[Marble]] | | [[Marble]] | ||
| Line 2,389: | Line 2,682: | ||
| style="text-align:center" | {{increase}}4,906 | | style="text-align:center" | {{increase}}4,906 | ||
| style="text-align:center" | {{increase}}8,813 | | style="text-align:center" | {{increase}}8,813 | ||
| style="text-align:center" | {{decrease}}7,736 | | style="text-align:center" | {{decrease}} 7,736 | ||
| style="text-align:center" | {{decrease}}5,797 | | style="text-align:center" | {{decrease}} 5,797 | ||
| style="text-align:center" |{{increase}}7,917 | | style="text-align:center" |{{increase}} 7,917 | ||
| style="text-align:center" |{{decrease}}6,626 | | style="text-align:center" |{{decrease}} 6,626 | ||
|{{decrease}} 5,714 | |||
|{{increase}} 7,490 | |||
|} | |} | ||
==== | ==== Energy ==== | ||
Main sources of Pakistan primary energy supplies | {{Main|Energy policy of Pakistan}} | ||
{{see also|Renewable energy in Pakistan|Electricity sector in Pakistan}} | |||
[[File:Wind power plant between Karachi and Hyderabad.jpg|thumb|[[Wind turbine|Wind power plant]] between [[Karachi]] and [[Hyderabad, Sindh|Hyderabad]]]] | |||
The main sources of Pakistan's primary energy supplies are gas, oil, coal, [[liquefied natural gas]] (LNG), and hydroelectricity, with shares of 29%, 24%, 15%, 10%, and 11% respectively in 2022. Since coal mining began in the Thar desert and LNG imports from Qatar, coal and imported LNG increased their shares manyfold in just five years in the primary energy supplies of the country. The share of gas has decreased from 50% in 2005 to 24% in 2022, and oil, since 2015, from 35% to 27% in 2022, being largely replaced by coal and LNG. As Pakistan intends to generate around 8,800 megawatts of nuclear power by 2030, its share is also increasing gradually. | |||
{| class="wikitable" | {| class="wikitable" | ||
|+Primary | |+Primary energy supplies by source<ref name="NR">{{cite web |title=Nepra reports |url=https://nepra.org.pk/publications/State%20of%20Industry%20Reports.php |url-status=live |archive-url=https://web.archive.org/web/20200224150614/https://nepra.org.pk/publications/State%20of%20Industry%20Reports.php |archive-date=24 February 2020 |access-date=3 October 2021 |website=NEPRA}}</ref> | ||
!Fiscal | !Fiscal year | ||
!Unit | !Unit | ||
!Gas | !Gas | ||
!Oil | !Oil | ||
!Coal | !Coal | ||
!Hydro | |||
electricity | |||
!LNG | !LNG | ||
!Nuclear | !Nuclear | ||
electricity | |||
!LPG | !LPG | ||
!Renewable | !Renewable | ||
electricity | |||
!Imported | !Imported | ||
electricity | |||
!Total | !Total | ||
|- | |- | ||
| Line 2,422: | Line 2,722: | ||
|{{increase}} 16.33 | |{{increase}} 16.33 | ||
|{{increase}} 4.23 | |{{increase}} 4.23 | ||
|{{decrease}} 6.13 | |{{decrease}} 6.13 | ||
| – | |||
|{{increase}} 0.67 | |{{increase}} 0.67 | ||
|{{increase}} 0.25 | |{{increase}} 0.25 | ||
| | | – | ||
|{{increase}} 0.03 | |{{increase}} 0.03 | ||
|{{increase}} 55.59 | |{{increase}} 55.59 | ||
| Line 2,434: | Line 2,734: | ||
|{{decrease}} 29.4 | |{{decrease}} 29.4 | ||
|{{increase}} 7.6 | |{{increase}} 7.6 | ||
|{{decrease}} 11.0 | |{{decrease}} 11.0 | ||
| – | |||
|{{increase}} 1.2 | |{{increase}} 1.2 | ||
|{{increase}} 0.5 | |{{increase}} 0.5 | ||
| | | – | ||
|{{increase}} 0.0 | |{{increase}} 0.0 | ||
|100 | |100 | ||
| Line 2,447: | Line 2,747: | ||
|{{increase}} 19.81 | |{{increase}} 19.81 | ||
|{{increase}} 4.62 | |{{increase}} 4.62 | ||
|{{increase}} 6.71 | |{{increase}} 6.71 | ||
| – | |||
|{{increase}} 0.69 | |{{increase}} 0.69 | ||
|{{increase}} 0.40 | |{{increase}} 0.40 | ||
| | | – | ||
|{{increase}} 0.06 | |{{increase}} 0.06 | ||
|{{increase}} 63.09 | |{{increase}} 63.09 | ||
| Line 2,459: | Line 2,759: | ||
|{{increase}} 31.4 | |{{increase}} 31.4 | ||
|{{decrease}} 7.3 | |{{decrease}} 7.3 | ||
|{{decrease}} 10.6 | |{{decrease}} 10.6 | ||
| – | |||
|{{decrease}} 1.1 | |{{decrease}} 1.1 | ||
|{{increase}} 0.6 | |{{increase}} 0.6 | ||
| | | – | ||
|{{increase}} 0.1 | |{{increase}} 0.1 | ||
|100 | |100 | ||
| Line 2,472: | Line 2,772: | ||
|{{increase}} 24.97 | |{{increase}} 24.97 | ||
|{{increase}} 4.95 | |{{increase}} 4.95 | ||
|{{increase}} 7.75 | |||
|{{increase}} 0.47 | |{{increase}} 0.47 | ||
|{{increase}} 1.38 | |{{increase}} 1.38 | ||
|{{increase}} 0.46 | |{{increase}} 0.46 | ||
| Line 2,484: | Line 2,784: | ||
|{{increase}} 35.5 | |{{increase}} 35.5 | ||
|{{decrease}} 7.0 | |{{decrease}} 7.0 | ||
|{{increase}} 11.0 | |||
|{{increase}} 0.7 | |{{increase}} 0.7 | ||
|{{increase}} 2.0 | |{{increase}} 2.0 | ||
|{{increase}} 0.7 | |{{increase}} 0.7 | ||
| Line 2,497: | Line 2,797: | ||
|{{decrease}} 18.19 | |{{decrease}} 18.19 | ||
|{{increase}} 14.71 | |{{increase}} 14.71 | ||
|{{increase}} 8.02 | |||
|{{increase}} 8.32 | |{{increase}} 8.32 | ||
|{{increase}} 2.58 | |{{increase}} 2.58 | ||
|{{increase}} 1.03 | |{{increase}} 1.03 | ||
| Line 2,506: | Line 2,806: | ||
|- | |- | ||
|%Share | |%Share | ||
|{{decrease}} 33. | |{{decrease}} 33.0 | ||
|{{decrease}} | |{{decrease}} 26.7 | ||
|{{increase}} 18. | |{{increase}} 18.2 | ||
|{{decrease}} 9.9 | |||
|{{increase}} 10.3 | |{{increase}} 10.3 | ||
|{{increase}} 3.2 | |{{increase}} 3.2 | ||
|{{increase}} 1.3 | |{{increase}} 1.3 | ||
|{{increase}} 1.2 | |{{increase}} 1.2 | ||
|{{increase}} 0.2 | |{{increase}} 0.2 | ||
|100 | |||
|- | |||
| rowspan="2" |2023 | |||
|MTOE | |||
|{{decrease}} 23.88 | |||
|{{increase}} 20.11 | |||
|{{decrease}} 12.57 | |||
|{{increase}} 8.75 | |||
|{{decrease}} 8.05 | |||
|{{increase}} 6.20 | |||
|{{increase}} 1.56 | |||
|{{increase}} 1.39 | |||
|{{decrease}} 0.11 | |||
|82.62 | |||
|- | |||
|%Share | |||
|{{decrease}} 28.9 | |||
|{{decrease}} 24.3 | |||
|{{decrease}} 15.2 | |||
|{{increase}} 10.6 | |||
|{{decrease}} 9.7 | |||
|{{increase}} 7.5 | |||
|{{increase}} 1.9 | |||
|{{increase}} 1.7 | |||
|{{decrease}} 0.1 | |||
|100 | |100 | ||
|} | |} | ||
(CPPA-G) | (CPPA-G) procures electricity from power producers, and the [[National Transmission & Despatch Company|National Transmission and Despatch Company]] (NTDC) transmits this electricity via its transmission lines to Distribution Companies<ref>[https://nepra.org.pk/licensing/Distribution%20XWDISCOs.php Distribution Companies]</ref> (DISCOs), which then distribute this electricity via their distribution lines to end consumers. Balancing Pakistan's supply of electricity against the demand has been a longstanding unresolved issue. Since 2018, there has been an improvement in the availability of electricity due to the substantial increase in generation capacity. However, the cost of electricity has risen due to various factors such as circular debt, capacity payments, fuel costs, currency devaluation, low recovery rates, and transmission and distribution losses. Pakistan faces a significant challenge in overhauling its electricity supply network. | ||
{| class="wikitable" | {| class="wikitable" | ||
|+[[ | |+[[NEPRA]] reports<ref name="NR"/> | ||
! | !Indicator | ||
!2016 | !2016 | ||
!2017 | !2017 | ||
| Line 2,530: | Line 2,854: | ||
!2021 | !2021 | ||
!2022 | !2022 | ||
!2023 | |||
!2024 | |||
|- | |- | ||
|Installed | |Installed capacity (MW) | ||
|{{increase}} 25,421 | |{{increase}} 25,421 | ||
|{{increase}} 28,712 | |{{increase}} 28,712 | ||
| Line 2,540: | Line 2,864: | ||
|{{decrease}} 38,719 | |{{decrease}} 38,719 | ||
|{{increase}} 39,772 | |{{increase}} 39,772 | ||
|{{increase}} 43, | |{{increase}} 43,835 | ||
|{{increase}} 45,738 | |||
|{{increase}} 45,888 | |||
|- | |- | ||
|Electricity | |Electricity generation (GWh) | ||
|{{increase}} 114,093 | |{{increase}} 114,093 | ||
|{{increase}} 120,622 | |{{increase}} 120,622 | ||
| Line 2,551: | Line 2,875: | ||
|{{decrease}} 134,242 | |{{decrease}} 134,242 | ||
|{{increase}} 143,589 | |{{increase}} 143,589 | ||
|{{increase}} | |{{increase}} 154,056 | ||
|{{decrease}} 138,539 | |||
|{{decrease}} 137,196 | |||
|- | |- | ||
|Electricity | |Electricity consumption (GWh) | ||
|{{increase}} 94,354 | |{{increase}} 94,354 | ||
|{{increase}} 99,616 | |{{increase}} 99,616 | ||
| Line 2,563: | Line 2,887: | ||
|{{increase}} 121,206 | |{{increase}} 121,206 | ||
|{{increase}} 133,665 | |{{increase}} 133,665 | ||
|{{decrease}} 121,863 | |||
|{{decrease}} 118,246 | |||
|- | |- | ||
|Transmission losses (%) | |Transmission losses (%) | ||
|{{DecreasePositive}} 2.57 | |{{DecreasePositive}} 2.57 | ||
|{{DecreasePositive}} | |{{DecreasePositive}} 2.31 | ||
|{{IncreaseNegative}} 2.43 | |{{IncreaseNegative}} 2.43 | ||
|{{IncreaseNegative}} 2.83 | |{{IncreaseNegative}} 2.83 | ||
| Line 2,574: | Line 2,898: | ||
|{{IncreaseNegative}} 2.78 | |{{IncreaseNegative}} 2.78 | ||
|{{DecreasePositive}} 2.62 | |{{DecreasePositive}} 2.62 | ||
|{{DecreasePositive}} 2.42 | |||
|{{IncreaseNegative}} 2.52 | |||
|- | |- | ||
|Distribution losses (%) | |Distribution losses (%) | ||
|{{DecreasePositive}} 18.14 | |{{DecreasePositive}} 18.14 | ||
|{{DecreasePositive}} 17.93 | |{{DecreasePositive}} 17.93 | ||
|{{IncreaseNegative}} 18.32 | |{{IncreaseNegative}} 18.32 | ||
|{{DecreasePositive}} 17.61 | |{{DecreasePositive}} 17.61 | ||
|{{IncreaseNegative}} | |{{IncreaseNegative}} 17.82 | ||
|{{DecreasePositive}} 17. | |{{DecreasePositive}} 17.32 | ||
|{{DecreasePositive}} | |{{DecreasePositive}} 16.85 | ||
|{{DecreasePositive}} 16.45 | |||
|{{IncreaseNegative}} 18.31 | |||
|- | |- | ||
! colspan=" | ! colspan="10" |(%) '''Share in electricity generation''' | ||
|- | |- | ||
|Hydel | |Hydel | ||
|{{decrease}} 30.29 | |{{decrease}} 30.29 | ||
|{{decrease}} 26.59 | |{{decrease}} 26.59 | ||
| Line 2,598: | Line 2,921: | ||
|{{increase}} 28.83 | |{{increase}} 28.83 | ||
|{{decrease}} 27.02 | |{{decrease}} 27.02 | ||
|{{decrease}} 23. | |{{decrease}} 23.07 | ||
|{{increase}} 26.17 | |||
|{{increase}} 29.08 | |||
|- | |- | ||
|Thermal | |Thermal | ||
|{{decrease}} 64.57 | |{{decrease}} 64.57 | ||
|{{increase}} 65.34 | |{{increase}} 65.34 | ||
| Line 2,609: | Line 2,932: | ||
|{{decrease}} 60.21 | |{{decrease}} 60.21 | ||
|{{increase}} 61.76 | |{{increase}} 61.76 | ||
|{{decrease}} 60. | |{{decrease}} 60.54 | ||
|{{decrease}} 51.55 | |||
|{{decrease}} 49.01 | |||
|- | |- | ||
|Nuclear | |Nuclear | ||
|{{decrease}} 3.70 | |{{decrease}} 3.70 | ||
|{{increase}} 5.20 | |{{increase}} 5.20 | ||
| Line 2,620: | Line 2,943: | ||
|{{increase}} 7.37 | |{{increase}} 7.37 | ||
|{{increase}} 7.72 | |{{increase}} 7.72 | ||
|{{increase}} 11. | |{{increase}} 11.87 | ||
|{{increase}} 17.36 | |||
|{{decrease}} 16.88 | |||
|- | |- | ||
|Renewable | |Renewable energy | ||
|{{increase}} 1.04 | |{{increase}} 1.04 | ||
|{{increase}} 2.45 | |{{increase}} 2.45 | ||
| Line 2,632: | Line 2,955: | ||
|{{decrease}} 3.15 | |{{decrease}} 3.15 | ||
|{{increase}} 4.18 | |{{increase}} 4.18 | ||
|{{increase}} 4.56 | |||
|{{increase}} 4.75 | |||
|- | |- | ||
| colspan=" | | colspan="3" |Import | ||
|0.42 | |0.42 | ||
|{{decrease}} 0.36 | |{{decrease}} 0.36 | ||
| Line 2,639: | Line 2,964: | ||
|{{decrease}} 0.35 | |{{decrease}} 0.35 | ||
|{{decrease}} 0.33 | |{{decrease}} 0.33 | ||
|{{increase}} 0.35 | |||
|{{decrease}} 0.28 | |||
|} | |} | ||
The total demand for petroleum products remained at 23.1 million tonnes during FY2022. The transport and power sectors are major petroleum consumers, covering | |||
The total demand for petroleum products remained at 23.1 million tonnes during FY2022. The transport and power sectors are major petroleum consumers, covering approximately 90 percent of the total demand.<ref>{{Cite web |title=Pakistan Economic Survey 2022–2023 |url=https://www.finance.gov.pk/survey/chapters_23/14_Energy.pdf |access-date=4 September 2023 |website=finance.gov.pk}}</ref> | |||
{| class="wikitable" | {| class="wikitable" | ||
|+Sectoral | |+Sectoral consumption of petroleum products (FY 2022) | ||
! colspan="2" |Sector | ! colspan="2" |Sector | ||
|Domestic | |Domestic | ||
| Line 2,664: | Line 2,993: | ||
!23,090.210 | !23,090.210 | ||
|} | |} | ||
Pakistan is an importer of petroleum products and [[ | |||
Pakistan is an importer of petroleum products and [[crude oil]]. Imports of petroleum products during FY2022 amounted to around 12.9 million tonnes, valued at more than US$11.1 billion. The major imported products are [[Gasoline|motor spirit/gasoline]], [[Diesel fuel|high-speed diesel]], and [[Fuel oil|furnace oil]], with import quantities of 6,502 thousand tonnes, 3,950 thousand tonnes, and 2,258 thousand tonnes, respectively. | |||
{| class="wikitable" | {| class="wikitable" | ||
|+Import of | |+Import of petroleum products (FY 2022) | ||
! colspan="2" |Product | ! colspan="2" |Product | ||
|[[Gasoline|MS]] | |[[Gasoline|MS]] | ||
| Line 2,693: | Line 3,024: | ||
!11,110.852 | !11,110.852 | ||
|} | |} | ||
The total production of refineries in Pakistan for fiscal year 2020–21 reached 10.66 million tons. Among these refineries, [[Pak-Arab Refinery|PARCO]] holds the largest share, accounting for 41%, followed by [[Attock Refinery Limited|ARL]], [[Cnergyico|BPPL]], [[National Refinery Limited|NRL]], and [[Pakistan Refinery Limited|PRL]] with shares of 17%, 16%, 14%, and 12% respectively. [[Oil & Gas Regulatory Authority|OGRA]], founded in March 2002, serves as the regulatory body with the primary goals of promoting competition and enhancing private investment and ownership within the petroleum sector by implementing effective and efficient regulations. [[Petroleum industry|Oil Marketing Companies]] (OMCs) have established their infrastructure, including storage facilities and retail outlets, to market Petroleum, Oil, and Lubricant (POL) products. [[Gasoline|Motor Spirit]] (MS) and [[Diesel fuel|High-Speed Diesel]] (HSD) together make up nearly 80% of OMCs' sales. By the conclusion of fiscal year 2021, OMCs had developed a storage capacity of 0.58 million tons for MS and 0.88 million tons for HSD, distributed across various depots throughout the country. Oil Marketing Companies (OMCs) operate a total of 9,978 retail outlets nationwide. Among these, [[Pakistan State Oil]] (PSO) holds the highest number of retail outlets, boasting 3,158 outlets, which accounts for approximately 31.65 percent of the total.<ref name="PI">{{Cite web |title=State of petroleum industry report 2020-21 |url=https://www.ogra.org.pk/ogra-annual-reports |access-date=5 September 2023 |website=ogra.org.pk |archive-date=3 August 2023 |archive-url=https://web.archive.org/web/20230803173440/https://ogra.org.pk/ogra-annual-reports |url-status=dead}}</ref> | |||
In FY | Indigenous natural gas supplies accounted for approximately 30 percent of Pakistan's total primary energy supply mix in FY2022. Pakistan maintains an extensive gas network comprising over 13,775 kilometers of transmission pipelines, 157,395 kilometers of main pipelines, and 41,352 kilometers of service pipelines. This network serves the needs of more than 10.7 million consumers throughout the country. During FY 2021–22, the natural gas supply in Pakistan reached 3,982 MMCFD. The country relies on several major gas fields, including [[Sui gas field|Sui]], Uch, [[Qadirpur gas field|Qadirpur]], [[Sawan gas field|Sawan]], Zamzama, Badin, Bhit, Kandhkot, [[Mari Petroleum|Mari]], and Manzalai, to meet its domestic demand. Additionally, Pakistan has been importing liquefied natural gas (LNG) since 2015, with regasified liquefied natural gas (RLNG) playing a significant role in alleviating natural gas shortages. In the year 2021–22, approximately 24 percent of the country's gas supplies were sourced from imported RLNG. | ||
In FY 2020–21, the primary consumer of natural gas was the power sector, which accounted for more than 30 percent of the total consumption, equivalent to 1,208 MMCFD. Following the power sector, the domestic sector consumed 21 percent, or 850 MMCFD, while the fertilizer sector consumed 20 percent, totaling 834 MMCFD.<ref name="PI"/> | |||
=== Services === | === Services === | ||
Pakistan's [[service sector]] | Pakistan's [[service sector]] contributes approximately 61.7% to the GDP.<ref name="SS"/> Within this sector, transport, [[Warehouse|storage]], [[Telecommunications|communications]], [[Financial services|finance]], and insurance comprise 24%, while wholesale and retail trade constitute about 30%. Pakistan is actively promoting the growth of the [[information industry]] and other [[Quaternary sector of industry|modern service industries]] by offering incentives such as long-term [[Tax competition|tax holidays]]. | ||
{| class="wikitable" | {| class="wikitable" | ||
|+'''% growth<ref name=" | |+'''% growth<ref name="GR"/>''' | ||
! List | ! List | ||
! FY 2008 | ! FY 2008 | ||
| Line 2,719: | Line 3,052: | ||
! FY 2021 | ! FY 2021 | ||
!FY 2022 | !FY 2022 | ||
!FY 2023 | |||
!FY 2024 | |||
!FY 2025 | |||
|- | |- | ||
|[[Service sector]] | |[[Service sector]] | ||
| Line 2,735: | Line 3,071: | ||
| style="text-align:center" |{{decrease}} -1.21 | | style="text-align:center" |{{decrease}} -1.21 | ||
| style="text-align:center" |{{increase}} 5.91 | | style="text-align:center" |{{increase}} 5.91 | ||
|{{increase}}6. | |{{increase}}6.69 | ||
|{{increase}}0.04 | |||
|{{increase}}2.19 | |||
|{{increase}}2.91 | |||
|} | |} | ||
==== | ==== Education ==== | ||
{{Main|Education in Pakistan}} | |||
==== Healthcare ==== | |||
{{Main|Healthcare in Pakistan}} | |||
==== Telecommunications ==== | |||
{{Main|Telecommunications in Pakistan}} | {{Main|Telecommunications in Pakistan}} | ||
{{see also|Mobile phone industry in Pakistan|Internet in Pakistan}} | |||
[[File:PTCL phone shop.jpg|thumb|[[Pakistan Telecommunication Company Ltd|PTCL]]'s One Stop Shop in Islamabad]] | [[File:PTCL phone shop.jpg|thumb|[[Pakistan Telecommunication Company Ltd|PTCL]]'s One Stop Shop in Islamabad]] | ||
After the [[ | |||
After the deregulation of the [[telecommunications industry]], the sector has experienced exponential growth. [[Pakistan Telecommunication Company Ltd]] (PTCL) has emerged as a successful [[Forbes 2000]] conglomerate with over US$1 billion in sales in 2005. The mobile telephone market has expanded many-fold since 2003, reaching a subscriber base of 140 million users in July 2017, one of the highest mobile teledensities in the world.<ref name="HO">{{cite web|url=http://www.pta.gov.pk/index.php?Itemid=599 |title=Home |publisher=PTA |accessdate=4 March 2022}}</ref> Pakistan won the prestigious Government Leadership award of [[GSM Association]] in 2006.<ref>{{cite web|url=http://www.gsmworld.com/news/press_2006/press06_14.shtml |title=Pakistan Recognised by GSMA for Exceptional Work in Developing Mobile Communications|access-date=25 August 2006 |url-status=dead |archive-url=https://web.archive.org/web/20060904133739/http://www.gsmworld.com/news/press_2006/press06_14.shtml |archive-date=4 September 2006}}<!-- GSM World. Retrieved on 16 February 2008 --></ref> | |||
In Pakistan, the following are the top mobile phone operators: | In Pakistan, the following are the top mobile phone operators: | ||
# [[Jazz Pakistan]] (parent: [[VEON]], Netherlands) | # [[Jazz Pakistan]] (parent: [[VEON]], Netherlands) | ||
# [[Ufone]] (parent: PTCL ([[Etisalat]]), Pakistan/UAE) | # [[Ufone]] (parent: PTCL ([[Etisalat]]), Pakistan/UAE) | ||
| Line 2,750: | Line 3,098: | ||
# [[Zong Pakistan|Zong]] (parent: [[China Mobile]], China) | # [[Zong Pakistan|Zong]] (parent: [[China Mobile]], China) | ||
By March 2009, Pakistan had 91 million mobile subscribers | By March 2009, Pakistan had 91 million mobile subscribers – 25 million more subscribers than reported in the same period in 2008. In addition to the 3.1 million fixed lines, as many as 2.4 million are using Wireless Local Loop connections. [[Sony Ericsson]], [[Nokia]] and [[Motorola]] along with [[Samsung Electronics|Samsung]] and [[LG]] remain the most popular brands among customers.<ref>{{cite web |url=http://www.brecorder.com/index.php?id=30899&currPageNo=1&query=&search=&term=&supDate= |archive-url=https://web.archive.org/web/20100611115413/http://www.brecorder.com/index.php?id=30899&currPageNo=1&query=&search=&term=&supDate= |url-status=dead |archive-date=11 June 2010 |title=Business Recorder [Pakistan's First Financial Daily] |publisher=Brecorder.com |date=1 January 2004 |access-date=29 July 2010}}</ref> | ||
After liberalisation, between 2003 to 2007, the Pakistani telecom sector attracted more than $9 billion in foreign investments.<ref>{{cite web|url=http://www.dailytimes.com.pk/default.asp?page=2007%5C06%5C23%5Cstory_23-6-2007_pg5_10 |title=Leading News Resource of Pakistan |publisher=Daily Times |access-date=29 July 2010 |url-status=dead |archive-url=https://web.archive.org/web/20100611043335/http://www.dailytimes.com.pk/default.asp?page=2007%5C06%5C23%5Cstory_23-6-2007_pg5_10 |archive-date=11 June 2010 }}</ref> During 2007–08, the Pakistani communication sector alone received $1.62 billion in Foreign Direct Investment (FDI) – about 30% of the country's total foreign direct investment. | |||
According to the [[PC World]], a total of 6.37 billion text messages were sent through Acision messaging systems across Asia Pacific over the 2008/2009 Christmas and New Year period.<ref>{{cite web |date=1 February 2009 |title=Guess Which County Texts the Heaviest |url=http://www.pcworld.com/article/158700/guess_which_county_texts_the_heaviest.html |work=PCWorld |access-date=8 April 2009 |archive-date=14 January 2012 |archive-url=https://web.archive.org/web/20120114053941/http://www.pcworld.com/article/158700/guess_which_county_texts_the_heaviest.html |url-status=dead }}</ref> Pakistan was amongst the top five | According to the [[PC World]], a total of 6.37 billion text messages were sent through Acision messaging systems across Asia Pacific over the 2008/2009 Christmas and New Year period.<ref>{{cite web |date=1 February 2009 |title=Guess Which County Texts the Heaviest |url=http://www.pcworld.com/article/158700/guess_which_county_texts_the_heaviest.html |work=PCWorld |access-date=8 April 2009 |archive-date=14 January 2012 |archive-url=https://web.archive.org/web/20120114053941/http://www.pcworld.com/article/158700/guess_which_county_texts_the_heaviest.html |url-status=dead }}</ref> Pakistan was amongst the top five rankers with one of the highest SMS traffic with 763 million messages. | ||
3G and 4G | On 14 August 2010, Pakistan became the first country in the world to experience EVDO's RevB 3G technology that offers maximum speeds of 9.3 Mbit/s. | ||
In December 2017, 3G and 4G subscribers in Pakistan reached | |||
3G and 4G were simultaneously launched in Pakistan on 23 April 2014 through a [[spectrum auction|SMRA auction]]. Three out of five companies got a 3G licence i.e. [[Ufone]], [[Mobilink]] and [[Telenor]] while [[China Mobile]]'s [[Zong Pakistan|Zong]] got 3G as well as a 4G licence. Whereas the fifth company, [[Warid Pakistan]] did not participate in the auction procedure, but they launched 4G LTE services on their existing 2G 1800 MHz spectrum due to Technology-neutral terms and became the world's first Telecom Company to transform directly from 2G to 4G. With that, Pakistan joined the 3G and 4G world. | |||
In December 2017, 3G and 4G subscribers in Pakistan reached 46 million.<ref name="HO"/> | |||
After the successful implementation of the Device Identification Registration and Blocking System (DIRBS) in 2019 along with a comprehensive mobile manufacturing policy, it created a favourable environment for mobile device manufacturing in Pakistan. For the first time in the history of Pakistan, local mobile phone manufacturing exceeded the number of mobile phones that were imported in 2021. Mobile device manufacturing licences have been issued to 26 companies, including Samsung, Redmi, Realme, Nokia, [[Oppo phones|Oppo]], TECNO, [[Infinix]], Itel, Vgotel, and Q-Mobile.<ref>{{cite web|title=Local Mobile Manufacturing Surpasses Mobile Phone Import|url=https://www.pta.gov.pk/en/media-center/single-media/local-mobile-manufacturing-surpasses-mobile-phone-import-260821|url-status=live|access-date=14 September 2021|website=PTA|archive-url=https://web.archive.org/web/20210827065002/https://pta.gov.pk/en/media-center/single-media/local-mobile-manufacturing-surpasses-mobile-phone-import-260821 |archive-date=27 August 2021 }}</ref> | |||
{| class="wikitable" | {| class="wikitable" | ||
|+[[Pakistan Telecommunication Authority|PTA]] | |+[[Pakistan Telecommunication Authority|PTA]] reports<ref>{{cite web |title=Annual Reports |url=https://www.pta.gov.pk/category/annual-reports-1432096911-2023-05-30 |access-date=2024-09-17 |publisher=PTA}}</ref><ref>{{cite web |title=telecom Indicators |url=https://www.pta.gov.pk/category/telecom-indicators |access-date=2024-09-17 |website=PTA}}</ref> | ||
!Indicators | !Indicators | ||
!2003 | !2003 | ||
| Line 2,775: | Line 3,125: | ||
!2021 | !2021 | ||
!2022 | !2022 | ||
!2023 | |||
!2024 | |||
|- | |- | ||
|[[ | |[[Teledensity]] | ||
|4.31% | |4.31% | ||
|6.25% | |6.25% | ||
| Line 2,784: | Line 3,136: | ||
|72.4% | |72.4% | ||
|74.1% | |74.1% | ||
| | |75.1% | ||
| | |76.3% | ||
| | |81.7% | ||
| | |84.6% | ||
|81.4% | |||
|80.5% | |||
|- | |- | ||
| | |Telecom subscribers (millions) | ||
|2.4 | |2.4 | ||
|5.0 | |5.0 | ||
| Line 2,797: | Line 3,151: | ||
|139.8 | |139.8 | ||
|151.5 | |151.5 | ||
| | |165.0 | ||
| | |171.1 | ||
| | |186.8 | ||
| | |197.2 | ||
|193.5 | |||
|195.1 | |||
|- | |- | ||
| colspan="4" |[[ | | colspan="4" |[[Broadband]] subscribers (millions) | ||
|0.03 | |0.03 | ||
|0.05 | |0.05 | ||
| Line 2,811: | Line 3,167: | ||
|102.7 | |102.7 | ||
|118.8 | |118.8 | ||
|127.6 | |||
|138.3 | |||
|- | |- | ||
| colspan="4" |Broadband | | colspan="4" |Broadband penetration | ||
|0.0% | |0.0% | ||
|0.0% | |0.0% | ||
|22.7% | |22.7% | ||
|28.1% | |28.1% | ||
| | |32.6% | ||
| | |37.4% | ||
| | |44.9% | ||
|53. | |51.0% | ||
|53.6% | |||
|57.0% | |||
|- | |- | ||
| colspan="6" |Cellular | | colspan="6" |Cellular mobile data usage (petabytes) | ||
|690 | |690 | ||
|1,262 | |1,262 | ||
|2,493 | |2,493 | ||
|4,510 | |4,510 | ||
| 6, | | 6,853 | ||
|8,970 | |8,970 | ||
|10,850 | |||
|13,021 | |||
|- | |- | ||
| colspan="2" |Telecom | | colspan="2" |Telecom revenues (billion PKR) | ||
|118 | |118 | ||
|144 | |144 | ||
| Line 2,837: | Line 3,199: | ||
|528 | |528 | ||
|540 | |540 | ||
| | |604 | ||
| | |595 | ||
| | | 641 | ||
| | |717 | ||
|817 | |||
|955 | |||
|- | |- | ||
|Telecom contribution to exchequer ( | |Telecom contribution to exchequer (billion PKR) | ||
|30.0 | |30.0 | ||
|38 | |38 | ||
|67 | |67 | ||
|77 | |77 | ||
|100 | |100 | ||
| | |161 | ||
| | |163 | ||
| | |111 | ||
| | |286 | ||
| | | 222 | ||
| | |329 | ||
|341 | |||
|335 | |||
|- | |- | ||
| colspan="3" |Total | | colspan="3" |Total telecom investment (million US $) | ||
|1,473 | |1,473 | ||
|1,731 | |1,731 | ||
| Line 2,861: | Line 3,227: | ||
|1,133 | |1,133 | ||
|1,132 | |1,132 | ||
| | |882 | ||
|1, | |1,140 | ||
| 1, | | 1,214 | ||
| | |1,657 | ||
|770 | |||
|765 | |||
|- | |- | ||
| colspan="6" |Mobile (CBU) imports ( | | colspan="6" |Mobile (CBU) imports (million units) | ||
|18.11 | |18.11 | ||
|12.07 | |12.07 | ||
| Line 2,873: | Line 3,241: | ||
|10.26 | |10.26 | ||
|1.53 | |1.53 | ||
|1.58 | |||
|1.71 | |||
|- | |- | ||
| colspan="6" |Local | | colspan="6" |Local assembly / manufacturing (million units) | ||
|1.72 | |1.72 | ||
|5.2 | |5.2 | ||
| Line 2,881: | Line 3,251: | ||
|24.66 | |24.66 | ||
|21.94 | |21.94 | ||
|21.28 | |||
|31.38 | |||
|} | |} | ||
==== Information technology ==== | |||
{{Main|Information technology in Pakistan}} | |||
==== Transportation ==== | ==== Transportation ==== | ||
| Line 2,887: | Line 3,262: | ||
===== Air linkage ===== | ===== Air linkage ===== | ||
The year 1955 marked the inauguration of the Pakistan airline's first scheduled international service – to London, via Cairo and Rome. In 1959, the Government of Pakistan appointed Air Commodore Nur Khan as the managing director of PIA. With his visionary leadership, PIA | {{see also|List of airports in Pakistan|List of airlines of Pakistan}} | ||
[[File:PK Karachi Airport asv2020-01.jpg|thumb|[[Jinnah International Airport]] in [[Karachi]]|195x195px]] | |||
The year 1955 marked the inauguration of the Pakistan airline's first scheduled international service – to London, via Cairo and Rome. In 1959, the Government of Pakistan appointed Air Commodore Nur Khan as the managing director of PIA. With his visionary leadership, PIA 'took off' and within a short span of 6 years, gained the stature and status of one of the world's frontline carriers. In aviation circles, this period has often been referred to as the "golden years of PIA". On 29 April 1964, with a Boeing 720B, PIA earned the distinction of becoming the first airline from a non-communist country to fly into the People's Republic of China. Private sector airlines in Pakistan include [[Airblue]], which serves the main cities within Pakistan in addition to destinations in the [[Persian Gulf]] and [[Manchester]] in the United Kingdom. | |||
{| class="wikitable" | {| class="wikitable" | ||
|+[[Pakistan International Airlines|PIA]] | |+[[Pakistan International Airlines|PIA]] annual reports<ref>{{cite web |title=PIA Annual reports |url=https://www.piac.com.pk/corporate/corporate/corporate-reports |access-date=2025-08-11 |website=PIA}}</ref> | ||
!Indicators | !Indicators | ||
!2003 | !2003 | ||
| Line 2,899: | Line 3,279: | ||
!2021 | !2021 | ||
!2022 | !2022 | ||
!2023 | |||
!2024 | |||
|- | |- | ||
|Route | |Route kilometers | ||
|290,129 | |290,129 | ||
|311,131 | |311,131 | ||
| Line 2,909: | Line 3,291: | ||
|374,054 | |374,054 | ||
|341,821 | |341,821 | ||
|301,832 | |||
|593,063 | |||
|- | |- | ||
|Passengers carried (000) | |Passengers carried (000) | ||
| Line 2,919: | Line 3,303: | ||
|2,657 | |2,657 | ||
|4,281 | |4,281 | ||
|4,496 | |||
|3,904 | |||
|- | |- | ||
|Operating | |Operating revenue (billion PKR) | ||
|47.952 | |47.952 | ||
|88.863 | |88.863 | ||
| Line 2,929: | Line 3,315: | ||
|86.185 | |86.185 | ||
|172.038 | |172.038 | ||
|237.883 | |||
|204.164 | |||
|- | |- | ||
|Operating | |Operating expenses (billion PKR) | ||
|42.574 | |42.574 | ||
|120.499 | |120.499 | ||
| Line 2,939: | Line 3,327: | ||
|101.212 | |101.212 | ||
|183.354 | |183.354 | ||
|233.988 | |||
|194.807 | |||
|- | |- | ||
|Profit+/- | |Profit+/-loss after tax (billion PKR) | ||
| +1.298 | | +1.298 | ||
| -36.138 | | -36.138 | ||
| Line 2,949: | Line 3,339: | ||
| -50.101 | | -50.101 | ||
| -88.008 | | -88.008 | ||
| -104.501 | |||
| +26.204 | |||
|} | |} | ||
===== Railway | ===== Railway linkage ===== | ||
Pakistan Railways (PR) is a major mode of transport in the public sector, contributing to the country's economic growth and providing national integration. 13 May 1861 was a historical day when the first railway line was opened for public between Karachi City and Kotri, a distance of 169 | {{see also|List of railway lines in Pakistan}} | ||
[[File:Pakistan Railway Train.jpg|thumb|A [[Pakistan Railway]] train]] | |||
[[Pakistan Railways]] (PR) is a major mode of transport in the public sector, contributing to the country's economic growth and providing national integration. 13 May 1861 was a historical day when the first railway line was opened for public between Karachi City and Kotri, a distance of 169 km. In 1885, the Sindh, Punjab and Delhi Railways were purchased by the Secretary of State for India. On 1 January 1886 this line and other State Railways were integrated and North Western State Railway was formed; this was later renamed as North Western Railways (NWR). At the time of Independence, the NWR was bifurcated with 1,847 route miles lying in India and 5,048 route miles in Pakistan. In 2022, Pakistan Railways comprised a total of 467 locomotives (462 diesel engines and 05 steam engines) for the 7,479 km route length. Pakistan Railways employed 60,643 people in 2022. | |||
{| class="wikitable" | {| class="wikitable" | ||
|+[[ | |+[[Pakistan Railway]] year books<ref>{{cite web |title=Railway Yearbooks |url=https://www.pakrail.gov.pk/YearBook.aspx |url-status=dead |access-date=24 July 2023 |website=pakrail.gov.pk |archive-date=30 November 2020 |archive-url=https://web.archive.org/web/20201130104716/https://www.pakrail.gov.pk/YearBook.aspx }}</ref> | ||
!Indicators | !Indicators | ||
!2016 | !2016 | ||
| Line 2,963: | Line 3,360: | ||
!2021 | !2021 | ||
!2022 | !2022 | ||
!2023 | |||
!2024 | |||
|- | |- | ||
|Route | |Route kilometers | ||
|7,791 | |7,791 | ||
|7,791 | |7,791 | ||
| Line 2,972: | Line 3,371: | ||
|7,791 | |7,791 | ||
|7,479 | |7,479 | ||
|7,791 | |||
|7,791 | |||
|- | |- | ||
|Track | |Track kilometers | ||
|11,881 | |11,881 | ||
|11,881 | |11,881 | ||
| Line 2,981: | Line 3,382: | ||
|11,881 | |11,881 | ||
|11,492 | |11,492 | ||
|11,881 | |||
|11,881 | |||
|- | |- | ||
|Passengers | |Passengers carried (000) | ||
|52,192 | |52,192 | ||
|52,388 | |52,388 | ||
| Line 2,990: | Line 3,393: | ||
|28,424 | |28,424 | ||
|35,681 | |35,681 | ||
|35,404 | |||
|42,103 | |||
|- | |- | ||
|Goods | |Goods carried (000 tonnes) | ||
|5,001 | |5,001 | ||
|5,630 | |5,630 | ||
| Line 2,999: | Line 3,404: | ||
|8,213 | |8,213 | ||
|8,098 | |8,098 | ||
|5,748 | |||
|7,854 | |||
|- | |- | ||
|Operating | |Operating revenue (billion PKR) | ||
|36. | |36.58 | ||
|40. | |40.06 | ||
|49. | |49.57 | ||
|54. | |54.51 | ||
|47. | |47.58 | ||
|48. | |48.65 | ||
|60. | |60.09 | ||
|63.29 | |||
|88.73 | |||
|- | |- | ||
|Operating | |Operating expenses (billion PKR) | ||
|41. | |41.86 | ||
|50. | |50.07 | ||
|52. | |52.07 | ||
|53. | |53.77 | ||
|59. | |59.29 | ||
|56. | |56.33 | ||
|67. | |67.56 | ||
|72.12 | |||
|88.31 | |||
|- | |- | ||
|Net | |Net loss (billion PKR) | ||
|26. | |26.53 | ||
|40. | |40.79 | ||
|37. | |37.12 | ||
|33. | |33.49 | ||
|50. | |50.27 | ||
|47. | |47.71 | ||
|48. | |48.49 | ||
|47.77 | |||
|53.32 | |||
|} | |} | ||
===== Road | ===== Road linkage ===== | ||
{{see also|List of roads in Pakistan}} | |||
===== Maritime | [[File:Raod to hunza.jpg|thumb|[[Karakoram Highway]]]] | ||
[[Pakistan National Shipping Corporation]] (PNSC) is a | |||
The [[National Highway Authority]] (NHA) was established in 1991 through an Act of Parliament for the planning, development, operation, repair, and maintenance of National Highways and Strategic Roads specially entrusted to NHA by the Federal Government or by a Provincial Government or other authority concerned. NHA is the custodian of 39 national highways, motorways, expressways, and strategic routes, with a total length of 12,131 km, constituting 4.6% of the total national roads network, which is 263,775 km. However, it carries 80% of commercial traffic, and the [[N-5 National Highway]], which is the lifeline of Pakistan, carries 65% of this load in the country. | |||
===== Maritime linkage ===== | |||
{{see also|List of ports in Pakistan}} | |||
[[File:PK Karachi asv2020-02 img47 container port.jpg|thumb|[[Port of Karachi]]]] | |||
[[Pakistan National Shipping Corporation]] (PNSC) is a national flag carrier. It was formed through the merger of the National Shipping Corporation and Pakistan Shipping Corporation in 1979. PNSC has had worldwide operations in the dry bulk segment of the shipping market since its inception, and has been involved in the transportation of liquid cargo since 1998, both locally and internationally. The corporation's head office is located in Karachi. Currently, the PNSC fleet comprises eleven vessels of various types and sizes (five [[bulk carrier]]s, four [[Aframax]] tankers, and two LR-1 Clean Product tankers) with a total deadweight capacity (cargo carrying capacity) of 831,711 metric tons, the highest ever carrying capacity since the inception of PNSC.<ref>{{cite web|title=Segmental Review of Maritime Business Performance|url=https://pnsc.com.pk/financials/2019-2020AnnualReport.pdf?t=1630585246001|url-status=live|access-date=2 September 2021|website=pnsc.com.pk|archive-url=https://web.archive.org/web/20210902125335/https://pnsc.com.pk/financials/2019-2020AnnualReport.pdf?t=1630585246001 |archive-date=2 September 2021 }}</ref> | |||
==== Finance ==== | ==== Finance ==== | ||
{{Main|Banking in Pakistan|Insurance in Pakistan}} | {{Main|Banking in Pakistan|Insurance in Pakistan}} | ||
Pakistan has a large and diverse banking system. In 1974, a nationalization | {{see also|List of banks in Pakistan|Insurance in Pakistan}} | ||
Pakistan has a large and diverse banking system. In 1974, a nationalization programme led to the creation of six government-owned banks.<ref name="VP">{{cite web |title=History of banking in Pakistan – of humble origins and vast potential|date=4 November 2011 |url=https://tribune.com.pk/story/286458/history-of-banking-in-pakistan--of-humble-origins-and-vast-potential/ |access-date=23 October 2018}}</ref> A privatization programme in the 1990s led to the entry of foreign-owned and local banks into the industry.<ref name="VP"/> As of 2010, there were five publicly owned commercial banks in Pakistan, as well as 25 domestic private banks, six multinational banks, and four specialised banks.<ref name="VP"/> | |||
[[File:Karachi Chundrigar skyline.jpg|thumb|A part of [[I. I. Chundrigar Road|Downtown Karachi]], Showing the [[MCB Tower]] and [[Habib Bank Plaza]]. The headquarters of many banks in Pakistan can be found here.]] | |||
Since 2000, Pakistani banks have begun aggressive marketing of consumer finance to the emerging middle class, allowing for a consumption boom (more than a seven-month waiting list for certain car models) as well as a construction bonanza. Pakistan's banking sector remained remarkably strong and resilient during the [[2008 financial crisis]], a feature which has served to attract a substantial amount of FDI in the sector. Stress tests conducted in June 2008 data indicate that the large banks are relatively robust, with the medium and small-sized banks positioning themselves in niche markets. | |||
An article published in Journal of the Asia Pacific Economy by Mete Feridun of University of Greenwich in London with his Pakistani colleague Abdul Jalil presents strong econometric evidence that financial development fosters economic growth in Pakistan.<ref>Jalil, Abdul and Feridun, Mete (2011) Impact of financial development on economic growth: empirical evidence from Pakistan. Journal of the Asia Pacific Economy, 16 (1). pp. 71–80. ISSN 1354-7860 (print), 1469-9648 (online) (doi:10.1080/13547860.2011.539403)</ref> | The [[Pakistan Bureau of Statistics]] provisionally valued this sector at Rs.807,807 million in 2012, thus registering over 510% growth since 2000.<ref>{{Cite web |title=Gross National Product of Pakistan (at current factor cost) |url=https://www.pbs.gov.pk/sites/default/files/national_accounts/tables/table4.pdf |access-date=16 September 2023 |website=pbs.gov.pk}}</ref> | ||
{| class="wikitable" | |||
|+Financial | An article published in the ''Journal of the Asia Pacific Economy'' by Mete Feridun of the University of Greenwich in London with his Pakistani colleague Abdul Jalil presents strong econometric evidence that financial development fosters economic growth in Pakistan.<ref>Jalil, Abdul and Feridun, Mete (2011) Impact of financial development on economic growth: empirical evidence from Pakistan. Journal of the Asia Pacific Economy, 16 (1). pp. 71–80. ISSN 1354-7860 (print), 1469-9648 (online) (doi:10.1080/13547860.2011.539403)</ref> | ||
{| class="wikitable" | |||
|+Financial statements of major banks 2023 (billion PKR)<ref>{{cite web |title=Financial Statement Analysis of Financial Sector |url=https://www.sbp.org.pk/reports/annual/FSAFS/2023-Annual/Complete.pdf |access-date=2024-09-17 |website=SBP}}</ref><ref>{{cite web |title=Consolidated Financial Statements of SBP |url=https://www.sbp.org.pk/reports/annual/aarFY24/AFS-2023-24.pdf |access-date=2024-09-17 |website=SBP}}</ref> | |||
!Bank | !Bank | ||
![[ | ![[Total assets]] | ||
!Revenue | !Revenue | ||
!Profit | !Profit after tax | ||
|- | |- | ||
|[[State Bank of Pakistan | |[[State Bank of Pakistan]] | ||
| | |19,687 | ||
| | |1,218 | ||
| | |1,143.0 | ||
|- | |- | ||
|[[Habib Bank Ltd | |[[Habib Bank Ltd]] | ||
| | |5,202 | ||
| | |277 | ||
| | |56.9 | ||
|- | |- | ||
|[[ | |[[Meezan Bank]] | ||
|3, | |3,012 | ||
| | |249 | ||
| | |84.5 | ||
|- | |- | ||
|[[ | |[[National Bank of Pakistan]] | ||
| | |6,653 | ||
| | |209 | ||
| | |51.8 | ||
|- | |- | ||
|[[MCB Bank|MCB BANK LTD.]] | |[[MCB Bank|MCB BANK LTD.]] | ||
| | |2,427 | ||
| | |181 | ||
| | |59.6 | ||
|- | |- | ||
|[[ | |[[United Bank Limited]] | ||
| | |5,575 | ||
| | |166 | ||
| | |53.2 | ||
|- | |- | ||
|[[Bank | |[[Bank Alfalah]] | ||
| | |3,346 | ||
| | |154 | ||
| | |36.5 | ||
|- | |- | ||
|[[ | |[[Bank AL Habib]] | ||
|2, | |2,741 | ||
| | |147 | ||
| | |35.3 | ||
|- | |- | ||
|[[Bank | |[[Allied Bank Limited]] | ||
| | |2,329 | ||
| | |138 | ||
| | |40.7 | ||
|- | |- | ||
|[[ | |[[Standard Chartered Bank (Pakistan)|Standard Chartered Bank Ltd.]] | ||
|1, | |1,002 | ||
| | |107 | ||
| | |42.6 | ||
|- | |- | ||
|[[ | |[[HabibMetro]] | ||
|1, | |1,556 | ||
| | |87 | ||
| | |24.4 | ||
|} | |} | ||
In recent years, banking through digital channels has been gaining popularity in the country. These channels offer alternatives resulting in faster delivery of financial services to a wide range of customers. Significant progress has been observed in the usage of | |||
In recent years, banking through digital channels has been gaining popularity in the country. These channels offer alternatives resulting in faster delivery of financial services to a wide range of customers. Significant progress has been observed in the usage of internet banking and mobile banking channels during the last few years. In the last five years,{{when|date=March 2025}} internet banking transactions saw compound annualised growth of 31%, whereas mobile banking transactions grew by 86%. | |||
{| class="wikitable" | {| class="wikitable" | ||
|+''' | |+'''Payment system infrastructure'''<ref name="YR">{{cite web |title=Payment Systems Yearly Review |url=https://www.sbp.org.pk/PS/PDF/FiscalYear-2023-24.pdf |access-date=28 September 2023 |website=SBP}}</ref> | ||
|- | |- | ||
! | ! | ||
!FY 2020 | !FY 2020 | ||
!FY 2021 | !FY 2021 | ||
!FY 2022 | !FY 2022 | ||
!FY 2023 | |||
!FY 2024 | |||
|- | |- | ||
| | |Commercial banks + MFBs | ||
| | |44 | ||
|44 | |44 | ||
|44 | |44 | ||
|44 | |44 | ||
|45 | |||
|- | |- | ||
|Bank branches | |Bank branches | ||
|16,067 | |16,067 | ||
|16,308 | |16,308 | ||
|17,031 | |17,031 | ||
|17,693 | |||
|18,450 | |||
|- | |- | ||
|Total | |Total number of ATMs | ||
|15,612 | |15,612 | ||
|16,355 | |16,355 | ||
|17,133 | |17,133 | ||
|17,808 | |||
|18,957 | |||
|- | |- | ||
|Internet | |Internet banking users (000) | ||
|3,983 | |3,983 | ||
|5,239 | |5,239 | ||
|8,370 | |8,370 | ||
|9,637 | |||
|11,996 | |||
|- | |- | ||
|Mobile | |Mobile phone banking users (000) | ||
|8,452 | |8,452 | ||
|10,873 | |10,873 | ||
|12,339 | |12,339 | ||
|16,061 | |||
|18,678 | |||
|- | |- | ||
|POS | |POS machines | ||
|49,067 | |49,067 | ||
|71,907 | |71,907 | ||
|104,865 | |104,865 | ||
|115,288 | |||
|125,593 | |||
|- | |- | ||
| | |Credit cards (million) | ||
| | |1.66 | ||
| | |1.72 | ||
| | |1.80 | ||
| | |2.01 | ||
| | |2.04 | ||
|- | |- | ||
|Debit cards (million) | |||
|26.7 | |||
|29.8 | |||
|34.6 | |||
|39.0 | |||
|48.3 | |||
| | |||
| | |||
| | |||
| | |||
| | |||
|} | |} | ||
{| class="wikitable" | {| class="wikitable" | ||
|+ | |+Payment system statistics<ref name="YR"/> | ||
|- | |- | ||
! colspan="2" | | ! colspan="2" | | ||
!FY 2020 | !FY 2020 | ||
!FY 2021 | !FY 2021 | ||
!FY 2022 | !FY 2022 | ||
!FY 2023 | |||
!FY 2024 | |||
|- | |- | ||
! rowspan="2" |PRISM | ! rowspan="2" |PRISM system* | ||
|Transactions ( | |Transactions (millions) | ||
| | |2.6 | ||
|{{increase}}4.2 | |{{increase}}4.2 | ||
|{{increase}}4.4 | |{{increase}}4.4 | ||
|{{increase}}4.9 | |||
|{{increase}}5.8 | |||
|- | |- | ||
|Amount ( | |Amount (trillion PKR) | ||
| | |394.3 | ||
|{{increase}} | |{{increase}}444.6 | ||
|{{increase}} | |{{increase}}681.6 | ||
|{{decrease}}640.4 | |||
|{{decrease}} | |{{increase}}1,043.1 | ||
|{{increase}} | |||
|- | |- | ||
! rowspan="2" | | ! rowspan="2" |Paper based | ||
|Transactions ( | |Transactions (millions) | ||
| | |598.4 | ||
|{{ | |{{decrease}}582.3 | ||
|{{increase}} | |{{increase}}599.1 | ||
|{{decrease}}574.2 | |||
|{{decrease}}571.2 | |||
|{{ | |||
|{{ | |||
|- | |- | ||
|Amount ( | |Amount (trillion PKR) | ||
| | |185.6 | ||
|{{increase}}218.9 | |||
|{{increase}}295.7 | |||
|{{increase}} | |{{increase}}342.7 | ||
|{{increase}} | |{{increase}}447.7 | ||
|{{increase}} | |||
|{{increase}} | |||
|- | |- | ||
! rowspan="2" | | ! rowspan="2" |Mobile banking | ||
|Transactions ( | |Transactions (millions) | ||
| | |82.8 | ||
|{{increase}} | |{{increase}}193.4 | ||
|{{increase}} | |{{increase}}387.5 | ||
|{{ | |{{increase}}660.6 | ||
|{{ | |{{increase}}1,122.8 | ||
|- | |- | ||
|Amount ( | |Amount (trillion PKR) | ||
| | |1.8 | ||
|{{increase}} | |{{increase}}4.9 | ||
|{{increase}} | |{{increase}}11.8 | ||
|{{increase}}23.8 | |||
|{{increase}}46.3 | |||
|{{increase}} | |||
|{{increase}} | |||
|- | |- | ||
! rowspan="2" | | ! rowspan="2" |E-commerce | ||
|Transactions ( | |Transactions (millions) | ||
| | |10.2 | ||
|{{increase}}21.9 | |||
|{{increase}} | |{{increase}}45.5 | ||
|{{increase}} | |{{decrease}}31.8 | ||
|{{decrease}} | |{{increase}}39.9 | ||
|{{increase}} | |||
|- | |- | ||
|Amount ( | |Amount (billion PKR) | ||
| | |34.9 | ||
|{{increase}} | |{{increase}}60.6 | ||
|{{increase}} | |{{increase}}106.0 | ||
|{{increase}} | |{{increase}}142.0 | ||
|{{increase}}194.3 | |||
|{{increase}} | |||
|} | |} | ||
<nowiki>*</nowiki> [[Real-time gross settlement]] (RTGS) mechanism in Pakistan is named the Pakistan Real-time Interbank Settlement Mechanism (PRISM). | |||
==== Housing ==== | ==== Housing ==== | ||
{{Main|Housing in Pakistan}} | {{Main|Housing in Pakistan}} | ||
{{see also|Real estate in Pakistan}} | |||
[[File:House on Mountains Amazing View of Murree City of Pakistan..jpg|thumb|House on mountains in [[Murree]]]] | |||
The property sector has expanded 23-fold since 2001, particularly in metropolises like Lahore.<ref>[https://news.bbc.co.uk/2/hi/south_asia/5338402.stm Pakistan's post-9/11 economic boom] BBC News, 21 September 2006</ref> Nevertheless, the Karachi Chamber of Commerce and Industry estimated in late 2006 that the overall production of housing units in Pakistan has to be increased to 0.5 million units annually to address 6.1 million backlog of housing in Pakistan for meeting the housing shortfall in next 20 years. The report noted that the present housing stock is also rapidly aging and an estimate suggests that more than 50% of stock is over 50 years old. It is also estimated that 50% of the urban population now lives in slums and squatter settlements. The report said that meeting the backlog in housing, besides replacement of out-lived housing units, is beyond the financial resources of the government. This necessitates putting in place a framework to facilitate financing in the formal private sector and mobilise non-government resources for a market-based housing finance system.<ref>[http://www.brecorder.com/index.php?id=484346&currPageNo=2&query=&search=&term=&supDate= 0.5 million housing units needed annually to meet shortfall: KCCI] {{Webarchive|url=https://web.archive.org/web/20200804125427/https://www.brecorder.com/index.php?id=484346&currPageNo=2&query=&search=&term=&supDate= |date=4 August 2020}} Business Recorder, 7 October 2006</ref> To promote affordable housing and home ownership among low to middle-income group, who currently do not own a house, [[State Bank of Pakistan|SBP]] in 2020 introduced the Government's Mark-Up Subsidy Scheme, through which subsidized financing is provided to individuals for construction or purchase of a new house. Since then, a huge demand for house financing has been witnessed by the commercial banks. | |||
{| class="wikitable" | {| class="wikitable" | ||
|+Outstanding | |+Outstanding loans of consumer financing for house building (billion PKR)<ref name="CL">{{cite web|title=Credit/Loans Classified by Borrowers – Archive|url=https://www.sbp.org.pk/ecodata/CreditLoans-arch.xls|url-status=live|access-date=5 October 2021|website=sbp.org.pk|archive-url=https://web.archive.org/web/20101130004644/http://sbp.org.pk/ecodata/CreditLoans-arch.xls |archive-date=30 November 2010}}</ref> | ||
!Jun 2006 | !Jun 2006 | ||
!Jun 2010 | !Jun 2010 | ||
| Line 3,303: | Line 3,694: | ||
!Jun 2022 | !Jun 2022 | ||
!Jun 2023 | !Jun 2023 | ||
!Jun 2024 | |||
|- | |- | ||
|43.205 | |43.205 | ||
| Line 3,315: | Line 3,707: | ||
|200.765 | |200.765 | ||
|212.315 | |212.315 | ||
|203.580 | |||
|} | |} | ||
| Line 3,320: | Line 3,713: | ||
{{Main|Tourism in Pakistan}} | {{Main|Tourism in Pakistan}} | ||
[[Tourism in Pakistan]] has been | [[Tourism in Pakistan]] has been hailed as the tourism industry's "next big thing". [[Pakistan]], with its diverse cultures, people, and landscapes, has attracted 90 million tourists to the country, almost double that of a decade ago. Currently, Pakistan ranks 130th in the world by tourist income. Due to the threat of terrorism, the number of foreign tourists has gradually declined, and the shock of the [[2013 Nanga Parbat tourist shooting]] has severely adversely affected the tourism industry.<ref>{{cite web |title=Extremism Mars Daughter of Alps | Pakistan Alpine Institute |url=http://www.pakistanalpine.com/articles/expeditions/extremism-mars-daughter-of-alps/ |url-status=dead |archive-url=https://web.archive.org/web/20140102230421/http://www.pakistanalpine.com/articles/expeditions/extremism-mars-daughter-of-alps/ |archive-date=2 January 2014 |access-date=11 January 2014 |publisher=Pakistanalpine.com}}</ref> {{as of|2016}}, tourism has begun to recover in Pakistan, albeit gradually, with a current global rank of 130.<ref>{{Cite web |date=16 November 2016 |title=Pakistan's tourism industry gradually recovering |url=http://www.brecorder.com/pakistan/industries-a-sectors/328271-pakistans-tourism-industry-gradually-recovering.html |url-status=dead |archive-url=https://web.archive.org/web/20161116231710/http://www.brecorder.com/pakistan/industries-a-sectors/328271-pakistans-tourism-industry-gradually-recovering.html |archive-date=16 November 2016 |access-date=6 April 2022 }}</ref> | ||
== Science and technology == | |||
{{Main|Science and technology in Pakistan}} | |||
== Labour == | |||
{{Main|Labour in Pakistan}} | |||
== Foreign trade, remittances, aid, and investment == | == Foreign trade, remittances, aid, and investment == | ||
=== Investment === | === Investment === | ||
Foreign investment | Foreign investment significantly declined by 2010, dropping by 54.6% due to Pakistan's political instability and weak law and order, according to the Bank of Pakistan.<ref>{{cite web |access-date=1 November 2010 |date=15 February 2010 |publisher=Malick, Sajid Ibrahim |title=Significant Decline In Foreign Investment To Pakistan |url=http://ibrahimsajidmalick.com/significant-decline-in-foreign-investment-to-pakistan/1207/ |url-status=dead |archive-url=https://web.archive.org/web/20100911194131/http://ibrahimsajidmalick.com/significant-decline-in-foreign-investment-to-pakistan/1207/ |archive-date=11 September 2010 }}</ref> | ||
Business regulations have been overhauled along liberal lines, especially since 1999. Most barriers to the flow of capital and international direct investment have been removed. Foreign investors do not face any restrictions on the inflow of capital, and investment of up to 100% of equity participation is allowed in most sectors. Unlimited remittance of profits, dividends, service fees or capital is now the rule. However, doing business has been becoming increasingly difficult over the past decade due to political instability, rising domestic insurgency and insecurity and vehement corruption. This can be confirmed by the [[World Bank]]'s [[Ease of Doing Business Index]] report degrading its ratings for Pakistan each year since September 2009. | Business regulations have been overhauled along liberal lines, especially since 1999. Most barriers to the flow of capital and international direct investment have been removed. Foreign investors do not face any restrictions on the inflow of capital, and investment of up to 100% of equity participation is allowed in most sectors. Unlimited remittance of profits, dividends, service fees or capital is now the rule. However, doing business has been becoming increasingly difficult over the past decade due to political instability, rising domestic insurgency and insecurity and vehement corruption. This can be confirmed by the [[World Bank]]'s [[Ease of Doing Business Index]] report degrading its ratings for Pakistan each year since September 2009. | ||
| Line 3,331: | Line 3,730: | ||
The World Bank (WB) and [[International Finance Corporation]]'s flagship report [[Ease of Doing Business Index]] 2020 ranked Pakistan 108 among 190 countries around the globe, indicating a continuous improvement and taking a jump from 136 last year. The top five countries were [[New Zealand]], [[Singapore]], [[Denmark]], [[Hong Kong]] and [[South Korea]].<ref>{{cite web |title=Doing Business 2019 – 17th edition |url=https://www.doingbusiness.org/content/dam/doingBusiness/country/p/pakistan/PAK-LITE.pdf |access-date=29 February 2020 |website=doingbusiness.org}}</ref> | The World Bank (WB) and [[International Finance Corporation]]'s flagship report [[Ease of Doing Business Index]] 2020 ranked Pakistan 108 among 190 countries around the globe, indicating a continuous improvement and taking a jump from 136 last year. The top five countries were [[New Zealand]], [[Singapore]], [[Denmark]], [[Hong Kong]] and [[South Korea]].<ref>{{cite web |title=Doing Business 2019 – 17th edition |url=https://www.doingbusiness.org/content/dam/doingBusiness/country/p/pakistan/PAK-LITE.pdf |access-date=29 February 2020 |website=doingbusiness.org}}</ref> | ||
With improvement in ease of doing business ranking and giving an investment friendly road map from government, many new auto sector giants like France's Renault, South Korean's Hyundai and Kia, | With improvement in ease of doing business ranking and giving an investment friendly road map from government, many new auto sector giants like France's Renault, South Korean's Hyundai and Kia, Chinese JW Forland and German auto giant Volkswagen are considering entry into Pakistan auto market through joint ventures with local manufacturers like Dewan Farooque Motors, Khalid Mushtaq Motors and United Motors.<ref>{{cite web |date=7 January 2018 |title=New auto players to invest over $800m in Pakistan |url=https://tribune.com.pk/story/1602551/2-new-auto-players-invest-800m-pakistan/ |access-date=3 January 2019 |website=tribune.com.pk}}</ref> As of March 2022, only the Hyundai Nishat JV materialised. | ||
US oil and gas giant Exxon Mobil | US oil and gas giant Exxon Mobil returned to Pakistan after nearly three decades gap and has acquired 25% shares in offshore drilling in May 2018, with initial survey showing a potential of huge hydrocarbon reserves discovery offshore.<ref>{{cite web |date=26 November 2018 |title=ExxonMobil set for comeback in Pakistan after nearly three decades: Report |url=https://profit.pakistantoday.com.pk/2018/11/26/exxonmobil-set-for-comeback-in-pakistan-after-nearly-three-decades-report/ |access-date=3 January 2019 |website=profit.pakistantoday.com.pk}}</ref> | ||
To boost Pakistan's unstable foreign-exchange reserves, Qatar announced to invest $3 billion the form of deposits and direct investments in the country.<ref>{{cite news |date=24 June 2019 |title=Qatar will invest $3 billion in Pakistan, state news agency says |work=Reuters |url=https://www.reuters.com/article/us-qatar-pakistan/qatar-will-invest-3-billion-in-pakistan-state-news-agency-says-idUSKCN1TP0T1 |access-date=24 June 2019}}</ref> By the end of June 2019, Qatar sent the first $500 million to Pakistan.<ref>{{cite news |date=29 June 2019 |title=Qatar Sends First Tranche of $3 Billion Payment to Pakistan |work=Bloomberg |url=https://www.bloomberg.com/news/articles/2019-06-29/qatar-is-said-to-send-first-tranche-of-3-billion-to-pakistan |access-date=29 June 2019}}</ref><ref>{{cite web |title=Qatar sends $500 million payment to Pakistan |url=https://www.pakistantoday.com.pk/2019/06/30/qatar-sends-500-million-payment-to-pakistan/ |access-date=30 June 2019 |work=Pakistan Today}}</ref> | To boost Pakistan's unstable foreign-exchange reserves, Qatar announced to invest $3 billion in the form of deposits and direct investments in the country.<ref>{{cite news |date=24 June 2019 |title=Qatar will invest $3 billion in Pakistan, state news agency says |work=Reuters |url=https://www.reuters.com/article/us-qatar-pakistan/qatar-will-invest-3-billion-in-pakistan-state-news-agency-says-idUSKCN1TP0T1 |access-date=24 June 2019}}</ref> By the end of June 2019, Qatar sent the first $500 million to Pakistan.<ref>{{cite news |date=29 June 2019 |title=Qatar Sends First Tranche of $3 Billion Payment to Pakistan |work=Bloomberg |url=https://www.bloomberg.com/news/articles/2019-06-29/qatar-is-said-to-send-first-tranche-of-3-billion-to-pakistan |access-date=29 June 2019}}</ref><ref>{{cite web |title=Qatar sends $500 million payment to Pakistan |url=https://www.pakistantoday.com.pk/2019/06/30/qatar-sends-500-million-payment-to-pakistan/ |access-date=30 June 2019 |work=Pakistan Today}}</ref> | ||
Data is from SBP.<ref>{{cite web |title=Summary of Foreign Investment in Pakistan |url=https://www.sbp.org.pk/ecodata/NetinflowSummary.pdf |access-date=2024-09-17 |website=sbp.org.pk}}</ref><ref>{{cite web|title=Monthly Position Inflow, Outflow and Net basis|url=http://www.sbp.org.pk/ecodata/FIS-FDI-Arch.xls|access-date=15 May 2020|website=SBP}}</ref> | |||
{| class="wikitable" | {| class="wikitable" | ||
|+Amounts are in million US$ | |+Amounts are in million US$. | ||
|- | |- | ||
! List | ! List | ||
| Line 3,357: | Line 3,757: | ||
! FY 2021 | ! FY 2021 | ||
!FY 2022 | !FY 2022 | ||
!FY 2023 | |||
!FY 2024 | |||
|- | |- | ||
|Foreign | |Foreign direct investment | ||
| style="text-align:center" |{{increase}} 5,410 | | style="text-align:center" |{{increase}} 5,410 | ||
| style="text-align:center" |{{decrease}} 3,720 | | style="text-align:center" |{{decrease}} 3,720 | ||
| Line 3,373: | Line 3,775: | ||
| style="text-align:center" | {{increase}}2,598 | | style="text-align:center" | {{increase}}2,598 | ||
| style="text-align:center" | {{decrease}}1,821 | | style="text-align:center" | {{decrease}}1,821 | ||
| style="text-align:center" |{{increase}}1, | | style="text-align:center" |{{increase}}1,936 | ||
|{{decrease}}1,627 | |||
|{{increase}}1,902 | |||
|} | |} | ||
| Line 3,385: | Line 3,789: | ||
* PTCL by [[Etisalat]] for $1.8 billion | * PTCL by [[Etisalat]] for $1.8 billion | ||
* Additional 57.6% shares of Lakson Tobacco Company acquired by [[Philip Morris International]] for $382 million | * Additional 57.6% shares of Lakson Tobacco Company acquired by [[Philip Morris International]] for $382 million | ||
* In 2016, [[Arçelik]] acquired [[Dawlance]] for $243 million.<ref>{{cite news|last1=Nafees|first1=Shahab|title=Turkish company acquires Dawlance for $243m|url=http://www.dawn.com/news/1296569|access-date=3 January 2017|work=[[Dawn (newspaper)| | * In 2016, [[Arçelik]] acquired [[Dawlance]] for $243 million.<ref>{{cite news|last1=Nafees|first1=Shahab|title=Turkish company acquires Dawlance for $243m|url=http://www.dawn.com/news/1296569|access-date=3 January 2017|work=[[Dawn (newspaper)|Dawn News]] | date=16 November 2016}}</ref> | ||
* In 2016, [[FrieslandCampina]] acquired 51% stake in [[Engro Foods]] for $446.81 million.<ref>{{cite news|last1=Siddiqui|first1=Salman|title=Dutch company acquires Engro Foods for $446.81m|url=http://tribune.com.pk/story/1268342/foreign-direct-investment-dutch-company-acquires-engro-foods-446-81m/|access-date=3 January 2017|newspaper=[[Express Tribune]] | date=20 December 2016}}</ref> | * In 2016, [[FrieslandCampina]] acquired 51% stake in [[Engro Foods]] for $446.81 million.<ref>{{cite news|last1=Siddiqui|first1=Salman|title=Dutch company acquires Engro Foods for $446.81m|url=http://tribune.com.pk/story/1268342/foreign-direct-investment-dutch-company-acquires-engro-foods-446-81m/|access-date=3 January 2017|newspaper=[[Express Tribune]] | date=20 December 2016}}</ref> | ||
* In 2016, [[The Abraaj Group]] sold its 66.4% stake in [[K-Electric]] to [[Shanghai Electric]] for $1.77 billion.<ref>{{cite news|last1=Crofts|first1=Dale|title=Shanghai Electric to Pay $1.8 Billion for Stake in K-Electric|url=https://www.bloomberg.com/news/articles/2016-10-30/abraaj-to-sell-stake-in-pakistani-utility-for-1-77-billion|access-date=3 January 2017|publisher=[[Bloomberg L.P.]] | date=31 October 2016}}</ref> | * In 2016, [[The Abraaj Group]] sold its 66.4% stake in [[K-Electric]] to [[Shanghai Electric]] for $1.77 billion.<ref>{{cite news|last1=Crofts|first1=Dale|title=Shanghai Electric to Pay $1.8 Billion for Stake in K-Electric|url=https://www.bloomberg.com/news/articles/2016-10-30/abraaj-to-sell-stake-in-pakistani-utility-for-1-77-billion|access-date=3 January 2017|publisher=[[Bloomberg L.P.]] | date=31 October 2016}}</ref> | ||
The foreign exchange receipts from these sales are also helping cover the current account deficit.<ref>{{cite web|url=http://www.dawn.com/2007/07/09/ebr1.htm|title=Rising foreign stakes in local companies |author=Mohiuddin Aazim |date=9 July 2007 |work= | The foreign exchange receipts from these sales are also helping cover the current account deficit.<ref>{{cite web|url=http://www.dawn.com/2007/07/09/ebr1.htm|title=Rising foreign stakes in local companies |author=Mohiuddin Aazim |date=9 July 2007 |work=Dawn News |access-date=25 May 2019}}</ref> | ||
=== Foreign trade === | === Foreign trade === | ||
{{Main|Foreign trade of Pakistan}} | {{Main|Foreign trade of Pakistan}} | ||
Pakistan witnessed the highest export of US$25.4 billion in the FY | {{see also|List of tariffs in Pakistan|Category:Foreign trade of Pakistan}} | ||
[[File:Gwader port, Pakistan.jpg|thumb|[[Gwadar Port|Gwader port]] in [[Balochistan, Pakistan|Balochistan]]]] | |||
Pakistan witnessed the highest export of US$25.4 billion in the FY 2011. However, in subsequent years exports have declined considerably. This decline started from the financial year 2015 when an international commodity slump set in. This was compounded by structural supply-side constraints including energy shortages, high input costs, and an overvalued exchange rate. From the financial year 2014 to 2016, exports declined by 12.4 percent. The exports growth trend over this period was similar to the world trade growth patterns. Pakistan's external sector continued facing stress during 2017. Still, Pakistan's merchandise trade exports grew by 0.1 percent during the fiscal year 2017. The imports continued to grow at a much faster rate and grew by a large percentage of 18.0 during the FY 2017 as compared to the previous year.<ref name="WR">{{cite web|title=Workers' Remittances|url=https://www.sbp.org.pk/reports/stat_reviews/Bulletin/2021/Aug/External%20Sector.pdf|url-status=live|access-date=28 August 2021|archive-url=https://web.archive.org/web/20210828092900/https://www.sbp.org.pk/reports/stat_reviews/Bulletin/2021/Aug/External%20Sector.pdf |archive-date=28 August 2021}}</ref> | |||
Note: This is the trade data (export and import) as released by the [[State Bank of Pakistan|SBP]].<ref>{{cite web |title=Exports and Imports of Goods & Services |url=https://www.sbp.org.pk/ecodata/ExportsImports-Goods-Arch.xls |access-date=23 July 2023 |website=sbp.org.pk}}</ref><ref>{{Cite web |title=Exports and Imports of Goods & Services |url=https://www.sbp.org.pk/ecodata/ExportsImports-Goods.pdf |access-date=2025-08-12 |website=www.sbp.org.pk/}}</ref> This may differ from the data compiled by [[Pakistan Bureau of Statistics]]. | |||
{| class="wikitable" | {| class="wikitable" | ||
|+Amounts in billion US dollars | |+Amounts in billion US dollars | ||
| Line 3,417: | Line 3,824: | ||
! FY 2022 | ! FY 2022 | ||
! FY 2023 | ! FY 2023 | ||
! FY 2024 | |||
!FY 2025 | |||
|- | |- | ||
| style="text-align:left" | | style="text-align:left" |'''Total exports''' | ||
| style="text-align:center" |{{increase}} 24.01 | | style="text-align:center" |{{increase}} 24.01 | ||
| style="text-align:center" |{{decrease}} 23.21 | | style="text-align:center" |{{decrease}} 23.21 | ||
| Line 3,434: | Line 3,843: | ||
| style="text-align:center" |{{increase}} 31.58 | | style="text-align:center" |{{increase}} 31.58 | ||
| style="text-align:center" |{{increase}} 39.60 | | style="text-align:center" |{{increase}} 39.60 | ||
| style="text-align:center" |{{decrease}} 35. | | style="text-align:center" |{{decrease}} 35.47 | ||
| style="text-align:center" |{{increase}}38.67 | |||
|{{increase}}40.69 | |||
|- | |- | ||
| style="text-align:right" | | style="text-align:right" |Goods | ||
| style="text-align:center" |{{increase}} 20.45 | | style="text-align:center" |{{increase}} 20.45 | ||
| style="text-align:center" |{{decrease}} 19.13 | | style="text-align:center" |{{decrease}} 19.13 | ||
| Line 3,452: | Line 3,863: | ||
| style="text-align:center" |{{increase}} 25.64 | | style="text-align:center" |{{increase}} 25.64 | ||
| style="text-align:center" |{{increase}} 32.49 | | style="text-align:center" |{{increase}} 32.49 | ||
| style="text-align:center" |{{decrease}} 27. | | style="text-align:center" |{{decrease}} 27.88 | ||
| style="text-align:center" |{{increase}}30.98 | |||
|{{increase}}32.30 | |||
|- | |- | ||
| style="text-align:right" | | style="text-align:right" | Services | ||
| style="text-align:center" |{{decrease}} 3.56 | | style="text-align:center" |{{decrease}} 3.56 | ||
| style="text-align:center" |{{increase}} 4.09 | | style="text-align:center" |{{increase}} 4.09 | ||
| Line 3,470: | Line 3,883: | ||
| style="text-align:center" |{{increase}} 5.95 | | style="text-align:center" |{{increase}} 5.95 | ||
| style="text-align:center" |{{increase}} 7.10 | | style="text-align:center" |{{increase}} 7.10 | ||
| style="text-align:center" |{{increase}} 7. | | style="text-align:center" |{{increase}} 7.60 | ||
| style="text-align:center" |{{increase}}7.69 | |||
|{{increase}}8.39 | |||
|- | |- | ||
| style="text-align:left" | | style="text-align:left" |'''Total imports''' | ||
| style="text-align:center" |{{increase}} 45.44 | | style="text-align:center" |{{increase}} 45.44 | ||
| style="text-align:center" |{{decrease}} 39.22 | | style="text-align:center" |{{decrease}} 39.22 | ||
| Line 3,488: | Line 3,903: | ||
| style="text-align:center" |{{increase}} 62.73 | | style="text-align:center" |{{increase}} 62.73 | ||
| style="text-align:center" |{{increase}} 84.49 | | style="text-align:center" |{{increase}} 84.49 | ||
| style="text-align:center" |{{decrease}} | | style="text-align:center" |{{decrease}} 61.33 | ||
| style="text-align:center" |{{increase}}63.96 | |||
|{{increase}}70.09 | |||
|- | |- | ||
| style="text-align:right" | | style="text-align:right" |Goods | ||
| style="text-align:center" |{{increase}} 35.28 | | style="text-align:center" |{{increase}} 35.28 | ||
| style="text-align:center" |{{decrease}} 31.67 | | style="text-align:center" |{{decrease}} 31.67 | ||
| Line 3,506: | Line 3,923: | ||
| style="text-align:center" |{{increase}} 54.27 | | style="text-align:center" |{{increase}} 54.27 | ||
| style="text-align:center" |{{increase}} 71.54 | | style="text-align:center" |{{increase}} 71.54 | ||
| style="text-align:center" |{{decrease}} | | style="text-align:center" |{{decrease}} 52.70 | ||
| style="text-align:center" |{{increase}}53.16 | |||
|{{increase}}59.08 | |||
|- | |- | ||
| style="text-align:right" |Services | | style="text-align:right" |Services | ||
| Line 3,524: | Line 3,943: | ||
| style="text-align:center" |{{decrease}} 8.46 | | style="text-align:center" |{{decrease}} 8.46 | ||
| style="text-align:center" |{{increase}} 12.94 | | style="text-align:center" |{{increase}} 12.94 | ||
| style="text-align:center" |{{decrease}} 8. | | style="text-align:center" |{{decrease}} 8.64 | ||
| style="text-align:center" |{{increase}}10.80 | |||
|{{increase}}11.01 | |||
|- | |- | ||
| style="text-align:left" | | style="text-align:left" |'''Trade deficit''' | ||
| style="text-align:center" |{{IncreaseNegative}} 21.43 | | style="text-align:center" |{{IncreaseNegative}} 21.43 | ||
| style="text-align:center" |{{DecreasePositive}} 16.01 | | style="text-align:center" |{{DecreasePositive}} 16.01 | ||
| Line 3,542: | Line 3,963: | ||
| style="text-align:center" |{{IncreaseNegative}} 31.15 | | style="text-align:center" |{{IncreaseNegative}} 31.15 | ||
| style="text-align:center" |{{IncreaseNegative}} 44.89 | | style="text-align:center" |{{IncreaseNegative}} 44.89 | ||
| style="text-align:center" |{{DecreasePositive}} | | style="text-align:center" |{{DecreasePositive}} 25.86 | ||
| style="text-align:center" |{{DecreasePositive}}25.29 | |||
|{{IncreaseNegative}}29.40 | |||
|} | |} | ||
Pakistan's imports are showing rising trend at a relatively faster rate due to | Pakistan's imports are showing a rising trend at a relatively faster rate due to increased economic activity as part of the [[China Pakistan Economic Corridor]] (CPEC), particularly in the energy sector. The construction projects under CPEC require heavy machinery that has to be imported. It is also observed that the economy is currently being led both by investments as well as consumption, resulting in relatively higher levels of imports. During FY 2018, Pakistan's exports picked up and reached US$24.8 billion, showing a growth of 12.6 percent over the previous year, FY 2017. Imports, on the other hand, also increased by 16.2 percent, reaching the highest figure of US$56.6 billion. As a result, the trade deficit widened to US$31.8 billion, which was the highest in the last ten years. Pakistan's exports of goods recorded their highest level of $25.6 billion during the fiscal year 2021, higher than the $25.3 billion recorded in 2011. | ||
==== Exports ==== | ==== Exports ==== | ||
Pakistan's major export commodities since fiscal year 2014 are listed in the table below.<ref>{{cite web | |||
Pakistan's major export commodities since fiscal year 2014 are listed in the table below.<ref>{{cite web |title=Export Receipts by Commodities and Groups |url=https://easydata.sbp.org.pk/apex/f?p=10:1:15275074736074::::: |access-date=2024-09-18 |website=SBPx}}</ref> | |||
{| class="wikitable" | {| class="wikitable" | ||
|+'''Amounts are in | |+'''Amounts are in million US$.''' | ||
! style="width:200px;"| Commodities | ! style="width:200px;"| Commodities | ||
! style="width:200px;"| FY 2015 | ! style="width:200px;"| FY 2015 | ||
! style="width:200px;"| FY 2016 | ! style="width:200px;"| FY 2016 | ||
| Line 3,562: | Line 3,985: | ||
! style="width:200px;"| FY 2021 | ! style="width:200px;"| FY 2021 | ||
! style="width:200px;"| FY 2022 | ! style="width:200px;"| FY 2022 | ||
! style="width:200px;"| FY 2023 | |||
! style="width:200px;"| FY 2024 | |||
|- | |- | ||
! [[Knitwear]] | ! [[Knitwear]] | ||
| style="text-align:center" |{{Increase}} 2,264 | | style="text-align:center" |{{Increase}} 2,264 | ||
| style="text-align:center" |{{Increase}} 2,309 | | style="text-align:center" |{{Increase}} 2,309 | ||
| Line 3,573: | Line 3,997: | ||
| style="text-align:center" |{{Increase}} 3,372 | | style="text-align:center" |{{Increase}} 3,372 | ||
| style="text-align:center" |{{Increase}} 4,516 | | style="text-align:center" |{{Increase}} 4,516 | ||
| style="text-align:center" |{{Increase}} 4,244 | |||
| style="text-align:center" |{{Decrease}}4,018 | |||
|- | |- | ||
! [[Ready-made garment]]s | ! [[Ready-made garment]]s | ||
| style="text-align:center" |{{Increase}}2,044 | | style="text-align:center" |{{Increase}}2,044 | ||
| style="text-align:center" |{{Increase}}2,156 | | style="text-align:center" |{{Increase}}2,156 | ||
| Line 3,584: | Line 4,009: | ||
| style="text-align:center" |{{Increase}} 2,820 | | style="text-align:center" |{{Increase}} 2,820 | ||
| style="text-align:center" |{{Increase}} 3,698 | | style="text-align:center" |{{Increase}} 3,698 | ||
| style="text-align:center" |{{Decrease}}3,496 | |||
| style="text-align:center" |{{Decrease}}3,471 | |||
|- | |- | ||
! Bed wear | ! Bed wear | ||
| style="text-align:center" |{{Increase}}2,207 | | style="text-align:center" |{{Increase}}2,207 | ||
| style="text-align:center" |{{Decrease}}2,126 | | style="text-align:center" |{{Decrease}}2,126 | ||
| Line 3,595: | Line 4,021: | ||
| style="text-align:center" |{{Increase}} 2,691 | | style="text-align:center" |{{Increase}} 2,691 | ||
| style="text-align:center" |{{Increase}} 3,255 | | style="text-align:center" |{{Increase}} 3,255 | ||
| style="text-align:center" |{{Decrease}}2,804 | |||
| style="text-align:center" |{{Decrease}}2,790 | |||
|- | |- | ||
! [[Rice]] | ! [[Rice]] | ||
| style="text-align:center" |{{Decrease}}2,038 | | style="text-align:center" |{{Decrease}}2,038 | ||
| style="text-align:center" |{{Decrease}}1,853 | | style="text-align:center" |{{Decrease}}1,853 | ||
| Line 3,606: | Line 4,033: | ||
| style="text-align:center" |{{Decrease}} 2,211 | | style="text-align:center" |{{Decrease}} 2,211 | ||
| style="text-align:center" |{{Increase}} 2,760 | | style="text-align:center" |{{Increase}} 2,760 | ||
| style="text-align:center" |{{Decrease}}2,109 | |||
| style="text-align:center" |{{Increase}} 3,684 | |||
|- | |- | ||
! Cotton cloth | ! Cotton cloth | ||
| style="text-align:center" |{{Decrease}}2,487 | | style="text-align:center" |{{Decrease}}2,487 | ||
| style="text-align:center" |{{Decrease}}2,332 | | style="text-align:center" |{{Decrease}}2,332 | ||
| Line 3,617: | Line 4,045: | ||
| style="text-align:center" |{{Decrease}} 1,884 | | style="text-align:center" |{{Decrease}} 1,884 | ||
| style="text-align:center" |{{Increase}} 2,338 | | style="text-align:center" |{{Increase}} 2,338 | ||
| style="text-align:center" |{{Decrease}}2,155 | |||
| style="text-align:center" |{{Decrease}}1,898 | |||
|- | |- | ||
! [[Chemical]] and [[pharmaceutical]] | ! [[Chemical]] and [[pharmaceutical]] | ||
| style="text-align:center" |{{Increase}}1,250 | | style="text-align:center" |{{Increase}}1,250 | ||
| style="text-align:center" |{{Decrease}}1,052 | | style="text-align:center" |{{Decrease}}1,052 | ||
| Line 3,628: | Line 4,057: | ||
| style="text-align:center" |{{Increase}} 1,147 | | style="text-align:center" |{{Increase}} 1,147 | ||
| style="text-align:center" |{{Increase}} 1,482 | | style="text-align:center" |{{Increase}} 1,482 | ||
| style="text-align:center" |{{Decrease}} 1,429 | |||
| style="text-align:center" |{{Decrease}}1,420 | |||
|- | |- | ||
! [[ | ! [[Cotton yarn]] | ||
| style="text-align:center" |{{Decrease}}1,818 | | style="text-align:center" |{{Decrease}}1,818 | ||
| style="text-align:center" |{{Decrease}}1,266 | | style="text-align:center" |{{Decrease}}1,266 | ||
| Line 3,639: | Line 4,069: | ||
| style="text-align:center" |{{Decrease}} 921 | | style="text-align:center" |{{Decrease}} 921 | ||
| style="text-align:center" |{{Increase}} 1,200 | | style="text-align:center" |{{Increase}} 1,200 | ||
| style="text-align:center" |{{Decrease}} 870 | |||
| style="text-align:center" |{{Increase}}1,052 | |||
|- | |- | ||
![[Towel]]s | ![[Towel]]s | ||
| style="text-align:center" |{{Decrease}}716 | | style="text-align:center" |{{Decrease}}716 | ||
| style="text-align:center" |{{Increase}}721 | | style="text-align:center" |{{Increase}}721 | ||
| Line 3,650: | Line 4,081: | ||
| style="text-align:center" |{{Increase}} 882 | | style="text-align:center" |{{Increase}} 882 | ||
| style="text-align:center" |{{Increase}} 1,080 | | style="text-align:center" |{{Increase}} 1,080 | ||
| style="text-align:center" |{{Decrease}} 931 | |||
| style="text-align:center" |{{Increase}} 954 | |||
|- | |- | ||
!Leather manufactures | !Leather manufactures | ||
| style="text-align:center" |{{Increase}}547 | | style="text-align:center" |{{Increase}}547 | ||
| style="text-align:center" |{{Decrease}}488 | | style="text-align:center" |{{Decrease}}488 | ||
| Line 3,661: | Line 4,093: | ||
| style="text-align:center" |{{Increase}} 560 | | style="text-align:center" |{{Increase}} 560 | ||
| style="text-align:center" |{{Increase}} 649 | | style="text-align:center" |{{Increase}} 649 | ||
| style="text-align:center" |{{Decrease}} 628 | |||
| style="text-align:center" |{{Decrease}} 606 | |||
|- | |- | ||
![[ | ![[Sports goods]] | ||
| style="text-align:center" |{{Decrease}}585 | | style="text-align:center" |{{Decrease}}585 | ||
| style="text-align:center" |{{Decrease}}539 | | style="text-align:center" |{{Decrease}}539 | ||
| Line 3,672: | Line 4,105: | ||
| style="text-align:center" |{{Increase}} 471 | | style="text-align:center" |{{Increase}} 471 | ||
| style="text-align:center" |{{Increase}} 507 | | style="text-align:center" |{{Increase}} 507 | ||
| style="text-align:center" |{{Decrease}} 460 | |||
| style="text-align:center" |{{Decrease}} 439 | |||
|- | |- | ||
!Surgical goods & medical instruments | !Surgical goods & medical instruments | ||
| style="text-align:center" |{{Increase}}401 | | style="text-align:center" |{{Increase}}401 | ||
| style="text-align:center" |{{Increase}}424 | | style="text-align:center" |{{Increase}}424 | ||
| Line 3,683: | Line 4,117: | ||
| style="text-align:center" |{{Increase}} 480 | | style="text-align:center" |{{Increase}} 480 | ||
| style="text-align:center" |{{Decrease}} 475 | | style="text-align:center" |{{Decrease}} 475 | ||
| style="text-align:center" |{{Decrease}} 454 | |||
| style="text-align:center" |{{Increase}} 456 | |||
|} | |} | ||
==== Imports ==== | ==== Imports ==== | ||
Pakistan's major import commodities since fiscal year 2014 are listed in the table below.<ref>{{cite web | |||
Pakistan's major import commodities since fiscal year 2014 are listed in the table below.<ref>{{cite web|title=Imports Payments by Commodity and Groups|url=https://www.sbp.org.pk/ecodata/Import_Payments_by_Commodities_and_Groups.pdf|url-status=live|access-date=21 July 2021|website=SBP|archive-url=https://web.archive.org/web/20210715132408/https://www.sbp.org.pk/ecodata/Import_Payments_by_Commodities_and_Groups.pdf |archive-date=15 July 2021 }}</ref><ref>{{cite web|title=Imports Payments by Commodity|url=https://www.sbp.org.pk/ecodata/Import_Payments_by_Commodities_and_Groups_Arch.xls|url-status=live|access-date=27 May 2021|website=SBP|archive-url=https://web.archive.org/web/20210712053554/https://www.sbp.org.pk/ecodata/Import_Payments_by_Commodities_and_Groups_Arch.xls |archive-date=12 July 2021 }}</ref> | |||
{| class="wikitable" | {| class="wikitable" | ||
|+'''Amounts are in | |+'''Amounts are in million US$'''. | ||
! style="width:200px;"| Commodities | ! style="width:200px;"| Commodities | ||
! style="width:200px;"| FY 2014 | ! style="width:200px;"| FY 2014 | ||
| Line 3,789: | Line 4,226: | ||
| style="text-align:center" |{{Increase}} 2,283 | | style="text-align:center" |{{Increase}} 2,283 | ||
|- | |- | ||
! [[ | ! [[Telecommunications|Telecom]] | ||
| style="text-align:center" |1,217 | | style="text-align:center" |1,217 | ||
| style="text-align:center" |{{Increase}} 1,225 | | style="text-align:center" |{{Increase}} 1,225 | ||
| Line 3,811: | Line 4,248: | ||
| style="text-align:center" |{{Increase}} 1,817 | | style="text-align:center" |{{Increase}} 1,817 | ||
|- | |- | ||
!Textile | !Textile machinery | ||
| style="text-align:center" |658 | | style="text-align:center" |658 | ||
| style="text-align:center" |{{Decrease}} 492 | | style="text-align:center" |{{Decrease}} 492 | ||
| Line 3,835: | Line 4,272: | ||
=== External imbalances === | === External imbalances === | ||
{{Main|National debt of Pakistan}} | |||
{{See also|Pakistan and the International Monetary Fund}} | {{See also|Pakistan and the International Monetary Fund}} | ||
During FY 2017, the increase in imports of capital equipment and fuel significantly put pressure on the external account. A reversal in global oil prices led to an increase in POL imports, accompanied by falling exports; as a result, the merchandise [[trade deficit]] grew by 39.4 percent to US$26.885 billion in FY 2017. While [[remittances]] and Coalition Support Fund inflows both declined slightly over the same period last year, however, the impact was offset by an improvement in the income account, mainly due to lower profit repatriations by oil and gas firms.<ref name="TP">{{Cite web |title=Trade and Payments |url=http://www.finance.gov.pk/survey/chapters_17/08-Trade.pdf |access-date=16 September 2023 |website=finance.gov.pk}}</ref> | |||
The [[current account deficit]] increased to US$19.2 billion in FY 2018.<ref name="BP"/> | |||
However, the impact of high current deficit on [[foreign exchange reserves]] was not severe, as financial inflows were available to the country to partially offset the gap; these inflows helped ensure stability in the exchange rate. Net [[Foreign direct investment|FDI]] grew by 12.4 percent and reached US$1.6 billion in the nine-month period, whereas net FPI saw an inflow of US$631 million, against an outflow of US$393 million last year. Encouragingly for the country, the period saw the completion of multiple merger and acquisition deals between local and foreign companies. Moreover, multiple foreign automakers announced their intention to enter the Pakistani market, and some also entered into joint ventures with local conglomerates. This indicates that Pakistan is clearly on foreign investors' radar, and provides a positive outlook for FDI inflows going forward. government's successful issuance of a US$1.0 billion Sukuk in the international capital market, at an extremely low rate of 5.5 percent. | |||
Pakistan continued to enjoy support from international financial institutions (IFIs) like the [[World Bank]] and [[Asian Development Bank]], and from bilateral partners like China, in the post-EFF period: net official loan inflows of US$1.1 billion were recorded during the period. As a result, the country's FX reserve amounted to US$20.8 billion by 4 May 2017 sufficient to finance around four months of import payments.<ref name="TP"/> | |||
{| class="wikitable" | {| class="wikitable" | ||
|+Amounts in | |+Amounts in billion US dollars<ref name="BP">{{cite web |title=Summary Balance of Payments |url=http://www.sbp.org.pk/ecodata/BOP-Services/bop.pdf |access-date=4 August 2023 |website=SBP}}</ref> | ||
! List | ! List | ||
! FY 2008 | ! FY 2008 | ||
| Line 3,862: | Line 4,302: | ||
! FY 2022 | ! FY 2022 | ||
! FY 2023 | ! FY 2023 | ||
!FY 2024 | |||
!FY 2025 | |||
|- | |- | ||
! Credit | ! Credit | ||
| Line 3,879: | Line 4,321: | ||
| 65.12 | | 65.12 | ||
| 73.20 | | 73.20 | ||
| 64. | | 64.79 | ||
|72.25 | |||
|82.71 | |||
|- | |- | ||
! Debit | ! Debit | ||
| Line 3,897: | Line 4,341: | ||
| 67.94 | | 67.94 | ||
| 90.68 | | 90.68 | ||
| | | 68.06 | ||
|74.32 | |||
|80.60 | |||
|- | |- | ||
! Net | ! Net | ||
| | | −13.87 | ||
| | | −9.26 | ||
| | | −3.95 | ||
| | | +0.21 | ||
| | | −4.66 | ||
| | | −2.50 | ||
| | | −3.13 | ||
| | | −2.82 | ||
| | | −4.96 | ||
| | | −12.27 | ||
| | | −19.20 | ||
| | | −13.43 | ||
| | | −4.45 | ||
| | | −2.82 | ||
| | | −17.48 | ||
| -2. | | −3.28 | ||
| -2.07 | |||
| +2.11 | |||
|- | |- | ||
! colspan=" | ! colspan="19" |As % of GDP | ||
|- | |- | ||
!Net | !Net | ||
| Line 3,936: | Line 4,382: | ||
|{{increase}} -1.7 | |{{increase}} -1.7 | ||
|{{increase}} -0.6 | |{{increase}} -0.6 | ||
| | |{{decrease}}-4.7 | ||
|{{increase}}-0.9 | |||
|{{increase}}-0.6 | |||
| | | | ||
|} | |} | ||
| Line 3,942: | Line 4,390: | ||
=== Economic aid === | === Economic aid === | ||
{{Main|Foreign aid to Pakistan}} | {{Main|Foreign aid to Pakistan}} | ||
Pakistan receives economic aid from several sources as loans and grants. The [[International Monetary Fund]] (IMF), [[World Bank]] (WB), [[Asian Development Bank]] (ADB), etc. provide long-term loans to Pakistan. Pakistan also receives bilateral aid from developed and oil-rich countries. [[Foreign aid to Pakistan|Foreign aid]] has been one of the main sources of money for the Pakistani economy. Collection of foreign aid has been one of the priorities of almost every Pakistani Government with the Prime Minister himself leading delegations on a regular basis to collect foreign aid.<ref>{{cite web|url=https://thediplomat.com/2018/11/after-khans-visit-pakistan-doubles-down-on-china-dependence/|title=After Khan's Visit, Pakistan Doubles Down on China Dependence|author=Tridivesh Singh Maini|website=The Diplomat|access-date=19 May 2019}}</ref><ref>{{cite web|url=https://www.brookings.edu/blog/order-from-chaos/2018/12/10/experts-discuss-pakistans-imran-khans-first-100-days-in-office/|title=Experts discuss Pakistan's Imran Khan's first 100 days in office|last=Saber|first=Israa|date=10 December 2018|website=Brookings|access-date=19 May 2019}}</ref> | Pakistan receives economic aid from several sources as loans and grants. The [[International Monetary Fund]] (IMF), [[World Bank]] (WB), [[Asian Development Bank]] (ADB), etc. provide long-term loans to Pakistan. Pakistan also receives bilateral aid from developed and oil-rich countries. [[Foreign aid to Pakistan|Foreign aid]] has been one of the main sources of money for the Pakistani economy. Collection of foreign aid has been one of the priorities of almost every Pakistani Government with the Prime Minister himself leading delegations on a regular basis to collect foreign aid.<ref>{{cite web|url=https://thediplomat.com/2018/11/after-khans-visit-pakistan-doubles-down-on-china-dependence/|title=After Khan's Visit, Pakistan Doubles Down on China Dependence|author=Tridivesh Singh Maini|website=The Diplomat|access-date=19 May 2019}}</ref><ref>{{cite web|url=https://www.brookings.edu/blog/order-from-chaos/2018/12/10/experts-discuss-pakistans-imran-khans-first-100-days-in-office/|title=Experts discuss Pakistan's Imran Khan's first 100 days in office|last=Saber|first=Israa|date=10 December 2018|website=Brookings|access-date=19 May 2019}}</ref> | ||
The [[Asian Development Bank]] will provide close to $6 billion development assistance to Pakistan during 2006–9.<ref>{{cite web|url=http://www.brecorder.com/index.php?id=480165&currPageNo=1&query=&search=&term=&supDate=|title=Business Recorder [Pakistan's First Financial Daily]|publisher=Brecorder.com|date=1 January 2004|access-date=29 July 2010|archive-date=11 June 2010|archive-url=https://web.archive.org/web/20100611115418/http://www.brecorder.com/index.php?id=480165&currPageNo=1&query=&search=&term=&supDate=|url-status=dead}}</ref> The [[World Bank]] unveiled a lending programme of up to $6.5 billion for Pakistan under a new four-year, 2006–2009, aid strategy showing a significant increase in funding aimed largely at beefing up the country's infrastructure.<ref>{{cite magazine|url=https://www.forbes.com/markets/feeds/afx/2006/06/01/afx2788717.html |title=World Bank plans 6.5 bln usd lending to Pakistan |date=2 January 2006 |magazine=Forbes.com |access-date=6 March 2006 |url-status=dead |archive-url=https://web.archive.org/web/20060904191340/http://www.forbes.com/markets/feeds/afx/2006/06/01/afx2788717.html |archive-date=4 September 2006 }}</ref> Japan will provide $500 million annual economic aid to Pakistan.<ref>{{Cite news|url=http://www.hindu.com/thehindu/holnus/003200605290311.htm|title=Japan to resume USD 500 mn annual funding for Pak|date=29 May 2006|publisher=The Hindu News Update Service|access-date=3 June 2006|archive-url= https://web.archive.org/web/20070930221948/http://www.hindu.com/thehindu/holnus/003200605290311.htm|archive-date=30 September 2007 |location=Chennai, India}}</ref> In November 2008, the International Monetary Fund (IMF) has approved a loan of 7.6 billion to Pakistan, to help stabilise and rebuild the country's economy. Between the 2008 and 2010 fiscal years, the IMF extended loans to Pakistan totalling 5.2 billion dollars.<ref>{{cite web|url=https://www.imf.org/external/np/fin/tad/extrans1.aspx?memberKey1=760&endDate=2013-07-30&finposition_flag=YES|title=Transactions with the Fund, Pakistan|website= | The [[Asian Development Bank]] will provide close to $6 billion development assistance to Pakistan during 2006–9.<ref>{{cite web|url=http://www.brecorder.com/index.php?id=480165&currPageNo=1&query=&search=&term=&supDate=|title=Business Recorder [Pakistan's First Financial Daily]|publisher=Brecorder.com|date=1 January 2004|access-date=29 July 2010|archive-date=11 June 2010|archive-url=https://web.archive.org/web/20100611115418/http://www.brecorder.com/index.php?id=480165&currPageNo=1&query=&search=&term=&supDate=|url-status=dead}}</ref> The [[World Bank]] unveiled a lending programme of up to $6.5 billion for Pakistan under a new four-year, 2006–2009, aid strategy showing a significant increase in funding aimed largely at beefing up the country's infrastructure.<ref>{{cite magazine|url=https://www.forbes.com/markets/feeds/afx/2006/06/01/afx2788717.html |title=World Bank plans 6.5 bln usd lending to Pakistan |date=2 January 2006 |magazine=Forbes.com |access-date=6 March 2006 |url-status=dead |archive-url=https://web.archive.org/web/20060904191340/http://www.forbes.com/markets/feeds/afx/2006/06/01/afx2788717.html |archive-date=4 September 2006 }}</ref> Japan will provide $500 million annual economic aid to Pakistan.<ref>{{Cite news|url=http://www.hindu.com/thehindu/holnus/003200605290311.htm|title=Japan to resume USD 500 mn annual funding for Pak|date=29 May 2006|publisher=The Hindu News Update Service|access-date=3 June 2006|archive-url= https://web.archive.org/web/20070930221948/http://www.hindu.com/thehindu/holnus/003200605290311.htm|archive-date=30 September 2007 |location=Chennai, India}}</ref> In November 2008, the International Monetary Fund (IMF) has approved a loan of 7.6 billion to Pakistan, to help stabilise and rebuild the country's economy. Between the 2008 and 2010 fiscal years, the IMF extended loans to Pakistan totalling 5.2 billion dollars.<ref>{{cite web|url=https://www.imf.org/external/np/fin/tad/extrans1.aspx?memberKey1=760&endDate=2013-07-30&finposition_flag=YES|title=Transactions with the Fund, Pakistan|website=imf.org}}</ref> The government decided in 2011 to cut off ties with the IMF. However, the government newly elected in 2013 re-established these ties, and a negotiated a three-year $6.6 billion package which would allow it to deal with ongoing debt issues.<ref>{{cite web | url=https://www.cgdev.org/page/aid-pakistan-numbers | title=Aid to Pakistan by the Numbers | publisher=Center for Global Development | date=September 2013 | access-date=4 January 2019 }}</ref> In May 2019, Pakistan finalised a US$6 billion foreign aid with IMF.<ref>{{cite web|date=12 May 2019|title=IMF Agrees to $6 Billion Bailout to Help Pakistan Ease Crisis|url=https://www.bloomberg.com/news/articles/2019-05-12/pakistan-imf-agree-on-6-billion-bailout-after-reserves-plunge|access-date=19 May 2019|website=Bloomberg.com}}</ref> This is Pakistan's 22nd such bailout from the IMF.<ref>{{cite web|url=https://gulfnews.com/world/asia/pakistan/pakistan-growth-to-hit-eight-year-low-as-imf-bailout-looms-1.1557485097343|title=Pakistan growth to hit eight-year low as IMF bailout looms|website=gulfnews.com|date=10 May 2019 |access-date=19 May 2019}}</ref> | ||
The [[China–Pakistan Economic Corridor]] is being developed with a contribution of mainly concessionary loans from China under the [[Belt and Road Initiative]]. Much like BRI, value of CPEC investments transcends any fiat currency and is only estimated vaguely as it spans over decades of past and future industrial development and global economic influence. | The [[China–Pakistan Economic Corridor]] is being developed with a contribution of mainly concessionary loans from China under the [[Belt and Road Initiative]]. Much like BRI, the value of CPEC investments transcends any fiat currency and is only estimated vaguely as it spans over decades of past and future industrial development and global economic influence. | ||
=== Remittances === | === Remittances === | ||
The remittances of Pakistanis living abroad | The remittances of Pakistanis living abroad have played an important role in Pakistan's economy and foreign exchange reserves. Pakistanis settled in Western Europe and North America are significant sources of remittances to Pakistan. Since 1973, Pakistani workers in the oil-rich Arab states have been sources of billions of dollars of remittances. | ||
The 9 million-strong [[Pakistani diaspora]] contributed US$19.3 billion to the economy in FY2017.<ref>{{cite web|url=http://www.sbp.org.pk/reports/stat_reviews/Bulletin/2017/Aug/ExternalSector.pdf|title=Pakistan | State Bank of Pakistan |publisher=sbp.org |access-date=7 September 2017}}</ref> The major source countries of remittances to Pakistan include UAE, US, Saudi Arabia, GCC countries (including Bahrain, Kuwait, Qatar, and Oman), Australia, Canada, Japan, Norway, Switzerland, UK, and EU countries. | |||
Remittances sent home by overseas Pakistani workers saw a negative growth of 3.0% in the fiscal year 2017 compared to the previous year when remittances reached an all-time high of 19.9 billion US dollars. This decline in remittances is mainly due to the adverse economic conditions in Arabian and Gulf countries after the fall in oil prices in 2016. However, recent development activities in the Qatar FIFA World Cup, Dubai Expo, Saudi Arabia's implementation of its Vision 2030, and particularly the recent visit of the PM to Kuwait should all be helpful in opening new avenues for employment in these countries. Going forward, one can expect improvements in the coming years. The SBP's data showed that remittances amounted to $29.4 billion for the year 2021. The government and SBP took measures to incentivise the use of formal channels of sending money home. The orderly foreign exchange market conditions also contributed to the rise in remittances. Remittances helped improve the country's external sector position despite the challenging global economic conditions due to the coronavirus pandemic. | |||
Remittances | Data is taken from SBP and Ministry of Finance.<ref>{{cite web|title=Workers' Remittances|url=http://www.sbp.org.pk/ecodata/Homeremit.pdf|url-status=live|archive-url=https://web.archive.org/web/20041208220022/http://sbp.org.pk/ecodata/Homeremit.pdf|archive-date=8 December 2004|access-date=12 June 2021|website=SBP}}</ref><ref>{{cite web|title=Country-wise Workers' Remittances|url=http://www.sbp.org.pk/ecodata/Homeremit_Arch-.xlsx|access-date=22 August 2020|website=SBP|archive-date=30 July 2020|archive-url=https://web.archive.org/web/20200730230604/http://www.sbp.org.pk/ecodata/Homeremit_Arch-.xlsx|url-status=dead}}</ref><ref name="SI"/> | ||
{| class="wikitable" | {| class="wikitable" | ||
|+'''Amounts are in billion US$''' | |+'''Amounts are in billion US$'''. | ||
! List | ! List | ||
! FY 2008 | ! FY 2008 | ||
| Line 3,975: | Line 4,425: | ||
! FY 2022 | ! FY 2022 | ||
! FY 2023 | ! FY 2023 | ||
!FY 2024 | |||
!FY 2025 | |||
|- | |- | ||
| Workers' [[remittance]]s | | Workers' [[remittance]]s | ||
| Line 3,992: | Line 4,444: | ||
| style="text-align:center" |{{increase}} 29.5 | | style="text-align:center" |{{increase}} 29.5 | ||
| style="text-align:center" |{{increase}} 31.3 | | style="text-align:center" |{{increase}} 31.3 | ||
| style="text-align:center" |{{decrease}} 27. | | style="text-align:center" |{{decrease}} 27.3 | ||
|{{increase}}30.3 | |||
|{{increase}}38.3 | |||
|} | |} | ||
Remittances sent home by overseas Pakistanis in the fiscal year 2020/21 are as | Remittances sent home by overseas Pakistanis in the fiscal year 2020/21 are as follows:<ref name="WR"/> | ||
{| class="wikitable" | {| class="wikitable" | ||
|- | |- | ||
! Country !! ( | ! Country !! (billion US$) | ||
|- | |- | ||
| {{flag| Saudi Arabia}} || 7.667 | | {{flag| Saudi Arabia}} || 7.667 | ||
| Line 4,029: | Line 4,484: | ||
== Economic issues == | == Economic issues == | ||
=== | === 2021-2024 economic crisis === | ||
{{main|Pakistani economic crisis (2021–2024)}} | |||
{|style="margin: 0 auto; float:center;" | {|style="margin: 0 auto; float:center;" | ||
|[[File:Pakistan bonds.webp|thumb|300px|Pakistan bonds <br> [[Inverted yield curve]] in | |[[File:Pakistan bonds.webp|thumb|300px|Pakistan bonds <br> [[Inverted yield curve]] in 2019–2020 and 2022 | ||
{{legend-line|#970E53 solid 3px|20 year}} | {{legend-line|#970E53 solid 3px|20 year}} | ||
{{legend-line|#115740 solid 3px|10 year}} | {{legend-line|#115740 solid 3px|10 year}} | ||
| Line 4,042: | Line 4,497: | ||
|[[File:Pakistan inflation.webp|thumb|300px|Pakistan inflation]] | |[[File:Pakistan inflation.webp|thumb|300px|Pakistan inflation]] | ||
|} | |} | ||
=== Taxation Issues === | |||
In fiscal year 2023, tax exemptions and concessions granted to influential sectors such as real estate, manufacturing and energy, cost the state 4.61 percent of GDP.<ref name=":2" /> | |||
==== The Finance Act 2025 ==== | |||
The Finance Act 2025 drew significant controversy due to its stringent taxation measures and expanded enforcement powers granted to the [[Federal Board of Revenue]] (FBR). Key provisions, including Sections 37A and 37B, allowed for the arrest of individuals without prior notice, raising concerns over potential misuse and arbitrary enforcement. Additionally, measures such as the disallowance of business expenditures linked to cash transactions, penalties for purchases from non-National Tax Number (NTN) holders, mandatory digital invoicing, and an increased withholding tax on cash withdrawals by non-filers were widely criticized as burdensome and unclear by tax experts and business stakeholders.<ref name=":0">{{Cite web |last=Waleed |first=Hamid |date=2025-07-11 |title=Finance Act 2025 tightens tax rules for businesses, filers |url=https://www.brecorder.com/news/40372161 |access-date=2025-08-13 |website=Brecorder |language=en}}</ref><ref name=":1">{{Cite web |last=Khan |first=Gohar Ali |date=2025-07-19 |title=Karachi, Lahore hit by strike against 'anti-business' tax measures |url=https://www.brecorder.com/news/40373482 |access-date=2025-08-13 |website=Brecorder |language=en}}</ref> | |||
In response, major business communities across Pakistan staged protests and strikes, describing the measures as "anti-business." On 19 July 2025, a nationwide strike was observed, with complete shutdowns in key markets, including [[Karachi]]’s New Sabzi Mandi for the first time. Leading chambers of commerce, including those in Karachi and [[Lahore]], supported the strike, demanding the rollback of the new policies and restoration of previously abolished regimes. While some business groups entered talks with the government, others warned of further action if concerns remained unaddressed.<ref name=":0" /><ref name=":1" /> | |||
=== Corruption === | === Corruption === | ||
{{Main|Corruption in Pakistan}} | {{Main|Corruption in Pakistan}} | ||
[[File:Countries by Corruption Perceptions Index score (2020 - ColorBrewer RdYLGn).png|thumb|300x300px|[[Corruption Perceptions Index]] for Pakistan compared to other countries, 2020]] | [[File:Countries by Corruption Perceptions Index score (2020 - ColorBrewer RdYLGn).png|thumb|300x300px|[[Corruption Perceptions Index]] for Pakistan compared to other countries, 2020]] | ||
Corruption is an ongoing issue in the government, with claims of initiatives against it,<ref>{{cite book | |||
|url=https://books.google.com/books?id=fwYVAQAAIAAJ | |url=https://books.google.com/books?id=fwYVAQAAIAAJ | ||
|page=4 | |page=4 | ||
| Line 4,053: | Line 4,518: | ||
|year=1997 | |year=1997 | ||
|publisher=United Nations Development Programme|isbn=9789211260823 | |publisher=United Nations Development Programme|isbn=9789211260823 | ||
}}</ref> particularly | }}</ref> particularly at the government and lower levels of police forces.<ref>{{citation | ||
|contribution=Pakistan | |contribution=Pakistan | ||
|title=Country Reports on Human Rights Practices | |title=Country Reports on Human Rights Practices | ||
| Line 4,059: | Line 4,524: | ||
|date=4 August 2011 | |date=4 August 2011 | ||
|contribution-url=http://2009-2017.state.gov/documents/organization/160472.pdf | |contribution-url=http://2009-2017.state.gov/documents/organization/160472.pdf | ||
|access-date=10 December 2011}}</ref> In 2011, the country | |access-date=10 December 2011}}</ref> In 2011, the country consistently ranked poorly on the [[Transparency International]]'s [[Corruption Perceptions Index]], with scores of 2.5,<ref>{{cite web | ||
|title=Corruption Perceptions Index (2011) | |title=Corruption Perceptions Index (2011) | ||
|url=http://cpi.transparency.org/cpi2011/results | |url=http://cpi.transparency.org/cpi2011/results | ||
| Line 4,079: | Line 4,544: | ||
|url=http://www.transparency.org/policy_research/surveys_indices/cpi/2009/cpi_2009_table | |url=http://www.transparency.org/policy_research/surveys_indices/cpi/2009/cpi_2009_table | ||
|publisher=[[Transparency International]] | |publisher=[[Transparency International]] | ||
|access-date=10 December 2011}}</ref> out of 10.<ref>{{citation |url=http://www.u4.no/helpdesk/helpdesk/query.cfm?id=174 |title=Overview of corruption in Pakistan |author=Marie Chêne |publisher=U4 Anti-Corruption Resource Centre |access-date=19 April 2020 |archive-date=30 September 2011 |archive-url=https://web.archive.org/web/20110930105515/http://www.u4.no/helpdesk/helpdesk/query.cfm?id=174 |url-status=dead }}</ref> In 2011, Pakistan ranked | |access-date=10 December 2011}}</ref> out of 10.<ref>{{citation |url=http://www.u4.no/helpdesk/helpdesk/query.cfm?id=174 |title=Overview of corruption in Pakistan |author=Marie Chêne |publisher=U4 Anti-Corruption Resource Centre |access-date=19 April 2020 |archive-date=30 September 2011 |archive-url=https://web.archive.org/web/20110930105515/http://www.u4.no/helpdesk/helpdesk/query.cfm?id=174 |url-status=dead }}</ref> In 2011, Pakistan ranked 134th on the index, with 42 countries ranking worse.<ref>{{cite news | ||
|title=Pakistan less corrupt, according to global corruption list | |title=Pakistan less corrupt, according to global corruption list | ||
|url=http://tribune.com.pk/story/300601/pakistan-less-corrupt-according-to-global-corruption-list/ | |url=http://tribune.com.pk/story/300601/pakistan-less-corrupt-according-to-global-corruption-list/ | ||
| Line 4,085: | Line 4,550: | ||
|date=1 December 2011 | |date=1 December 2011 | ||
|access-date=10 December 2011}}</ref> | |access-date=10 December 2011}}</ref> | ||
In 2012, Pakistan's ranking dropped | In 2012, Pakistan's ranking dropped further from 134 to 139, making Pakistan the 34th most corrupt country in the world, tied with [[Azerbaijan]], [[Kenya]], [[Nepal]], and [[Nigeria]].<ref>[http://www.dw.de/rule-of-law-can-end-corruption-in-pakistan/a-16431781 'Rule of law can end corruption in Pakistan' | Asia | DW.DE | 06.12.2012]. DW.DE. Retrieved on 12 July 2013.</ref> | ||
However, during Sharif regime (2013–17), Pakistan | However, during the Sharif regime (2013–17), Pakistan improved its ranking to 117th out of 180 countries in 2017 (with an improvement in score from 28, 29, 30, 32, 32 [2013–17]), equal to Egypt (better than 59 countries).<ref>{{cite web|url=https://www.transparency.org/news/feature/corruption_perceptions_index_2017|title=Corruption Perceptions Index 2017|first=Transparency International|last=e.V|website=transparency.org|date=21 February 2018|access-date=19 April 2020|archive-date=21 February 2018|archive-url=https://web.archive.org/web/20180221190927/https://www.transparency.org/news/feature/corruption_perceptions_index_2017|url-status=dead}}</ref> Due to the adverse effects of corruption on the country, the National Accountability Bureau (NAB) was established in 1999. The primary purpose of NAB was to recover looted money from corrupt elements and deposit it in the national exchequer. From 2018 to 2020, NAB recovered Rs 502 billion from corrupt elements, a record achievement. Since the bureau's inception, NAB has recovered Rs 814 billion directly or indirectly from corrupt elements, exceeding the recovery of other such anti-corruption organizations.<ref>{{cite web|title=Press Releases|url=https://nab.gov.pk/press/new.asp?1966|url-status=live|access-date=3 September 2021|website=NAB|archive-url=https://web.archive.org/web/20210812220636/https://nab.gov.pk/PRESS/NEW.ASP?1966 |archive-date=12 August 2021 }}</ref> | ||
According to the [[International Monetary Fund|IMF]]’s 2025 Governance and Corruption Diagnostic Assessment, Pakistan’s economy loses an estimated 5–6.5 percent of its GDP to corruption due to entrenched "elite capture," in which influential groups shape public policy for their own benefit. The system has led to market distortions and wastage of public resources.<ref name=":2">{{Cite web |last=Hussain |first=Abid |title='Elite capture': How Pakistan is losing 6 percent of its GDP to corruption |url=https://www.aljazeera.com/economy/2025/11/25/elite-capture-how-pakistan-is-losing-6-percent-of-its-gdp-to-corruption |access-date=2025-11-25 |website=Al Jazeera |language=en}}</ref> | |||
===Debt=== | === Interference by Pakistan Military === | ||
The Pakistani military maintains significant influence over the country's economy, as illustrated by a July 2025 meeting between foreign exchange company representatives and a senior intelligence official, Major General [[Faisal Naseer]] of the [[Inter-Services Intelligence]] (ISI), to discuss the depreciation of the Pakistani rupee. While monetary policy and currency regulation traditionally fall under civilian institutions such as the [[State Bank of Pakistan]], the involvement of a high-ranking military officer reflects the broader role the military plays in national economic matters.<ref>{{Cite news |last1=Kaur Makol |first1=Malvika |last2=Haider |first2=Kamran |date=2025-07-24 |title=Pakistan Army Intelligence Officer Meets FX Body as Rupee Falls |url=https://www.bloomberg.com/news/articles/2025-07-24/pakistan-army-intelligence-officer-meets-fx-body-as-rupee-falls |work=Bloomberg}}</ref> | |||
According to [[Ayesha Siddiqa]]'s ''Military Inc.: Inside Pakistan’s Military Economy'', Pakistan's military controls a vast commercial network known as "Milbus," comprising businesses run for the personal benefit of military personnel but excluded from the official defense budget. These ventures include banks, factories, real estate, and retail operations, giving the military significant economic power. This financial autonomy strengthens the military's political dominance, distorts markets, and hinders democratic development by entrenching military influence in civilian affairs.<ref>{{Cite web |date=2013-02-10 |title=Military Inc. – Inside Pakistan's Military Economy - GSDRC |url=https://gsdrc.org/document-library/military-inc-inside-pakistans-military-economy/,%20https://gsdrc.org/document-library/military-inc-inside-pakistans-military-economy/ |access-date=2025-07-28 |language=en-US }}{{Dead link|date=August 2025 |bot=InternetArchiveBot |fix-attempted=yes }}</ref> | |||
Despite Pakistan's severe economic crisis marked by hyperinflation, rising debt, and low foreign reserves, the military has remained financially insulated. Military assets grew from A$30 billion in 2016 to over A$39.8 billion, even as state reserves fell to A$5.2 billion and debt surged. In the same period, the military received an increased budget allocation of A$11.27 billion. Senior officers, including Generals [[Qamar Javed Bajwa]] and [[Asim Saleem Bajwa]], reportedly amassed significant wealth, while military-run businesses continued to thrive. This resilience is attributed to the military's vast economic network, institutional autonomy, and strong political influence.<ref>{{Cite web |last=Jehangir |first=Ayesha |date=2023-05-23 |title=Explainer: A historical trail of Pakistan's powerful military enterprise |url=http://theconversation.com/explainer-a-historical-trail-of-pakistans-powerful-military-enterprise-205749 |access-date=2025-07-28 |website=The Conversation |language=en-US}}</ref> In 2025 too, for instance, as Pakistan faced 38 percent inflation, low foreign reserves, and widespread poverty, the military elite reportedly remained insulated from the crisis. They maintained affluent lifestyles, exclusive housing, and substantial business interests, in contrast to the hardships faced by the broader population.<ref>{{Cite web |date=2025-03-11 |title=Pakistan's military economy: An empire thriving amid national ruin |url=https://www.firstpost.com/opinion/pakistans-military-economy-an-empire-thriving-amid-national-ruin-13870738.html |access-date=2025-07-28 |website=Firstpost |language=en-us}}</ref> | |||
=== Poverty and Income inequality === | |||
{{Main|Poverty in Pakistan|Standard of living in Pakistan}} | |||
In 1965, Pakistan’s chief economist [[Mahbub ul Haq]] asserted that 22 families dominated the country’s economic and financial sectors. He contended that these families controlled roughly two-thirds of industrial assets, 80 percent of banking, and 79 percent of insurance assets.<ref name=":3">https://econ.berkeley.edu/sites/default/files/Ahmed_Ali_thesis.pdf {{Bare URL PDF|date=December 2025}}</ref><ref>{{Cite journal |last=Haq |first=Khadija |editor-first1=Khadija |editor-last1=Haq |title='Pakistan's 22 Families', in Khadija Haq (ed.), Economic Growth with Social Justice: Collected Writings of Mahbub ul Haq (Delhi, 2017; online edn, Oxford Academic, 18 Jan. 2018) |url=https://academic.oup.com/book/27535/chapter-abstract/197512323? |journal=Oxford Academic |date=2018 |volume=1 |doi=10.1093/oso/9780199474684.003.0014|url-access=subscription }}</ref> | |||
In 2015, Pakistan's pre-tax income distribution was highly concentrated at the top, with estimates indicating that the richest 1 percent received 30.2 percent of national income, the top 0.1 percent received 13.4 percent, and the top 0.01 percent received 5.1 percent.<ref name=":3" /> | |||
The [[United Nations Development Programme|UNDP]]’s National Human Development Report (NHDR) 2020 stated that public spending in Pakistan had not benefited all income groups equally. The poorest category received only 14.2 percent of the overall share of expenditure, while the richest received 37.2 percent. According to NHDR 2021, the richest 20 percent held 49.6 percent of national income, compared with just 7 percent held by the poorest 20 percent.<ref>{{Cite web |last=Hashim |first=Asad |title=Elite privilege consumes $17.4bn of Pakistan's economy: UNDP |url=https://www.aljazeera.com/news/2021/4/13/elite-privilege-consumes-17-4bn-of-pakistans-economy-undp |access-date=2025-11-26 |website=Al Jazeera |language=en}}</ref> | |||
=== Link between remittance inflows and migration trends === | |||
In 2024, personal remittance inflows to Pakistan accounted for 9.4% of the country's gross domestic product, a figure notably higher than India's 3.5% and significantly increased from the pre-[[COVID-19 pandemic|COVID-19]] level of 6%. This economic reliance on remittances reflects underlying challenges in domestic opportunities, which the 2024 report by the National Commission for Human Rights links to a rise in illegal migration. According to the report, over 6,000 Pakistanis undertook illegal journeys to Europe in 2023 alone.<ref>{{Cite web |title=Illegal Pakistani migrants disguised as soccer players sent to Japan |url=https://asia.nikkei.com/spotlight/immigration/illegal-pakistani-migrants-disguised-as-soccer-players-sent-to-japan |access-date=2025-09-25 |website=Nikkei Asia |language=en}}</ref> | |||
=== Ease of doing business === | |||
Pakistan's economy faces significant challenges impacting its ease of doing business, including weak macroeconomic indicators, reliance on imports, and low [[foreign direct investment]] (FDI). Investors point to high inflation, complex regulations, inconsistent policies, poor intellectual property protection, corruption, political instability, and security concerns as key obstacles. Pakistan's Ease of Doing Business ranking fell from 61st in 2006 to 147th in 2018, before improving to 108th in 2020. To address these issues, the government secured a $3 billion [[IMF]] Stand-By Arrangement in 2023 and established the [[Special Investment Facilitation Council]] to attract foreign investment, especially from [[Gulf Cooperation Council]] countries.<ref>{{Cite web |title=Pakistan |url=https://www.state.gov/reports/2024-investment-climate-statements/pakistan/ |access-date=2025-10-07 |website=United States Department of State |language=en-US}}</ref><ref>{{Cite web |last=Salman |first=Ali |date=2024-07-08 |title=Ease of doing business: cases of Malaysia, Pakistan |url=https://tribune.com.pk/story/2477536/ease-of-doing-business-cases-of-malaysia-pakistan |access-date=2025-10-07 |website=The Express Tribune |language=en}}</ref> | |||
Since 2022, many [[Multinational corporation|MNCs]], including [[Eli Lilly]], [[Shell plc|Shell]], [[Microsoft]], [[Uber]], and [[Yamaha Motor Company|Yamaha]], have exited Pakistan, driven by a combination of sector-specific challenges, weak intellectual property enforcement, shrinking margins, and an unstable economic environment. Former Pakistan Business Council CEO Ehsan Malik cited delays in regulatory approvals, rising local competition, and a depreciating rupee as key reasons behind the retreat. He noted that pharmaceutical multinationals often exit due to prolonged delays in price adjustment approvals and the unethical marketing practices employed by certain local firms.<ref>{{Cite web |last=Dawn.com |date=2025-10-02 |title=Why are multinationals exiting Pakistan? Here's what analysts have to say |url=https://www.dawn.com/news/1946119 |access-date=2025-10-07 |website=Dawn |language=en}}</ref> In October 2025, [[Procter & Gamble]] (P&G) announced its exit after 34 years in the country, winding down the manufacturing and commercial operations of both P&G Pakistan and Gillette Pakistan Ltd. The company cited weak demand, high energy costs, and repatriation restrictions. Gillette's board endorsed the decision and began delisting procedures from the [[Pakistan Stock Exchange]] (PSX). Former Gillette CEO Saad Amanullah Khan stated that such corporate departures should serve as a wake-up call for policymakers, highlighting concerns over high operating costs, poor infrastructure, and regulatory pressures.<ref>{{Cite web |last= |first= |date=2025-10-03 |title=P&G exits Pakistan |url=https://tribune.com.pk/story/2570321/pg-exits-pakistan |access-date=2025-10-07 |website=The Express Tribune |language=en}}</ref><ref>{{Cite news |date=2025-10-02 |title=Procter & Gamble Will Shut Down Business in Pakistan, Following Shell and Pfizer Exits |url=https://www.bloomberg.com/news/articles/2025-10-02/p-g-to-shut-pakistan-razor-unit-amid-global-overhaul-strains |access-date=2025-10-07 |work=Bloomberg.com |language=en}}</ref><ref>{{Cite web |title=Why is Procter & Gamble exiting cash-strapped Pakistan after 34 years? |url=https://www.wionews.com/business-economy/why-is-procter-gamble-exiting-cash-strapped-pakistan-after-34-years-1759404845717 |access-date=2025-10-07 |website=Wion |language=en}}</ref> | |||
Startup funding in Pakistan dropped sharply from $355 million in 2022 to $43 million in 2024, an 88% decline. Analysts cite rupee depreciation, regulatory hurdles, and tax uncertainty as key factors, with industry performance lagging behind regional peers like India and Bangladesh.<ref>{{Cite web |last=Virani |first=Faiza |date=2025-07-03 |title=Pakistan's shrinking tech landscape: global companies exit amidst capital crunch |url=https://www.brecorder.com/news/40370916 |access-date=2025-10-07 |website=Brecorder |language=en}}</ref> | |||
As of 2025, Pakistan's FDI averaged just 0.6% of its GDP.<ref>{{Cite AV media |url=https://www.dw.com/en/why-pakistan-fails-to-unlock-its-economic-potential/video-74610645 |title=Why Pakistan fails to unlock its economic potential – DW – 11/04/2025 |language=en |access-date=2025-12-11 |via=www.dw.com}}</ref> | |||
=== Debt === | |||
{{Main|National debt of Pakistan|Foreign aid to Pakistan|Periods of stagflation in Pakistan}} | {{Main|National debt of Pakistan|Foreign aid to Pakistan|Periods of stagflation in Pakistan}} | ||
[[File:Debt.PNG|300px|thumb|Map of countries by external debt in US$, 2006]] | [[File:Debt.PNG|300px|thumb|Map of countries by external debt in US$, 2006]] | ||
According to the [[CIA World Factbook]], in 2017, Pakistan ranked 57th in the world in terms of public external debt to various international monetary authorities (owing ~$107.527 billion in 2019), accounting for a total of 67.1% of [[GDP]] (in 2017).<ref>{{Citation |title=Pakistan |date=30 March 2022 |url=https://www.cia.gov/the-world-factbook/countries/pakistan/#economy |archive-url=https://web.archive.org/web/20220328180650/https://www.cia.gov/the-world-factbook/countries/pakistan/#economy |url-status=dead |archive-date=28 March 2022 |work=The World Factbook |publisher=Central Intelligence Agency |language=en |access-date=6 April 2022}}</ref> | |||
Government debt and liabilities data is sourced from the [[State Bank of Pakistan]].<ref>{{cite web|title=Pakistan's Debt and Liabilities-Summary|url=http://www.sbp.org.pk/ecodata/Summary-Arch.xls|url-status=live|access-date=18 February 2021|website=SBP|archive-url=https://web.archive.org/web/20171025062209/http://www.sbp.org.pk/ecodata/Summary-Arch.xls|archive-date=25 October 2017}}</ref><ref>{{cite web|title=Pakistan's External Debt and Liabilities – Outstanding|url=http://www.sbp.org.pk/ecodata/pakdebt.pdf|url-status=live|access-date=30 December 2021|website=SBP|archive-url=https://web.archive.org/web/20030527081341/http://www.sbp.org.pk/Ecodata/pakdebt.pdf|archive-date=27 May 2003}}</ref><ref>{{cite web|last=Pakistan's Debt and Liabilities-Summary|title=Pakistan's Debt and Liabilities-Summary|url=https://www.sbp.org.pk/ecodata/Summary.pdf|url-status=live|access-date=30 December 2021|website=SBP|archive-url=https://web.archive.org/web/20111202000050/http://sbp.org.pk/ecodata/Summary.pdf |archive-date=2 December 2011 }}</ref> | |||
{| class="wikitable" | {| class="wikitable" | ||
| Line 4,118: | Line 4,610: | ||
! Jun 2022 | ! Jun 2022 | ||
! Jun 2023 | ! Jun 2023 | ||
!Jun 2024 | |||
!Jun 2025 | |||
|- | |- | ||
! colspan=" | ! colspan="16" |'''(Amounts are in billion PKR.)''' | ||
! | ! | ||
|- | |- | ||
![[Gross public debt]] | ![[Gross public debt]] | ||
| Line 4,152: | Line 4,630: | ||
| style="text-align:center" | {{IncreaseNegative}} 39,866 | | style="text-align:center" | {{IncreaseNegative}} 39,866 | ||
| style="text-align:center" | {{IncreaseNegative}} 49,242 | | style="text-align:center" | {{IncreaseNegative}} 49,242 | ||
| style="text-align:center" | {{IncreaseNegative}} 62, | | style="text-align:center" | {{IncreaseNegative}} 62,881 | ||
|{{IncreaseNegative}}71,246 | |||
|{{IncreaseNegative}}80,518 | |||
|- | |- | ||
!Total debt of govt. | !Total debt of govt. | ||
| Line 4,166: | Line 4,646: | ||
| style="text-align:center" | {{IncreaseNegative}} 29,521 | | style="text-align:center" | {{IncreaseNegative}} 29,521 | ||
| style="text-align:center" | {{IncreaseNegative}} 33,235 | | style="text-align:center" | {{IncreaseNegative}} 33,235 | ||
| style="text-align:center" | {{IncreaseNegative}} 35, | | style="text-align:center" | {{IncreaseNegative}} 35,669 | ||
| style="text-align:center" | {{IncreaseNegative}} 44,362 | | style="text-align:center" | {{IncreaseNegative}} 44,362 | ||
| style="text-align:center" | {{IncreaseNegative}} 57, | | style="text-align:center" | {{IncreaseNegative}} 57,779 | ||
|{{IncreaseNegative}}65,105 | |||
|{{IncreaseNegative}}73,271 | |||
|- | |- | ||
! colspan=" | ! colspan="16" | '''(Amounts are in billion US$.)''' | ||
! | ! | ||
|- | |- | ||
!Public external debt | !Public external debt | ||
| style="text-align:center" | {{IncreaseNegative}} | | style="text-align:center" | {{IncreaseNegative}} 53.6 | ||
| style="text-align:center" | {{IncreaseNegative}} | | style="text-align:center" | {{IncreaseNegative}} 57.9 | ||
| style="text-align:center" | {{DecreasePositive}} | | style="text-align:center" | {{DecreasePositive}} 55.9 | ||
| style="text-align:center" | {{DecreasePositive | | style="text-align:center" | {{DecreasePositive}} 51.2 | ||
| style="text-align:center" | {{IncreaseNegative}} 54.7 | |||
| style="text-align:center" | {{steady}} 54.7 | |||
| style="text-align:center" | {{IncreaseNegative}} | | style="text-align:center" | {{IncreaseNegative}} 61.4 | ||
| style="text-align:center" | {{ | | style="text-align:center" | {{IncreaseNegative}} 66.1 | ||
| style="text-align:center" | {{IncreaseNegative}} | | style="text-align:center" | {{IncreaseNegative}} 75.4 | ||
| style="text-align:center" | {{IncreaseNegative}} 83.9 | |||
| style="text-align:center" | {{IncreaseNegative}} | | style="text-align:center" | {{IncreaseNegative}} 87.9 | ||
| style="text-align:center" | {{IncreaseNegative}} | |||
| style="text-align:center" | {{IncreaseNegative}} | |||
| style="text-align:center" | {{IncreaseNegative}} | |||
| style="text-align:center" | {{IncreaseNegative}} 95.2 | | style="text-align:center" | {{IncreaseNegative}} 95.2 | ||
| style="text-align:center" | {{IncreaseNegative}} | | style="text-align:center" | {{IncreaseNegative}} 100.0 | ||
| style="text-align:center" | {{ | | style="text-align:center" | {{DecreasePositive}} 94.9 | ||
|{{IncreaseNegative}} 98.3 | |||
|{{IncreaseNegative}}103.8 | |||
|- | |- | ||
! colspan=" | ! colspan="16" |'''As % of GDP''' | ||
! | ! | ||
|- | |- | ||
!Gross public debt | !Gross public debt | ||
| Line 4,238: | Line 4,690: | ||
| style="text-align:center" | {{DecreasePositive}} 71.5 | | style="text-align:center" | {{DecreasePositive}} 71.5 | ||
| style="text-align:center" | {{IncreaseNegative}} 73.9 | | style="text-align:center" | {{IncreaseNegative}} 73.9 | ||
| style="text-align:center" | {{IncreaseNegative}} | | style="text-align:center" | {{IncreaseNegative}} 75.0 | ||
|{{DecreasePositive}} 67.8 | |||
|{{IncreaseNegative}} 70.2 | |||
|- | |- | ||
!Total debt of govt. | !Total debt of govt. | ||
| Line 4,254: | Line 4,708: | ||
| style="text-align:center" | {{DecreasePositive}} 63.9 | | style="text-align:center" | {{DecreasePositive}} 63.9 | ||
| style="text-align:center" | {{IncreaseNegative}} 66.6 | | style="text-align:center" | {{IncreaseNegative}} 66.6 | ||
| style="text-align:center" | {{IncreaseNegative}} 68. | | style="text-align:center" | {{IncreaseNegative}} 68.9 | ||
|{{DecreasePositive}} 61.9 | |||
|{{IncreaseNegative}} 63.9 | |||
|- | |- | ||
!Public external debt | !Public external debt | ||
| style="text-align:center" | {{IncreaseNegative}} | | style="text-align:center" | {{IncreaseNegative}} 30.8 | ||
| style="text-align:center" | {{DecreasePositive}} | | style="text-align:center" | {{DecreasePositive}} 27.2 | ||
| style="text-align:center" | {{DecreasePositive}} | | style="text-align:center" | {{DecreasePositive}} 26.4 | ||
| style="text-align:center" | {{DecreasePositive}} | | style="text-align:center" | {{DecreasePositive}} 22.7 | ||
| style="text-align:center" | {{DecreasePositive}} | | style="text-align:center" | {{DecreasePositive}} 21.5 | ||
| style="text-align:center" | {{DecreasePositive}} | | style="text-align:center" | {{DecreasePositive}} 20.3 | ||
| style="text-align:center" | {{ | | style="text-align:center" | {{DecreasePositive}} 19.6 | ||
| style="text-align:center" | {{DecreasePositive}} 19.5 | | style="text-align:center" | {{DecreasePositive}} 19.5 | ||
| style="text-align:center" | {{IncreaseNegative}} 23.4 | | style="text-align:center" | {{IncreaseNegative}} 23.4 | ||
| style="text-align:center" | {{IncreaseNegative}} 31.2 | | style="text-align:center" | {{IncreaseNegative}} 31.2 | ||
| style="text-align:center" | {{DecreasePositive}} 31.1 | | style="text-align:center" | {{DecreasePositive}} 31.1 | ||
| style="text-align:center" | {{DecreasePositive}} | | style="text-align:center" | {{DecreasePositive}} 26.9 | ||
| style="text-align:center" | {{IncreaseNegative}} | | style="text-align:center" | {{IncreaseNegative}} 30.5 | ||
| style="text-align:center" | {{IncreaseNegative}} | | style="text-align:center" | {{IncreaseNegative}} 32.3 | ||
|{{DecreasePositive}} 26.0 | |||
|{{DecreasePositive}} 25.7 | |||
|} | |} | ||
Pakistan external debt servicing | |||
Pakistan's external debt servicing includes the repayment of both the principal amount borrowed and the accrued interest.<ref>{{cite web |title=Pakistan's External Debt Servicing -Principal (Archive) |url=https://www.sbp.org.pk/ecodata/pakdebtsvr_Arch.xls |url-status=live |archive-url=https://web.archive.org/web/20101130000730/http://sbp.org.pk/ecodata/pakdebtsvr_arch.xls |archive-date=30 November 2010 |access-date=17 August 2023 |website=SBP}}</ref> | |||
{| class="wikitable" | {| class="wikitable" | ||
|+Amounts are in million US$ | |+Amounts are in million US$. | ||
|- | |- | ||
! List | ! List | ||
| Line 4,291: | Line 4,751: | ||
! FY 2022 | ! FY 2022 | ||
! FY 2023 | ! FY 2023 | ||
!FY 2024 | |||
|- | |- | ||
! Principal | ! Principal | ||
| Line 4,307: | Line 4,768: | ||
| style="text-align:center" |{{increase}}11,577 | | style="text-align:center" |{{increase}}11,577 | ||
| style="text-align:center" |{{increase}}15,061 | | style="text-align:center" |{{increase}}15,061 | ||
|{{decrease}}9,273 | |||
|- | |- | ||
! Interest | ! Interest | ||
| Line 4,323: | Line 4,785: | ||
| style="text-align:center" |{{increase}}2,985 | | style="text-align:center" |{{increase}}2,985 | ||
| style="text-align:center" |{{increase}}4,421 | | style="text-align:center" |{{increase}}4,421 | ||
|{{increase}}5,457 | |||
|- | |- | ||
! Total | ! Total | ||
| Line 4,339: | Line 4,802: | ||
| style="text-align:center" |{{increase}}14,562 | | style="text-align:center" |{{increase}}14,562 | ||
| style="text-align:center" |{{increase}}19,482 | | style="text-align:center" |{{increase}}19,482 | ||
|{{decrease}}14,730 | |||
|} | |} | ||
| Line 4,344: | Line 4,808: | ||
{{Portal|Pakistan|Economics}} | {{Portal|Pakistan|Economics}} | ||
*[[List of companies of Pakistan]] | |||
*[[Trade unions in Pakistan]] | |||
*[[Nationalisation in Pakistan]] | |||
*[[Privatisation in Pakistan]] | |||
*[[Economy of Punjab, Pakistan]] | |||
*[[Economy of Sindh]] | |||
*[[Economy of Khyber Pakhtunkhwa]] | |||
*[[Economy of Balochistan, Pakistan]] | |||
*[[Economy of Azad Kashmir]] | *[[Economy of Azad Kashmir]] | ||
*[[Economy of Gilgit Baltistan]] | *[[Economy of Gilgit Baltistan]] | ||
== Notes == | == Notes == | ||
| Line 4,366: | Line 4,829: | ||
* {{cite book|last=Gabol |first=Nasir |title=Privatisation in Pakistan|year=1990|publisher=Organisation for Economic Cooperation and Development|location=Paris, France|isbn=92-64-15310-1|url=https://books.google.com/books?id=95EpvLocMYEC}} | * {{cite book|last=Gabol |first=Nasir |title=Privatisation in Pakistan|year=1990|publisher=Organisation for Economic Cooperation and Development|location=Paris, France|isbn=92-64-15310-1|url=https://books.google.com/books?id=95EpvLocMYEC}} | ||
* ''Ahmad, Viqar and Rashid Amjad''. 1986. The Management of Pakistan's Economy, 1947–82. Karachi: Oxford University Press. | * ''Ahmad, Viqar and Rashid Amjad''. 1986. The Management of Pakistan's Economy, 1947–82. Karachi: Oxford University Press. | ||
* ''Ali, Imran. 1997.'' | * ''Ali, Imran. 1997.'' 'Telecommunications Development in Pakistan', in E.M. Noam (ed.), Telecommunications in Western Asia and the Middle East. New York: Oxford University Press. | ||
* ''Ali, Imran''. 2001a. | * ''Ali, Imran''. 2001a. 'The Historical Lineages of Poverty and Exclusion in Pakistan'. Paper presented at Conference on Realm, Society and Nation in South Asia. National University of Singapore. | ||
* ''Ali, Imran''. 2001b. | * ''Ali, Imran''. 2001b. 'Business and Power in Pakistan', in A.M. Weiss and S.Z. Gilani (eds), Power and Civil Society in Pakistan. Karachi: Oxford University Press. | ||
* ''Ali, Imran''. 2002. | * ''Ali, Imran''. 2002. 'Past and Present: The Making of the State in Pakistan', in Imran Ali, S. Mumtaz and J.L. Racine (eds), Pakistan: The Contours of State and Society. Karachi: Oxford University Press. | ||
* ''Ali, Imran, A. Hussain.'' 2002. Pakistan National Human Development Report. Islamabad: UNDP. | * ''Ali, Imran, A. Hussain.'' 2002. Pakistan National Human Development Report. Islamabad: UNDP. | ||
* ''Ali, Imran, S. Mumtaz and J.L. Racine'' (eds). 2002. Pakistan: The Contours of State and Society. Karachi: Oxford University Press. | * ''Ali, Imran, S. Mumtaz and J.L. Racine'' (eds). 2002. Pakistan: The Contours of State and Society. Karachi: Oxford University Press. | ||
| Line 4,387: | Line 4,850: | ||
* ''White, L.J.'' 1974. Industrial Concentration and Economic Power. Princeton, N.J.: Princeton University Press. | * ''White, L.J.'' 1974. Industrial Concentration and Economic Power. Princeton, N.J.: Princeton University Press. | ||
* ''Ziring, Lawrence''. 1980. Pakistan: The Enigma of Political Development. Boulder, Colorado: Folkestone. | * ''Ziring, Lawrence''. 1980. Pakistan: The Enigma of Political Development. Boulder, Colorado: Folkestone. | ||
* ''Ali, Imran''. 1987. | * ''Ali, Imran''. 1987. 'Malign Growth? Agricultural Colonisation and the Roots of Backwardness in the Punjab', Past and Present, 114 | ||
* ''Ali, Imran''. August 2002. | * ''Ali, Imran''. August 2002. 'The Historical Lineages of Poverty and Exclusion in Pakistan', South Asia, XXV(2). | ||
* ''Ali, Imran and S. Mumtaz''. 2002. | * ''Ali, Imran and S. Mumtaz''. 2002. 'Understanding Pakistan—The Impact of Global, Regional, National and Local Interactions', in Imran Ali, S. Mumtaz and J.L. Racine (eds), Pakistan: the Contours of State and Society. Karachi: Oxford University Press. | ||
* ''Hasan, Parvez.'' 1998. Pakistan's Economy at the Crossroads: Past Policies and Present Imperatives. Karachi: Oxford University Press. | * ''Hasan, Parvez.'' 1998. Pakistan's Economy at the Crossroads: Past Policies and Present Imperatives. Karachi: Oxford University Press. | ||
* ''Hussain, Ishrat''. 1999. Pakistan: The Economy of an Elitist State. Karachi: Oxford University Press. | * ''Hussain, Ishrat''. 1999. Pakistan: The Economy of an Elitist State. Karachi: Oxford University Press. | ||
| Line 4,397: | Line 4,860: | ||
* ''Zaidi, S. Akbar''. 1999. Issues in Pakistan's Economy. Karachi: Oxford University Press | * ''Zaidi, S. Akbar''. 1999. Issues in Pakistan's Economy. Karachi: Oxford University Press | ||
* ''Faheem, Khan''. 2010. Issues in Pakistan's Economy. Peshawar: | * ''Faheem, Khan''. 2010. Issues in Pakistan's Economy. Peshawar: | ||
* | * https://www.thenews.com.pk/tns/detail/710478-retail-sector-a-5-billion-tax-potential | ||
{{refend}} | {{refend}} | ||
| Line 4,407: | Line 4,870: | ||
* [http://www.commerce.gov.pk/ Ministry of Commerce, Government of Pakistan] | * [http://www.commerce.gov.pk/ Ministry of Commerce, Government of Pakistan] | ||
* [http://wits.worldbank.org/CountryProfile/Country/PAK/Year/LTST/Summary World Bank Summary Trade Statistics Pakistan] | * [http://wits.worldbank.org/CountryProfile/Country/PAK/Year/LTST/Summary World Bank Summary Trade Statistics Pakistan] | ||
* [https://www.cia.gov/the-world-factbook/countries/pakistan/ Pakistan]. ''[[The World Factbook]]''. [[Central Intelligence Agency]]. | * [https://web.archive.org/web/20260115154455/https://www.cia.gov/the-world-factbook/countries/pakistan/ Pakistan]. ''[[The World Factbook]]''. [[Central Intelligence Agency]]. | ||
{{Economy of Pakistan}} | |||
{{Pakistan topics}} | {{Pakistan topics}} | ||
{{SAFTA}} | {{SAFTA}} | ||
{{World Trade Organization}} | {{World Trade Organization}} | ||
Latest revision as of 03:14, 13 March 2026
 | This article has multiple issues. Please help improve it or discuss these issues on the talk page. (Learn how and when to remove these template messages)
|

 | |
| Currency | Pakistani rupee (₨) (PKR) |
|---|---|
| 1 USD = 280 PKR | |
| 1 July – 30 June | |
Trade organisations | ECO, SAFTA, WTO, AIIB, ADB, SAARC OIC |
Country group | |
| Statistics | |
| Population | 257,390,405 (2026) |
| GDP | |
| GDP rank | |
GDP growth | |
GDP per capita | |
GDP per capita rank | |
GDP by sector |
|
GDP by component |
|
| |
Population below poverty line |
8% (rural); 0.3% (urban) |
| 31.6 medium (2018, World Bank)[14] | |
| |
Labour force |
|
Labour force by occupation |
|
| Unemployment |
|
Main industries |
|
| External | |
| Exports |  $40.69 billion (2025)[18] $40.69 billion (2025)[18] |
Export goods |
|
Main export partners |
|
| Imports | $78.02 billion (2025)[18] |
Import goods | |
Main import partners |
|
FDI stock |
|
| 1.8 billion US$ (FY 2025)[24] | |
Gross external debt | Template:Increasenegative $131 billion (2025)[25] |
| Public finances | |
| Template:Decreasepositive 61.4% of GDP (Jun 2024)[26] | |
| Template:Decreasepositive −5.6% of GDP (FY 2024)[5] | |
| Revenues | 12.5% of GDP; 13,269 billion PKR or $47 billion (FY 2024)[27] |
| Expenses | Template:Increasenegative 19.3% of GDP; 20,476 billion PKR $72 billion (FY 2024)[27] |
| Economic aid | $2.6983 billion (2021)[28] |
Foreign reserves | $20 billion (2025)[33] |
All values, unless otherwise stated, are in US dollars. | |


The economy of Pakistan is classified as a developing economy. It is the 26th-largest economy by GDP (PPP) and the 41st-largest in terms of nominal GDP in the world. In terms of per capita income, the country ranks 161st by GDP (nominal) and 142nd by GDP (PPP), according to the International Monetary Fund (IMF) in 2025.[34][35]
In its early years, the economy of Pakistan relied heavily on private industries. The nationalization of a significant portion of the sector, including financial services, manufacturing, and transportation, began in the early 1970s under Zulfikar Ali Bhutto. During the regime of Zia-ul Haq in the 1980s, an Islamic model of economy was adopted, outlawing economic practices forbidden in Sharīʿah. The economy started privatizing again in the 1990s. Pakistan was classified as a semi-industrial economy for the first time in the late 1990s, albeit an underdeveloped country[36] with a heavy dependence on agriculture, particularly the textile industry relying on cotton production.[37][38][39]
Pakistan is presently recovering from a major economic crisis and undergoing economic liberalization, including the privatization of all government corporations, aimed at attracting foreign investment and reducing budget deficits.[40] As of 11 February 2026, the Governor of the State Bank of Pakistan stated that the economy was projected to grow between 3.75% and 4.75% in fiscal year 2026, exceeding a recent IMF forecast. The central bank kept its policy rate at 10.5% following earlier reductions, and projected the current account deficit to remain within 0–1% of GDP, while emphasizing the need for continued structural reforms to sustain growth.[41]
The economic growth centers in Pakistan are located along the Indus River;[42][43] these include the diversified economies of Karachi and major urban centers in Punjab (such as Faisalabad, Lahore, Sialkot, Rawalpindi, and Gujranwala), alongside less developed areas in other parts of the country.[42] In recent decades, regional connectivity initiatives such as the China-Pakistan Economic Corridor (CPEC) have emerged as pivotal contributors to infrastructure and energy development, with long-term implications for economic stability. Primary export commodities include textiles, leather goods, sports equipment, chemicals, and carpets/rugs.[44][45]
Economic history[edit | edit source]
Inception[edit | edit source]
In the late 1940s, upon its establishment, Pakistan had an agrarian-based economy. Agriculture constituted 53% of the country's GDP in 1947 and slightly increased to 53.2% in 1949–50. With a population of approximately 30 million, including around 6 million residing in urban areas, about 65% of the labor force was engaged in agriculture. The agricultural sector played a crucial role, contributing to 99.2% of exports and making up nearly 90% of foreign exchange earnings.
Despite possessing significant land and mineral resources in both East and West Pakistan, including natural gas, crude oil, coal, limestone, and marble, Pakistan faced numerous challenges. In 1950, its per capita income was around $360 (in 1985 international dollars), and the literacy rate was only 10%. The nation encountered a lack of economic infrastructure, financial resources, and an industrial foundation, particularly with poverty rates ranging from 55% to 60% in the West Pakistan region.
Due to limited capital in the small private sector, the government opted to focus on the public sector to foster economic and industrial development. In the fiscal year 1949–50, Pakistan recorded a national savings rate of 2%, a foreign savings rate of 2%, and an investment rate of 4%. Manufacturing contributed 7.8% to the GDP, while services, trade, and other sectors accounted for a significant 39%, reflecting a policy centered around import-substituting industrialization. The trade balance of payments indicated a deficit of 66 million rupees (Rs) during the period spanning 1949/50 to 1950/51.[46]
1950s[edit | edit source]
The 1950s marked the initiation of planned development in Pakistan, with the introduction of the Colombo Plan in 1951 leading to a series of Five-Year Plans from 1955 to 1998. Concurrently, a Ten-Year Perspective Plan was implemented, complemented by a rolling Three-Year Development Plan.
During the 1950s, Pakistan pursued a policy of import-substituting industrialization. Notably, the Korean War (1950–1953) brought substantial merchant profits to Pakistan's public and emerging private sectors, fueling industrialization.
In 1952, Pakistan imposed bans on the imports of cotton textiles and luxury goods, followed by comprehensive import regulations in 1953, propelling the country into the ranks of the fastest-growing nations. However, biased policies against agriculture and unfavorable trade terms between agriculture and industry led to a decline in the annual growth rate of agriculture.
By the late 1950s, Pakistan achieved self-sufficiency in cotton textiles, emphasizing export development. The influx of US military and economic aid amounting to US$500 million during 1955–58 contributed to Pakistan's growth reliant on foreign aid.
In 1959, after a military coup d'état in 1958, the martial law regime introduced export bonus vouchers as import licenses and exempted certain goods from licensing. During this period, Pakistan faced a worsening trade balance, with deficits increasing from −831 million Rupees in 1950/51 to −1043 million rupees in 1959/60.
Economically, agriculture grew at an annual rate of 1.6%, while manufacturing expanded impressively at 7.7% per annum during the 1950s. In the fiscal year 1959–60, the Per Capita Gross National Product (GNP) stood at Rs. 355 in West Pakistan and Rs. 269 in East Pakistan, indicating a growing economic disparity between the two regions.[46]
1960s[edit | edit source]
In the 1960s, amid a substantial influx of American aid, Pakistan enjoyed political stability, fostering robust economic growth. Poverty, measured by the poverty headcount ratio, fluctuated from nearly 50% in the early 1960s to 54% in 1963–64.
During the 1960s, Pakistan achieved an impressive annual agricultural growth rate of 5%, driven by substantial investments in water resources, increased farmer incentives, mechanization, greater use of fertilizers and pesticides, and expanded cultivation of high-yielding rice and wheat varieties in the Green Revolution.
Large-scale manufacturing experienced significant growth, expanding at a remarkable rate of 16% per annum from 1960/61 to 1964/65, fueled by protective measures for domestic industries, including export subsidies.
However, the Pakistan-India War of 1965 led to reduced foreign economic assistance, impacting the growth rate of large-scale manufacturing. From 1965 to 1970, this sector grew at a comparatively lower rate of 10% per annum.
Despite challenges, Pakistan achieved an impressive average annual GDP growth rate of 6.7% throughout the 1960s. In the fiscal year 1969–70, the poverty incidence rate decreased to 46%. Per Capita GNP was Rs. 504 in West Pakistan and Rs. 314 in East Pakistan, indicating a widening regional economic disparity.[46]
1970s[edit | edit source]
The economic landscape in the early 1970s witnessed growing disparities between East and West Pakistan, leading to East Pakistan's declaration of independence and the emergence of Bangladesh in 1971. Subsequently, Pakistan underwent notable transformations in both its political and economic spheres.
Under martial law authorities, amidst challenging macroeconomic conditions, the socialist Pakistan People's Party gained empowerment. This period grappled with numerous economic challenges, including a surge in poverty incidence to 55% during 1971–72. Pakistan also confronted heightened import costs due to the global oil price shock in October 1973, a severe global recession from 1974 to 1977, cotton sector failures in 1974–75, pest infestations affecting crops, and massive floods in 1973, 1974, and 1976–77.
One significant economic issue during this time was high inflation, with prices increasing by an average of 15% per annum between 1972 and 1977. The fiscal deficit/GDP ratio averaged 8.1% during 1973–77, indicating substantial fiscal challenges. Trade imbalances were apparent, with trade deficits rising from US$337 million in 1970–71 to US$1,184 million in 1976–77.
The military coup d'état of 1977, leading to the establishment of a martial law regime that initiated denationalization, deregulation, and privatization policies. Agriculture experienced modest growth at a rate of 2.4% per annum, while large-scale manufacturing expanded at a rate of 5.5% per annum during the 1970s.
Large and medium-scale private manufacturing played a significant role, contributing 75% of the total value-added and investment in manufacturing during the 1970s. The remaining 25% of value-added came from small-scale manufacturing.
Overall, this period was marked by significant political and economic changes, driven by challenges posed by economic disparities, political shifts, and efforts to address issues such as inflation, fiscal deficits, and trade imbalances.[46]
1980s[edit | edit source]
The 1980s brought substantial changes to Pakistan's economic landscape, moving away from the nationalization policies of the 1970s and fostering private sector industrial investment, which greatly contributed to robust economic growth. Notable developments in this era included a drop in the poverty headcount ratio to 29.1% in 1986–87, showcasing a decline in poverty incidence. The unemployment rate exhibited a positive trend, decreasing from 3.7% in 1980 to 2.6% in 1990.
Between 1985 and 1988, the government endeavored to implement an Islamic interest-free banking system, introducing business partnerships based on profit and loss sharing. The national savings/GDP ratio reached a notable 16% in 1986–87, largely due to significant worker remittances from the Middle East. Despite this growth, challenges emerged, including negative public savings and a declining public investment/GDP ratio throughout the 1980s.
To address increasing budget deficits in the early 1980s, the government heavily relied on non-bank domestic borrowing, resulting in substantial domestic debt growth. Consequently, the public debt/GDP ratio surged to 77.1% in 1988, 81.9% in 1989, and 82.6% in 1990, leading to significant interest payments and persistent fiscal deficits.
In 1985, democracy was restored in Pakistan, marking a pivotal political development. The country experienced a commendable average annual GDP growth rate of 6.3% between 1980 and 1990. The 1980s saw a surge in manufacturing exports, with an annual large-scale manufacturing growth rate of 8.8%, and solid growth in agriculture, with an annual agricultural growth rate of 5.4%.
These highlights underscore a transformative and recovering economic period in the 1980s, characterized by a shift in economic policies, improved fiscal performance, and substantial progress in poverty reduction and employment. The era also witnessed efforts to align financial practices with Islamic principles and significant economic growth in the manufacturing and agricultural sectors.[46]
1990s[edit | edit source]
The 1990s posed a formidable economic landscape for Pakistan, marked by a series of challenges and developments. Declining worker remittances and escalating external deficits set the tone for economic strains. Simultaneously, the decade witnessed the second-worst inflation in Pakistan's history, driven by diminishing GDP growth rates. Unemployment surged, reaching 5.9% in 1991 and escalating further to 7.2% in 2000.
Pakistan's external debt tripled, soaring to US$30 billion by 1995. The external debt/GDP ratio rose from 42% to 50%, accompanied by increases in the external debt/exports ratio (from 209% to 258%) and the debt service ratio (from 18% to 27%). A deteriorating external debt profile led to a rise in domestic debt, reaching Rs. 909 billion, and a domestic debt/GDP ratio of 42%.
The late 1990s witnessed a severe debt crisis, with the public debt/GDP ratio skyrocketing from 57.5% in 1975–77 to 102% in 1998–99. The public debt/revenues ratio surged to 624%, and the interest payments/revenues ratio reached 42.6%, rendering Pakistan's public debt unsustainable. Concerns over external debt default emerged in 1996 and 1998, triggered by Western economic sanctions in response to Pakistan's nuclear tests in May 1998, causing massive capital flight.
Despite these challenges, Pakistan managed to sustain an agricultural growth rate of 4.4% per annum and a large-scale manufacturing growth rate of 4.8% per annum throughout the 1990s. However, the era witnessed a significant increase in poverty incidence, reaching 30.6% in 1998–99. The decade encapsulated a complex economic narrative, as Pakistan navigated external debt burdens, fiscal imbalances, inflation, and rising unemployment. Amid these difficulties, there were positive aspects, including growth in key sectors like agriculture and manufacturing. Nonetheless, the 1990s also brought forth a looming threat of debt default, magnified by economic sanctions in response to nuclear tests.[46]
2000s[edit | edit source]
The 2000s witnessed a period of substantial economic challenges and transformations for Pakistan. The impact of high public debt gained prominence, identified by the official Debt Reduction and Management Committee in 2001, contributing to a decline in the growth rate to less than 4% per annum. Despite an initial upturn in the growth rate, the decade unfolded with persistent macroeconomic crises. Although achieving a noteworthy growth rate of 8.6% in 2004–05, subsequent years were marred by a series of setbacks, including a growth slowdown, low growth, high inflation, an energy crisis, and worsening fiscal and balance of payments positions.
The economic landscape reflected the complexities faced by the population, illustrated by a rise in poverty incidence to 34.5% in 2000–01. However, a subsequent decrease to 22.3% in 2005–06 offered a nuanced perspective on the decade's economic trajectory. The unemployment rate saw fluctuations, rising to 7.8% in 2002 but later declining to 5% by 2008.
Efforts to enhance education and literacy rates were evident as adult literacy stood at 55% in 2007–08. Nevertheless, challenges persisted, and economic crises hit Pakistan in 2008, primarily influenced by the 2008 financial crisis. Despite these adversities, economic growth in 2009–2010 reached a respectable 4.1%, with positive contributions from various sectors, including a 2% growth in agriculture, 4.9% growth in industrial output, 4.4% growth in large-scale manufacturing, and a 4.6% expansion in the services sector.
By March 2010, public debt had accumulated to Rs. 8,160 billion, with a total public debt/GDP ratio of 56% and a foreign-currency denominated debt/GDP ratio of 25%. Amid these economic dynamics, Pakistan underwent a structural transition. The GDP share of agriculture declined from 53% in 1947 to 21.2% in 2010, while the GDP share of industry rose from 9.6% in 1949–50 to 25.4% in 2010. Additionally, the GDP share of the services sector increased from 37.2% in 1950 to 53.4% in 2010. The 2000s encapsulated a multifaceted economic narrative for Pakistan, marked by challenges, crises, and significant structural shifts, reflecting the nation's resilience and adaptability.[46]
In late 2021, Pakistan entered a severe economic crisis as inflation surged, the rupee plunged in value, gas supplies dried up, foreign reserves declined and debt increased significantly.[47][48][49]
Data[edit | edit source]
Gross domestic product (GDP)[edit | edit source]
The table below displays key economic indicators from 1980 to 2025. Inflation rates below 5% are highlighted in green.[34]
| Year | GDP
(Billion US$ PPP) |
GDP per capita
(US$ PPP) |
GDP
(Billion US$ nominal) |
GDP per capita
(US$ nominal) |
GDP growth
(Real) |
Inflation rate
(Percent) |
Unemployment
(Percent) |
Government debt
(% of GDP) |
|---|---|---|---|---|---|---|---|---|
| 1980 | 75 | 950.0 | 38.6 | 418.9 | 6.9%
|
 11.9% 11.9%
|
n/a | n/a |
| 1981 | 87
|
1,072.8
|
45.7
|
481.3
|
6.2%
|
11.9%
|
n/a | n/a |
| 1982 | 100
|
1,190.0
|
49.9
|
511.0
|
7.6%
|
5.9%
|
n/a | n/a |
| 1983 | 110
|
1,283.6
|
 46.6 46.6
|
463.7
|
6.8%
|
6.4%
|
3.9% | n/a |
| 1984 | 119
|
1,345.3
|
50.6
|
489.8
|
4.0%
|
6.1%
|
 3.8% 3.8%
|
n/a |
| 1985 | 133
|
1,468.4
|
 50.6 50.6
|
476.7
|
8.7%
|
5.6%
|
3.7%
|
n/a |
| 1986 | 145
|
1,551.3
|
51.8
|
475.3
|
6.4%
|
3.5%
|
3.3%
|
n/a |
| 1987 | 157
|
1,638.5
|
54.2
|
483.9
|
5.8%
|
4.7%
|
3.1%
|
n/a |
| 1988 | 173
|
1,759.4
|
62.4
|
543.1
|
6.4%
|
8.8%
|
3.1%
|
n/a |
| 1989 | 188
|
1,868.3
|
65.0
|
552.0
|
4.8%
|
7.9%
|
3.1%
|
n/a |
| 1990 | 204
|
1,970.1
|
65.3
|
538.4
|
4.6%
|
9.1%
|
3.1%
|
n/a |
| 1991 | 222
|
2,094.8
|
74.2
|
598.4
|
5.4%
|
12.6%
|
5.9%
|
n/a |
| 1992 | 244
|
2,211.1
|
79.3
|
614.2
|
7.6%
|
4.8%
|
5.9%
|
n/a |
| 1993 | 255
|
2,252.4
|
83.4
|
633.6
|
2.1%
|
9.8%
|
4.7%
|
n/a |
| 1994 | 272
|
2,341.1
|
84.6
|
622.8
|
4.4%
|
11.3%
|
4.8%
|
64.8% |
| 1995 | 292
|
2,449.6
|
98.9
|
709.9
|
5.1%
|
13.0%
|
5.4%
|
58.0%
|
| 1996 | 317
|
2,594.8
|
103.3
|
723.5
|
6.6%
|
10.8%
|
5.4%
|
58.2%
|
| 1997 | 328
|
2,620.8
|
101.8
|
696.4
|
1.7%
|
12.8%
|
6.1%
|
58.5%
|
| 1998 | 343
|
2,678.9
|
101.4
|
677.0
|
3.5%
|
6.8%
|
5.9%
|
59.5%
|
| 1999 | 363
|
2,765.6
|
96.0
|
626.5
|
4.2%
|
5.7%
|
5.9%
|
67.2%
|
| 2000 | 385
|
2,855.1
|
99.4
|
630.3
|
3.9%
|
3.6%
|
7.8%
|
68.4%
|
| 2001 | 408
|
2,916.7
|
96.8
|
602.0
|
3.7%
|
4.4%
|
7.8%
|
72.2%
|
| 2002 | 425
|
2,995.0
|
98.2
|
593.9
|
2.4%
|
3.5%
|
8.3%
|
67.6%
|
| 2003 | 456
|
3,119.8
|
112.5
|
666.1
|
5.6%
|
3.1%
|
8.3%
|
62.7%
|
| 2004 | 505
|
3,376.5
|
132.2
|
767.8
|
7.7%
|
4.6%
|
7.7%
|
56.3%
|
| 2005 | 562
|
3,722.9
|
145.2
|
842.0
|
7.5%
|
9.3%
|
7.7%
|
52.3%
|
| 2006 | 612
|
3,986.8
|
161.9
|
961.4
|
5.6%
|
7.9%
|
6.2%
|
48.4%
|
| 2007 | 661
|
4,244.6
|
184.1
|
1,048.4
|
5.5%
|
7.8%
|
5.2%
|
47.1%
|
| 2008 | 704
|
4,362.9
|
202.2
|
1,124.0
|
5.0%
|
12.0%
|
5.2%
|
51.9%
|
| 2009 | 715
|
4,240.5
|
187.1
|
1,186.5
|
0.4%
|
19.6%
|
5.5%
|
52.8%
|
| 2010 | 740
|
4,283.3
|
196.7
|
1,122.7
|
2.6%
|
10.1%
|
6.0%
|
54.5%
|
| 2011 | 780
|
4,403.0
|
230.6
|
1,325.8
|
3.6%
|
13.7%
|
6.0%
|
52.8%
|
| 2012 | 820
|
4,516.4
|
250.1
|
1,364.8
|
3.8%
|
11.0%
|
6.0%
|
56.7%
|
| 2013 | 866
|
4,655.3
|
258.7
|
1,378.6
|
3.7%
|
7.4%
|
6.0%
|
57.9%
|
| 2014 | 912
|
4,786.2
|
271.4
|
1,428.4
|
4.1%
|
8.6%
|
6.0%
|
57.1%
|
| 2015 | 956
|
4,893.3
|
299.9
|
1,550.5
|
4.1%
|
4.5%
|
5.9%
|
57.0%
|
| 2016 | 1,004
|
5,016.6
|
313.6
|
1,566.6
|
4.6%
|
2.9%
|
5.9%
|
60.8%
|
| 2017 | 1,069
|
5,212.2
|
339.2
|
1,653.4
|
4.6%
|
4.1%
|
5.8%
|
60.9%
|
| 2018 | 1,130
|
5,387.2
|
356.2
|
1,698.0
|
6.1%
|
3.9%
|
5.8%
|
64.8%
|
| 2019 | 1,163
|
5,434.3
|
321.1
|
1,500.7
|
3.1%
|
6.7%
|
6.9%
|
78.7%
|
| 2020 | 1,186
|
5,435.7
|
300.4
|
1,376.5
|
-0.9%
|
10.7%
|
6.6%
|
80.8%
|
| 2021 | 1,285
|
5,774.5
|
348.5
|
1,565.6
|
5.8%
|
8.9%
|
6.3%
|
74.7%
|
| 2022 | 1,462
|
6,440.9
|
374.8
|
1651.3
|
6.2%
|
12.2%
|
6.2%
|
77.3%
|
| 2023 | 1,512
|
6,530.9
|
337.8
|
1,459
|
-0.2%
|
29.2%
|
8.5%
|
78.2%
|
| 2024 | 1,587
|
6,724
|
373.1
|
1,581
|
2.5%
|
Template:Increasenegative23.4% | 8.2%
|
70.1%
|
| 2025 | 1,672
|
6,951
|
n/a | n/a | 2.6%
|
Template:Increasenegative5.1% | 8.0%
|
Template:Increasenegative73.6% |
Stock market[edit | edit source]

In the first four years of the twenty-first century, Pakistan's KSE 100 Index was declared the best-performing stock market index in the world by the international magazine "Business Week".[50][citation needed] The stock market capitalization of listed companies in Pakistan was valued at $5,937 million in 2005 by the World Bank.[51] On 11 January 2016, with the aim of reducing market fragmentation and creating a strong case for attracting strategic partnerships necessary for providing technological expertise, all three stock exchanges, including Karachi Stock Exchange, Lahore Stock Exchange, and Islamabad Stock Exchange, were inducted into a unified Pakistan Stock Exchange.[52]
In May 2017, the American provider of stock market indexes and analysis tools, MSCI, confirmed that the Pakistan Stock Exchange (PSX) had been reclassified from Frontier Markets to Emerging Markets in its semi-annual index review.[53] The Pakistan Stock Exchange also successfully navigated through the initial COVID-19 induced economic downturn and earned the title of being the 'best Asian stock market and fourth best-performing market across the world in 2020.' The PSE-100 index continued to climb throughout the year. Nearly 40 percent growth in the PSE-100 Index in FY 2021 was driven by the government's large stimulus package, the central bank's stable policy rate, an uptick in large scale manufacturing, improvement in external accounts, and reforms introduced by the Security and Exchange Commission of Pakistan (SECP) and PSX in the wake of the COVID-19.[54]
PSX 100 index growth rate over the previous years is as follows:[55]
| List | FY 2008 | FY 2009 | FY 2010 | FY 2011 | FY 2012 | FY 2013 | FY 2014 | FY 2015 | FY 2016 | FY 2017 | FY 2018 | FY 2019 | FY 2020 | FY 2021 | FY 2022 | FY 2023 | FY 2024 |
|---|---|---|---|---|---|---|---|---|---|---|---|---|---|---|---|---|---|
| PSX 100 index growth % | -10.8
|
-41.7
|
35.7
|
28.5
|
10.4
|
52.2
|
41.2
|
16.0
|
9.8
|
23.2
|
-10.0
|
-19.1
|
1.5
|
37.6
|
-12.3
|
-0.2
|
89.2
|
The sales of all non-financial companies surged to Rs 16,815 billion in the fiscal year 2023, marking a substantial increase of Rs 1,864 billion compared to the preceding year. However, the net profit margin of all companies declined to 5.98% in FY23 from 6.34% in FY22. Return on assets (ROA) and return on equity (ROE) of all companies also dropped to 6.05 percent and 17.76 percent respectively in FY23. The key statistics for the last six years of all public and private non-financial companies listed at the Pakistan Stock Exchange are provided in the following table:[56]
| List | 2018 | 2019 | 2020 | 2021 | 2022 | 2023 |
|---|---|---|---|---|---|---|
| Total assets | 8,811
|
10,097
|
10,755
|
12,201
|
15,685
|
17,549
|
| Total liabilities | 5,574
|
6,610
|
7,029
|
7,869
|
10,568
|
11,346
|
| Total sales | 7,662
|
8,811
|
7,999
|
9,437
|
14,568
|
16,815
|
| Profit before tax | 608
|
612
|
480
|
1,011
|
1,439
|
1,624
|
| Profit after tax | 427
|
413
|
320
|
749
|
924
|
1,005
|
| % | ||||||
| Net profit margin | 5.57
|
4.68
|
4.00
|
7.93
|
6.34
|
5.98
|
| Return on assets | 5.19
|
4.36
|
3.07
|
6.52
|
6.63
|
6.05
|
| Return on equity | 13.65
|
12.27
|
8.87
|
18.59
|
19.56
|
17.76
|
| Earnings per share | 4.43
|
4.17
|
3.15
|
7.07
|
8.31
|
8.32
|
Informal economy[edit | edit source]
The informal economy in Pakistan comprises economic activities and assets that are not fully captured by formal regulation, taxation, or national accounts. Estimates of its size vary according to methodology and definitions, but multiple sources indicate that the informal sector remains a substantial component of the country’s economic structure. A Dawn analysis noted that the documented economy was estimated at about US $340 billion in 2023, whereas the informal economy was projected at roughly US $457 billion, indicating that the informal economy may exceed the formal economy in overall size.[57]
According to a recent labour force survey, 72.1% of non-agricultural employment was classified as informal in 2024–25, with informal work particularly prevalent in rural areas.[58] The informal economy in Pakistan includes a wide range of activities such as unregistered manufacturing, retail, construction, transport, domestic work, and small enterprises. While it provides livelihoods for many households, its unrecorded nature complicates taxation and regulation, and policymakers have periodically highlighted the challenges and fiscal implications of informality.[59]
Households also accumulate physical commodities such as gold and jewellery as part of their saving strategies; a significant portion of savings in Pakistan resides in informal instruments and physical assets, including gold, which are not entirely captured by formal statistics. Historical estimates once suggest Pakistanis might hold 3,000 to 5,000 tonnes of gold, indicating a possible range of US $40 billion to US $70 billion in household gold wealth as of 2025.[60]
Middle class[edit | edit source]

As of 2017[update], according to the Wall Street Journal, citing estimates largely based on income and the purchase of consumption goods, had suggested that as many as 42% of Pakistan's population may now belong to the upper and middle classes. If these numbers are correct, or even indicative in any broad sense, then 87 million Pakistanis belong to the middle and upper classes, a population size which is larger than that of Germany.[61] Official figures also show that the proportion of households that own a motorcycle and washing machines has grown impressively over the past 15 years.[62] Furthermore, the IBA-SBP Consumer Confidence Index recorded its highest-ever level of 174.9 points in January 2017, showing an increase of 17 points from July 2016.
Separately, consumer financing recorded at Rs. 179 billion during FY 2022. Auto finance continued to be the dominant segment, followed by house building, which showed remarkable growth after the Mera Pakistan Mera Ghar scheme initiated by the State Bank of Pakistan in December 2020.[61][63]
Poverty alleviation expenditures[edit | edit source]
The Pakistan government spent over 1 trillion rupees (about $16.7 billion) on poverty alleviation programs during the past four years, reducing poverty from 35% in 2000–01 to 29.3% in 2013 and further to 17% in 2015.[64] Rural poverty remains a pressing issue, as development in those areas has been significantly slower than in major urban areas.
However, according to a World Bank report released in June 2025, around 45% of Pakistan's population was living below the poverty line. The updated figure was based on revised poverty thresholds and survey data from 2018 to 2019. The report also noted a sharp rise in extreme poverty, with the proportion increasing from 4.9% to 16.5%.[65] As of 2025, the World Bank cautioned that over 10 million additional individuals in Pakistan faced the looming threat of descending into poverty.[66]
Employment[edit | edit source]
The high population growth in the past few decades has led to a significant number of young people entering the labor market. Although Pakistan is among the six most populous Asian nations, excessive red tape in the past made firing from jobs, and consequently hiring, difficult.[67] Significant progress in taxation and business reforms has ensured that many firms are no longer compelled to operate in the underground economy.[68]
Government revenues and expenditures[edit | edit source]

Although the country is a Federation with constitutional division of taxation powers between the Federal Government and the four provinces, the revenue department of the Federal Government, the Federal Board of Revenue, collects more than 80% of the entire national tax collection. The government's revenue streams primarily stem from two sources: taxation and non-tax revenue. Taxation, which includes income tax, sales tax, and customs duties, constitutes a substantial portion of revenues, bolstering both federal and provincial government finances. Non-tax revenue sources, such as mark-up from state enterprises, surplus profits from the State Bank of Pakistan, and royalties on oil and gas, further contribute significantly to the fiscal framework.
Conversely, government expenditures are strategically allocated across multiple sectors, including defense, social services, infrastructure development, and debt servicing. Current expenditures, covering operational costs, interest payments, pensions, and other obligations, are carefully balanced against development expenditures aimed at fostering long-term growth and progress. The challenge of achieving equilibrium between revenue generation and expenditure allocation leads to budgetary deficits that can necessitate borrowing to bridge the gap.
The data has been sourced from the Ministry of Finance.[69]
| List | FY 2008 | FY 2009 | FY 2010 | FY 2011 | FY 2012 | FY 2013 | FY 2014 | FY 2015 | FY 2016 | FY 2017 | FY 2018 | FY 2019 | FY 2020 | FY 2021 | FY 2022 | FY 2023 | FY2024 | FY 2025 |
|---|---|---|---|---|---|---|---|---|---|---|---|---|---|---|---|---|---|---|
| Total revenue | 1,499
|
1,851
|
2,078
|
2,253
|
2,567
|
2,982
|
3,637
|
3,931
|
4,447
|
4,937
|
5,228
|
4,901
|
6,272
|
6,903
|
8,035
|
9,634
|
13,269
|
17,997
|
| Tax revenue | 1,065
|
1,317
|
1,473
|
1,699
|
2,053
|
2,199
|
2,565
|
3,018
|
3,660
|
3,969
|
4,467
|
4,473
|
4,748
|
5,272
|
6,755
|
7,819
|
10,085
|
12,723
|
| FBR taxes | 1,008
|
1,161
|
1,327
|
1,558
|
1,883
|
1,946
|
2,255
|
2,590
|
3,113
|
3,368
|
3,842
|
3,830
|
3,998
|
4,764
|
6,143
|
7,169
|
9,311
|
11,744
|
| Total expenditure | 2,277
|
2,531
|
3,007
|
3,447
|
3,936
|
4,816
|
5,026
|
5,388
|
5,796
|
6,801
|
7,488
|
8,346
|
9,649
|
10,307
|
13,295
|
16,155
|
20,476
|
24,166
|
| Fiscal deficit | 777
|
680
|
929
|
1,194
|
1,370
|
1,834
|
1,389
|
1,457
|
1,349
|
1,864
|
2,260
|
3,445
|
3,376
|
3,403
|
5,260
|
6,521
|
7,207
|
6,168
|
| As % of GDP | ||||||||||||||||||
| Total Revenue | 14.1
|
14.0
|
14.0
|
12.3
|
12.8
|
13.3
|
14.5
|
14.3
|
13.6
|
13.9
|
13.3
|
11.2
|
13.2
|
12.4
|
12.0
|
11.4
|
12.5
|
15.7
|
| Tax revenue | 9.9
|
9.1
|
9.9
|
9.3
|
10.2
|
9.8
|
10.2
|
11.0
|
10.4
|
10.4
|
10.8
|
9.7
|
9.3
|
9.4
|
10.1
|
9.2
|
9.5
|
11.1
|
| Total expenditure | 21.4
|
Template:Decreasepositive19.2 | 20.2
|
18.9
|
21.4
|
21.5
|
20.0
|
19.6
|
17.7
|
19.1
|
19.1
|
19.1
|
20.3
|
18.5
|
19.9
|
19.1
|
19.3
|
21.1
|
| Fiscal deficit | 7.3
|
Template:Decreasepositive5.2 | 6.2
|
6.5
|
8.8
|
Template:Decreasepositive8.2 | 5.5
|
5.3
|
4.1
|
5.2
|
5.8
|
7.9
|
7.1
|
6.1
|
7.9
|
7.7
|
6.8
|
5.4
|
Currency system[edit | edit source]
Rupee[edit | edit source]
The basic unit of currency is the rupee, ISO code PKR, and abbreviated Rs, which is divided into 100 paisas. Currently, the 5,000 rupee note is the largest denomination in circulation. From 13 August 2005, the SBP started introducing its fifth generation design of banknotes with additional security features, with the Rs. 20 note being the first issuance. New designs of Rs. 5 (July 2008, later replaced by a coin), 10 (May 2006), Rs. 20 (March 2008, new color scheme), Rs. 50 (July 2008), Rs. 100 (November 2006), Rs. 500 (January 2010), Rs. 1000 (February 2007), and Rs. 5000 (May 2006) were gradually introduced.[70][71][72]
The Pakistani rupee was pegged to the pound sterling until 1982, when the government of General Zia-ul-Haq, changed it to a managed float regime. As a result, the rupee devalued by 38.5% between 1982/83, and many of the industries built by his predecessor suffered a huge surge in import costs. After years of appreciation under Zulfikar Ali Bhutto and despite huge increases in foreign aid, the rupee depreciated.
Foreign exchange rate[edit | edit source]
The Pakistani rupee depreciated against the US dollar until around the start of the 21st century, when Pakistan's large current-account surplus pushed the value of the rupee up versus the dollar. Pakistan's central bank then stabilized by lowering interest rates and buying dollars, in order to preserve the country's export competitiveness.
| 2008 | 2009 | 2010 | 2011 | 2012 | 2013 | 2014 | 2015 | 2016 | 2017 | 2018 | 2019 | 2020 | 2021 | 2022 | 2023 | 2024 | 2025 |
|---|---|---|---|---|---|---|---|---|---|---|---|---|---|---|---|---|---|
| 62.55
|
78.50
|
83.80
|
85.50
|
89.23
|
96.73
|
102.86
|
101.29
|
104.23
|
104.70
|
109.84
|
136.09
|
158.02
|
160.02
|
177.45
|
248.04
|
282.90
|
279.35
|
Foreign exchange reserves[edit | edit source]
Pakistan maintains foreign reserves with the State Bank of Pakistan. The currency of the reserves was solely the US dollar, incurring speculated losses after the dollar prices fell during 2005, forcing the then Governor SBP Ishrat Hussain to step down. In the same year, the SBP issued an official statement proclaiming diversification of reserves in currencies including Euro and Yen, withholding the ratio of diversification.

Following the international credit crisis and spikes in crude oil prices, Pakistan's economy could not withstand the pressure, and on 11 October 2008, the State Bank of Pakistan reported that the country's foreign exchange reserves had gone down by $571.9 million to $7,749.7 million.[74] The foreign exchange reserves had declined by more than $10 billion to a level of $6.59 billion. In June 2013, Pakistan was on the brink of default on its financial commitments. The country's forex reserves were at a historic low, covering only two weeks' worth of imports. In January 2020, Pakistan's foreign exchange reserves stood at US$11.503 billion.[75]
| List | Jun 2008 | Jun 2009 | Jun 2010 | Jun 2011 | Jun 2012 | Jun 2013 | Jun 2014 | Jun 2015 | Jun 2016 | Jun 2017 | Jun 2018 | Jun 2019 | Jun 2020 | Jun 2021 | Jun 2022 | Jun 2023 | Jun 2024 | Jun 2025 |
|---|---|---|---|---|---|---|---|---|---|---|---|---|---|---|---|---|---|---|
| Total reserves | 11.4
|
12.4
|
16.8
|
18.2
|
15.3
|
11.0
|
14.1
|
18.7
|
23.1
|
21.4
|
16.4
|
14.5
|
18.9
|
24.4
|
15.5
|
9.2
|
14.0
|
19.3
|
| SBP reserves | 8.6 | 9.1 | 13.0 | 14.8 | 10.8 | 6.0 | 9.1 | 13.5 | 18.1 | 16.1 | 9.8 | 7.3 | 12.1 | 17.3 | 9.9 | 4.5 | 9.4 | 14.5 |
| Banks reserves | 2.8 | 3.3 | 3.8 | 3.5 | 4.5 | 5.0 | 5.0 | 5.2 | 5.0 | 5.3 | 6.6 | 7.2 | 6.8 | 7.1 | 5.6 | 4.7 | 4.6 | 4.8 |
Structure of economy[edit | edit source]
Agriculture accounted for about 53% of the GDP in 1947. While per-capita agricultural output has grown since then, it has been outpaced by the growth of the non-agricultural sectors, and the share of agriculture has dropped to roughly one-fifth of Pakistan's economy. In recent years, the country has seen rapid growth in industries, such as apparel, textiles, and cement, and services, such as telecommunications, transportation, advertising, and finance.
| Sectors | FY 2000 | FY 2005 | FY 2010 | FY 2015 | FY 2020 | FY 2025 |
|---|---|---|---|---|---|---|
| Agricultural | 31.75
|
28.15
|
25.89
|
24.83
|
23.53
|
23.54
|
| Industrial | 16.73
|
19.01
|
19.04
|
19.11
|
18.53
|
18.07
|
| Services | 51.52
|
52.84
|
55.07
|
56.06
|
57.94
|
58.39
|
Major sectors[edit | edit source]
Agriculture[edit | edit source]

The majority of the population, directly or indirectly, is dependent on this sector, contributing about 23.0% of the gross domestic product (GDP) and accounting for 37.4% of the employed labor force in 2021. It is the largest source of foreign exchange earnings.[79] The most important crops are wheat, sugarcane, cotton, and rice, accounting for more than 75% of the value of total crop output. Pakistan's largest food crop is wheat. In 2017, Pakistan produced 26,674,000 tonnes of wheat, almost equal to all of Africa (27.1 million tonnes) and more than all of South America (25.9 million tonnes), according to the FAOSTAT.[80] In the market year of 2018/19, Pakistan exported a record 4.5 million tonnes of rice.[81]
Pakistan is a net food exporter, except in occasional years when its harvest is adversely affected by droughts. Pakistan exports rice, cotton, fish, fruits (especially Oranges and Mangoes), and vegetables and imports vegetable oil, wheat, pulses, and consumer foods.[82] The economic importance of agriculture has declined since independence when its share of GDP was around 53%.
| List | FY 2008 | FY 2009 | FY 2010 | FY 2011 | FY 2012 | FY 2013 | FY 2014 | FY 2015 | FY 2016 | FY 2017 | FY 2018 | FY 2019 | FY 2020 | FY 2021 | FY 2022 | FY 2023 | FY 2024 | FY 2025 |
|---|---|---|---|---|---|---|---|---|---|---|---|---|---|---|---|---|---|---|
| Agriculture sector | 0.81
|
3.41
|
0.31
|
2.71
|
3.23
|
3.14
|
2.42
|
1.78
|
0.41
|
2.22
|
3.88
|
0.94
|
3.91
|
3.52
|
4.21
|
2.24
|
6.40
|
0.56
|
| Production of important crops (million tonnes) | ||||||||||||||||||
| Wheat | 20.9
|
24.0
|
23.3
|
25.2
|
23.5
|
24.2
|
26.0
|
25.1
|
25.6
|
26.7
|
25.1
|
24.3
|
25.2
|
27.5
|
26.2
|
28.2
|
31.8
|
28.4
|
| Rice | 5.6
|
6.9
|
6.9
|
4.8
|
6.2
|
5.6
|
6.8
|
7.0
|
6.8
|
6.8
|
7.5
|
7.2
|
7.4
|
8.4
|
9.3
|
7.3
|
9.9
|
9.7
|
| Sugarcane | 63.9
|
50.0
|
49.4
|
55.3
|
58.4
|
63.8
|
67.5
|
62.8
|
65.5
|
75.5
|
83.3
|
67.2
|
66.4
|
81.0
|
88.7
|
88.0
|
87.6
|
84.2
|
| Cotton * | 11.7
|
11.8
|
12.9
|
11.5
|
13.6
|
13.0
|
12.8
|
14.0
|
9.9
|
10.7
|
11.9
|
9.9
|
9.1
|
7.1
|
8.3
|
4.9
|
10.2
|
7.1
|
| Maize / corn | 3.6
|
3.6
|
3.3
|
3.7
|
4.3
|
4.2
|
5.0
|
4.9
|
5.3
|
6.1
|
5.9
|
6.8
|
7.9
|
8.9
|
9.5
|
11.0
|
9.7
|
9.0
|
* Cotton production in million bales.
Pakistan's principal natural resources are arable land and water. About 25% of Pakistan's total land area is under cultivation and is watered by one of the largest irrigation systems in the world. Pakistan irrigates three times more acres than Russia. Pakistan agriculture also benefits from year-round warmth. Zarai Taraqiati Bank Limited is the largest financial institution geared towards the development of the agriculture sector through the provision of financial services and technical expertise.
Fishing[edit | edit source]
Forestry[edit | edit source]
Livestock[edit | edit source]
Industry[edit | edit source]

Pakistan's industrial sector accounts for approximately 19.12% of GDP.[78] In 2021, it recorded a growth of 7.81%, compared to the negative 5.75% in 2020.[84] The government is privatizing large-scale industrial units, and the public sector accounts for a shrinking proportion of industrial output, while growth in overall industrial output (including the private sector) has accelerated. Government policies aim to diversify the country's industrial base and bolster export industries. Large Scale Manufacturing is the fastest-growing sector in the Pakistani economy.[85] Major industries include textiles, fertiliser, cement, oil refineries, dairy products, food processing, beverages, construction materials, clothing, paper products, and shrimp.
In Pakistan, SMEs have a significant contribution to the total GDP of Pakistan. According to SMEDA and Economic survey reports, the share in the annual GDP is 40%, with SMEs generating significant employment opportunities for skilled workers and entrepreneurs. Small and medium-scale firms represent nearly 90% of all enterprises in Pakistan and employ 80% of the non-agricultural labor force. These figures indicate the potential and further growth in this sector.
| List | FY 2008 | FY 2009 | FY 2010 | FY 2011 | FY 2012 | FY 2013 | FY 2014 | FY 2015 | FY 2016 | FY 2017 | FY 2018 | FY 2019 | FY 2020 | FY 2021 | FY 2022 | FY 2023 | FY 2024 | FY 2025 |
|---|---|---|---|---|---|---|---|---|---|---|---|---|---|---|---|---|---|---|
| Industrial sector | 8.78
|
-4.15
|
3.95
|
4.87
|
2.33
|
1.16
|
4.34
|
5.40
|
6.01
|
4.61
|
9.18
|
0.25
|
-5.75
|
8.20
|
7.01
|
-3.88
|
-1.37
|
4.77 |
| Manufacturing | 6.14
|
-3.94
|
1.73
|
2.61
|
2.01
|
5.37
|
5.76
|
4.12
|
4.03
|
4.87
|
7.08
|
4.52
|
-7.80
|
10.52
|
10.86
|
-5.26
|
3.03
|
1.34 |
| Mining | 3.70
|
-1.04
|
2.42
|
-4.04
|
5.26
|
1.77
|
1.02
|
3.95
|
5.64
|
-0.89
|
7.26
|
0.54
|
-7.17
|
1.72
|
-6.66
|
-3.23
|
-4.02
|
-3.38 |
| Construction | 13.37
|
-6.70
|
7.27
|
-7.97
|
2.17
|
5.40
|
3.19
|
8.33
|
14.37
|
10.20
|
19.55
|
-18.14
|
-3.08
|
2.39
|
1.83
|
-10.25
|
-1.14
|
6.61 |
Manufacturing[edit | edit source]
Manufacturing is the largest of Pakistan's industrial sectors, accounting for approximately 12.13% of GDP.[86] The manufacturing sub-sector is further divided into three components: large-scale manufacturing (LSM) with a share of 79.6% in the manufacturing sector, small-scale manufacturing with a share of 13.8% in the manufacturing sector, while slaughtering contributes 6.5% to manufacturing.[87] Major sectors in industries include cement, fertiliser, edible oil, sugar, steel, tobacco, chemicals, machinery, food processing, and medical instruments, primarily surgical.[88][89][90] Pakistan is one of the largest manufacturers and exporters of surgical instruments.[91][92]
| Manufactured goods | Unit of quantity | 2016 | 2017 | 2018 | 2019 | 2020 | 2021 | 2022 | 2023 | 2024 |
|---|---|---|---|---|---|---|---|---|---|---|
| Cotton yarn | Metric tonne (000) | 3,406 | 3,428
|
3,430
|
3,431
|
3,060
|
3,442
|
3,459
|
2,695
|
2,477
|
| Jute goods | 55 | 60
|
74
|
67
|
65
|
70
|
58
|
63
|
41
| |
| Cooking oil | 380 | 390
|
391
|
406
|
442
|
460
|
510
|
567
|
642
| |
| Sugar | 5,115 | 7,049
|
6,566
|
5,260
|
4,881
|
5,694
|
7,921
|
6,709
|
6,796
| |
| Cement | 35,432 | 37,022
|
41,148
|
39,924
|
39,121
|
49,797
|
48,011
|
41,448
|
39,566
| |
| Paper & board | 610 | 669
|
731
|
704
|
707
|
730
|
825
|
792
|
787
| |
| Caustic soda | 225 | 224
|
270
|
247
|
342
|
394
|
405
|
476
|
497
| |
| Hydrogen chloride | 172 | 177
|
251
|
425
|
361
|
417
|
510
|
525
|
507
| |
| Sulphuric acid | 75 | 56
|
49
|
49
|
40
|
72
|
111
|
71
|
64
| |
| Vegetable ghee | 1,241 | 1,280
|
1,347
|
1,392
|
1,454
|
1,455
|
1,393
|
1,554
|
1,493
| |
| Cotton cloth | Million meters | 1,039 | 1,043
|
1,044
|
1,046
|
935
|
1,048
|
1,051
|
921
|
871
|
| Cigarettes | Billion | 54 | 34
|
59
|
61
|
46
|
52
|
60
|
43
|
33
|
| Nitrogenous fertilizers | NT (000) | 3,018 | 3,063
|
2,758
|
2,990
|
3,139
|
3,324
|
3,391
|
3,163
|
3,483
|
| Phosphatic fertilizers | 664 | 683
|
619
|
633
|
631
|
748
|
804
|
616
|
756
| |
| Cycle tyres & tubes | Numbers (000) | 11,490 | 11,507
|
11,470
|
14,491
|
13,496
|
10,314
|
10,876
|
10,702
|
10,943
|
| Motor tyres & tubes | 34,202 | 34,345
|
35,057
|
36,321
|
35,678
|
31,906
|
30,296
|
30,515
|
31,107
| |
| Motorcycles | 2,071 | 2,501
|
2,825
|
2,460
|
1,813
|
2,476
|
2,190
|
1,289
|
1,235
| |
| Bicycles | 199 | 200
|
200
|
174
|
141
|
79
|
141
|
146
|
159
| |
| Electric transformers | 33 | 37
|
47
|
31
|
23
|
29
|
35
|
32
|
22
| |
| Refrigerators | 1,477 | 1,834
|
1,348
|
1,084
|
716
|
1,351
|
1,389
|
1,008
|
818
| |
| Air conditioners | 388 | 471
|
451
|
518
|
216
|
508
|
540
|
347
|
224
| |
| Electric fans | 2,033 | 2,523
|
2,596
|
2,591
|
2,124
|
2,499
|
2,600
|
2,182
|
2,283
| |
| Electric meters | 1,310 | 1,923
|
1,715
|
1,550
|
1,039
|
1,419
|
2,030
|
2,038
|
2,117
| |
| Motor spirits/petrol | Million liters | 2,216 | 2,518
|
2,988
|
3,085
|
2,684
|
3,424
|
3,392
|
3,051
|
3,294
|
| High speed diesel | 5,236 | 5,467
|
6,283
|
5,665
|
4,529
|
5,612
|
5,615
|
4,655
|
5,340
| |
| Furnace oil | 3,080 | 3,215
|
3,478
|
3,063
|
2,370
|
2,717
|
2,567
|
2,191
|
2,633
| |
| Jeeps & cars | Numbers | 180,717 | 193,996
|
231,738
|
218,845
|
106,764
|
182,389
|
271,923
|
131,978
|
100,221
|
| Tractors | Numbers | 34,914 | 53,975
|
71,894
|
49,902
|
32,608
|
50,700
|
58,922
|
31,752
|
46,275
|
| Trucks & buses | Numbers | 8,331 | 10,548
|
13,425
|
9,684
|
4,848
|
5,977
|
7,934
|
4,839
|
3,240
|
Pakistan's largest corporations are primarily engaged in utilities such as oil, gas, electricity, automobile, cement, food, chemicals, fertilizer, civil aviation, textile, and telecommunication.
Their assets, sales, and profit/loss for the year 2023 are listed below:[94]
Cement industry[edit | edit source]
In 1947, Pakistan inherited four cement plants with a total capacity of 0.5 million tons. Some expansion occurred in 1956–66 but couldn't keep pace with economic development. The country resorted to cement imports in 1976–77, continuing until 1994–95. The cement sector, comprising 27 plants, contributes over Rs 30 billion to the national exchequer in taxes. By 2013, Pakistan's cement industry grew rapidly, driven by demand from Afghanistan and countries boosting the real estate sector. In April 2020, the government introduced an incentive package for the construction industry, including an amnesty scheme, tax exemptions, and a Rs 36 billion subsidy for Naya Pakistan Housing Scheme. Additionally, banks were directed to increase construction sector loans to 5 percent of their total loan book, and FED reduction on cement from Rs 2/kg to Rs 1.5/kg provided further impetus to the industry.[95]
| Indicators | 2008 | 2009 | 2010 | 2011 | 2012 | 2013 | 2014 | 2015 | 2016 | 2017 | 2018 | 2019 | 2020 | 2021 | 2022 | 2023 |
|---|---|---|---|---|---|---|---|---|---|---|---|---|---|---|---|---|
| Production capacity | 37.68 | 42.28 | 45.34 | 42.37 | 44.64 | 44.64 | 44.64 | 45.62 | 45.62 | 46.39 | 48.66 | 55.90 | 63.53 | 69.14 | 69.29 | 83.18 |
| Local dispatches | 22.58 | 20.33 | 23.57 | 22.00 | 23.95 | 25.06 | 26.15 | 28.20 | 33.00 | 35.65 | 41.15 | 40.34 | 39.97 | 48.12 | 47.64 | 40.01 |
| Exports | 7.72 | 10.98 | 10.65 | 9.43 | 8.57 | 8.37 | 8.14 | 7.20 | 5.87 | 4.66 | 4.75 | 6.54 | 7.85 | 9.31 | 5.26 | 4.57 |
| Total dispatches | 30.30 | 31.31 | 34.22 | 31.43 | 32.52 | 33.43 | 34.28 | 35.40 | 38.87 | 40.32 | 45.89 | 46.88 | 47.81 | 57.43 | 52.89 | 44.58 |
Fertilizer industry[edit | edit source]
There are nine urea manufacturing plants, one DAP, three NP, four SSP, two CAN, one SOP, and two plants of blended NPKs with a total production capacity of 9,172 thousand tonnes per annum in 2021. Urea is the main fertilizer, holding a 70 percent share in total production. The installed production capacity of 6,307 thousand tonnes per annum is sufficient to meet local demand, subject to the availability of uninterrupted gas and RLNG supply.
| Nutrients | 2008 | 2009 | 2010 | 2011 | 2012 | 2013 | 2014 | 2015 | 2016 | 2017 | 2018 | 2019 | 2020 | 2021 | 2022 |
|---|---|---|---|---|---|---|---|---|---|---|---|---|---|---|---|
| Nitrogen | 2925 | 3034 | 3476 | 3133 | 3207 | 2853 | 3185 | 3308 | 2672 | 3730 | 3435 | 3408 | 3415 | 3711 | 3838 |
| Phosphorus | 630 | 651 | 860 | 767 | 633 | 747 | 881 | 975 | 1007 | 1269 | 1279 | 1153 | 1084 | 1228 | 1093 |
| Potassium | 27 | 25 | 24 | 32 | 21 | 21 | 24 | 33 | 20 | 41 | 50 | 53 | 50 | 69 | 71 |
Defence industry[edit | edit source]

The defence industry of Pakistan, under the Ministry of Defence Production, was established in September 1951 to promote and coordinate the array of military production facilities that have emerged since independence. It is actively engaged in numerous joint production projects, such as the Al Khalid 2 tank, advanced trainer aircraft, combat aircraft, artillery systems like MRLS, combat and surveillance drones like GIDS Shahpar-1 and Shahpar-2, battle management and surveillance radars, electronic warfare systems, navy ships, and submarines.
Pakistan manufactures and sells weapons to over 40 countries, including European customers, generating $620 million annually. The country's sophisticated arms imports increased by 119 percent between 2004–2008 and 2009–13, with China providing 54 percent and the USA 27 percent of Pakistan's imports.
Furniture industry[edit | edit source]
Pharmaceutical industry[edit | edit source]
Textiles industry[edit | edit source]
Most of the textile industry is concentrated in Punjab. However, before 1990, the industry was predominantly located in Karachi.
Presently, the textile industry comprises two main segments: a highly organized large-scale sector and a considerably fragmented cottage/small-scale sector. The organized sector mainly includes integrated Textile Mills, housing numerous spinning units and a limited number of shuttle-less loom units. Conversely, the unorganized sector encompasses downstream industries like Weaving, Finishing, Garment, Towels, and Hosiery, all of which possess significant export potential. Within this sector, certain enterprises have expanded to an international scale and exhibit progressive business philosophies.

As of June 2021, the Pakistani textile industry comprised 517 textile units, including 40 composite units and 477 spinning units. This landscape also included 28,500 shuttle-less looms and 375,000 conventional looms. The growth of the spinning sector has been fueled by export demands and cotton production, with subsequent growth observed in the weaving and processing sector. Notably, independent air-jet weaving units have emerged, both as standalone entities and in conjunction with spinning or processing units.
A notable trend is the ongoing backward integration of some clothing units, while spinning units are actively developing weaving, finishing, and assembly capabilities to create a comprehensive supply chain. This symbiotic relationship between the textile and clothing sectors is leading to horizontal and vertical integration, often managed by the same entities or through business collaborations.[99]
This sector contributes nearly one-fourth of industrial value-added and provides employment to about 40 percent of the industrial labor force. Excluding seasonal and cyclical fluctuations, textile products have maintained an average share of about 60 percent in national exports.[citation needed]
Automobile industry[edit | edit source]

The auto sector constituted about 7 percent of LSM in 2021, contributing significantly to the country's industrial output.[100] Given government support and the removal of obstacles, the industrial expansion is expected to yield positive results soon. Many new investors have joined with commercial production, while existing players have already made substantial investments, with more in the pipeline. Among the automakers yet to start production, Proton, MG, and Volkswagen are poised to make a significant impact in the local passenger vehicle market. Meanwhile, KIA, Hyundai, Changan, and Prince DFSK have already commenced productions in Pakistan.[101]
| Type | 2006 | 2011 | 2016 | 2017 | 2018 | 2019 | 2020 | 2021 | 2022 | 2023 | 2024 | 2025 | |
|---|---|---|---|---|---|---|---|---|---|---|---|---|---|
| Car | P | 170,487 | 133,972 | 179,944 | 188,936 | 217,774 | 209,255 | 94,325 | 151,794 | 226,433 | 101,984 | 79,573 | 111,402 |
| S | 165,965 | 127,944 | 181,145 | 185,781 | 216,786 | 207,630 | 96,455 | 151,182 | 234,180 | 96,811 | 81,577 | 112,203 | |
| Truck | P | 4,518 | 2,901 | 5,666 | 7,712 | 9,326 | 6,035 | 2,945 | 3,808 | 5,659 | 3,074 | 2,204 | 4,366 |
| S | 4,273 | 2,942 | 5,550 | 7,499 | 9,331 | 5,828 | 3,088 | 3,695 | 5,802 | 3,182 | 2,187 | 4,444 | |
| Bus | P | 825 | 490 | 1,070 | 1,118 | 803 | 913 | 532 | 570 | 661 | 701 | 419 | 796 |
| S | 927 | 515 | 1,017 | 1,130 | 762 | 935 | 559 | 652 | 696 | 654 | 454 | 788 | |
| Jeep & pick-up | P | 21,624 | 20,025 | 36,609 | 27,795 | 42,778 | 31,978 | 15,633 | 31,073 | 44,421 | 31,333 | 21,084 | 36,807 |
| S | 21,471 | 18,553 | 36,534 | 27,338 | 42,006 | 33,016 | 15,507 | 30,215 | 45,087 | 30,067 | 22,250 | 35,820 | |
| Farm tractor | P | 48,887 | 70,770 | 34,914 | 53,975 | 71,894 | 49,902 | 32,608 | 50,751 | 58,880 | 31,726 | 45,529 | 28,607 |
| S | 48,802 | 69,203 | 33,986 | 54,992 | 70,887 | 50,405 | 32,727 | 50,920 | 58,947 | 30,942 | 45,484 | 29,192 | |
| 2/3 wheelers | P | 520,124 | 838,665 | 1,362,096 | 1,632,965 | 1,928,757 | 1,782,605 | 1,370,417 | 1,902,415 | 1,826,467 | 1,185,532 | 1,150,090 | 1,514,718 |
| S | 516,640 | 835,455 | 1,358,643 | 1,630,735 | 1,931,340 | 1,781,959 | 1,370,005 | 1,903,932 | 1,821,885 | 1,186,969 | 1,150,112 | 1,518,752 |
Note: These figures do not include the production/sale of companies which are not members of the Pakistan Automotive Manufacturers Association (PAMA).
After the entry of new models and brands by new entrants and due to the significantly low benchmark interest rate of 7%, consumer financing hit an all-time high in 2021. This trend started when a new Automotive Development Policy (2016–2021) was first approved by the ECC in its meeting held on 18 March 2016.
Such growth in demand for car financing was last seen during President Pervez Musharraf's regime (2001–2008) when banks, having ample liquidity, lent a significant amount for cars without checking borrowers' capabilities to repay the debt. Later, the car financing bubble burst when a large number of people defaulted on paying off the car financing.
| Jun 2006 | Jun 2007 | Jun 2010 | Jun 2015 | Jun 2016 | Jun 2017 | Jun 2018 | Jun 2019 | Jun 2020 | Jun 2021 | Jun 2022 | Jun 2023 | Jun 2024 |
|---|---|---|---|---|---|---|---|---|---|---|---|---|
| 97.78 | 105.44 | 64.20 | 85.12 | 111.96 | 154.25 | 193.60 | 215.46 | 211.11 | 308.10 | 367.85 | 293.728 | 230.501 |
Mining[edit | edit source]

Pakistan is endowed with significant mineral resources and is emerging as a very promising area for prospecting/exploration for mineral deposits. In the wake of the 18th amendment to the constitution, all the provinces are free to exploit and explore the mineral resources within their jurisdiction.
Mining and quarrying contribute 13.19% to the industrial sector, with its share in GDP being 2.4%.
In the recent past, exploration by government agencies as well as multinational mining companies presents ample evidence of the occurrences of sizeable mineral deposits. Recent discoveries of a thick oxidised zone underlain by sulphide zones in the shield area of the Punjab province, covered by thick alluvial cover, have opened new vistas for metallic minerals exploration. Pakistan has a large base for industrial minerals. The discovery of coal deposits with over 175 billion tonnes of reserves at Thar in the Sindh province has given an impetus to develop it as an alternative source of energy. There is vast potential for precious and dimension stones.
Extraction of principal minerals in the last 10 fiscal years is given in the table below:[103][104]
| Minerals | Unit of quantity | FY 2015 | FY 2016 | FY 2017 | FY 2018 | FY 2019 | FY 2020 | FY 2021 | FY 2022 | FY 2023 | FY 2024 |
|---|---|---|---|---|---|---|---|---|---|---|---|
| Coal | Metric ton (000) | 3,407 | 3,750
|
3,954
|
4,478
|
5,407
|
8,428
|
9,230
|
9,678
|
15,070
|
20,086
|
| Natural gas | MMCFT (000) | 1,466 | 1,482
|
1,472
|
1,459
|
1,437
|
1,317
|
1,279
|
1,308
|
1,190
|
1,141
|
| Crude oil | JSB (000) | 34,490 | 31,652
|
32,269
|
32,557
|
32,495
|
28,091
|
27,560
|
28,098
|
25,360
|
25,812
|
| Chromite | Metric ton | 100,516 | 69,333
|
105,238
|
97,420
|
138,244
|
121,435
|
134,000
|
195,000
|
156,000
|
259,000
|
| Dolomite | Metric ton | 223,117 | 666,755
|
301,124
|
488,825
|
472,474
|
302,045
|
388,000
|
487,000
|
544,000
|
502,000
|
| Gypsum | Metric ton (000) | 1,417 | 1,872
|
2,080
|
2,476
|
2,518
|
2,150
|
2,527
|
2,325
|
1,640
|
2,136
|
| Limestone | Metric ton (000) | 40,470 | 46,123
|
52,149
|
70,819
|
75,596
|
65,810
|
76,632
|
58,362
|
58,941
|
61,387
|
| Rock salt | Metric ton (000) | 2,136 | 3,553
|
3,534
|
3,654
|
3,799
|
3,369
|
3,366
|
2,716
|
2,907
|
3,200
|
| Sulphur | Metric ton | 19,730 | 14,869
|
23,740
|
22,040
|
20,715
|
19,948
|
19,000
|
16,000
|
11,690
|
7,200
|
| Barytes | Metric ton | 24,689 | 57,024
|
75,375
|
145,189
|
116,480
|
55,341
|
52,000
|
128,000
|
141,000
|
145,000
|
| Marble | Metric ton (000) | 2,816 | 4,747
|
4,906
|
8,813
|
7,736
|
5,797
|
7,917
|
6,626
|
5,714
|
7,490
|
Energy[edit | edit source]

The main sources of Pakistan's primary energy supplies are gas, oil, coal, liquefied natural gas (LNG), and hydroelectricity, with shares of 29%, 24%, 15%, 10%, and 11% respectively in 2022. Since coal mining began in the Thar desert and LNG imports from Qatar, coal and imported LNG increased their shares manyfold in just five years in the primary energy supplies of the country. The share of gas has decreased from 50% in 2005 to 24% in 2022, and oil, since 2015, from 35% to 27% in 2022, being largely replaced by coal and LNG. As Pakistan intends to generate around 8,800 megawatts of nuclear power by 2030, its share is also increasing gradually.
| Fiscal year | Unit | Gas | Oil | Coal | Hydro
electricity |
LNG | Nuclear
electricity |
LPG | Renewable
electricity |
Imported
electricity |
Total |
|---|---|---|---|---|---|---|---|---|---|---|---|
| 2005 | MTOE | 27.95
|
16.33
|
4.23
|
6.13
|
– | 0.67
|
0.25
|
– | 0.03
|
55.59
|
| %Share | 50.3
|
29.4
|
7.6
|
11.0
|
– | 1.2
|
0.5
|
– | 0.0
|
100 | |
| 2010 | MTOE | 30.81
|
19.81
|
4.62
|
6.71
|
– | 0.69
|
0.40
|
– | 0.06
|
63.09
|
| %Share | 48.8
|
31.4
|
7.3
|
10.6
|
– | 1.1
|
0.6
|
– | 0.1
|
100 | |
| 2015 | MTOE | 29.98
|
24.97
|
4.95
|
7.75
|
0.47
|
1.38
|
0.46
|
0.19
|
0.11
|
70.26
|
| %Share | 42.7
|
35.5
|
7.0
|
11.0
|
0.7
|
2.0
|
0.7
|
0.3
|
0.1
|
100 | |
| 2020 | MTOE | 26.66
|
18.19
|
14.71
|
8.02
|
8.32
|
2.58
|
1.03
|
0.99
|
0.12
|
80.62
|
| %Share | 33.0
|
26.7
|
18.2
|
9.9
|
10.3
|
3.2
|
1.3
|
1.2
|
0.2
|
100 | |
| 2023 | MTOE | 23.88
|
20.11
|
12.57
|
8.75
|
8.05
|
6.20
|
1.56
|
1.39
|
0.11
|
82.62 |
| %Share | 28.9
|
24.3
|
15.2
|
10.6
|
9.7
|
7.5
|
1.9
|
1.7
|
0.1
|
100 |
(CPPA-G) procures electricity from power producers, and the National Transmission and Despatch Company (NTDC) transmits this electricity via its transmission lines to Distribution Companies[106] (DISCOs), which then distribute this electricity via their distribution lines to end consumers. Balancing Pakistan's supply of electricity against the demand has been a longstanding unresolved issue. Since 2018, there has been an improvement in the availability of electricity due to the substantial increase in generation capacity. However, the cost of electricity has risen due to various factors such as circular debt, capacity payments, fuel costs, currency devaluation, low recovery rates, and transmission and distribution losses. Pakistan faces a significant challenge in overhauling its electricity supply network.
| Indicator | 2016 | 2017 | 2018 | 2019 | 2020 | 2021 | 2022 | 2023 | 2024 |
|---|---|---|---|---|---|---|---|---|---|
| Installed capacity (MW) | 25,421
|
28,712
|
35,979
|
38,995
|
38,719
|
39,772
|
43,835
|
45,738
|
45,888
|
| Electricity generation (GWh) | 114,093
|
120,622
|
133,588
|
137,005
|
134,242
|
143,589
|
154,056
|
138,539
|
137,196
|
| Electricity consumption (GWh) | 94,354
|
99,616
|
110,891
|
113,142
|
112,071
|
121,206
|
133,665
|
121,863
|
118,246
|
| Transmission losses (%) | 2.57
|
2.31
|
2.43
|
2.83
|
2.76
|
2.78
|
2.62
|
2.42
|
2.52
|
| Distribution losses (%) | 18.14
|
17.93
|
18.32
|
17.61
|
17.82
|
17.32
|
16.85
|
16.45
|
18.31
|
| (%) Share in electricity generation | |||||||||
| Hydel | 30.29
|
26.59
|
21.01
|
24.16
|
28.83
|
27.02
|
23.07
|
26.17
|
29.08
|
| Thermal | 64.57
|
65.34
|
68.87
|
65.25
|
60.21
|
61.76
|
60.54
|
51.55
|
49.01
|
| Nuclear | 3.70
|
5.20
|
6.78
|
6.67
|
7.37
|
7.72
|
11.87
|
17.36
|
16.88
|
| Renewable energy | 1.04
|
2.45
|
2.92
|
3.57
|
3.21
|
3.15
|
4.18
|
4.56
|
4.75
|
| Import | 0.42 | 0.36
|
0.38
|
0.35
|
0.33
|
0.35
|
0.28
| ||
The total demand for petroleum products remained at 23.1 million tonnes during FY2022. The transport and power sectors are major petroleum consumers, covering approximately 90 percent of the total demand.[107]
| Sector | Domestic | Industry | Agriculture | Transport | Power | Government | Overseas | Total | |
|---|---|---|---|---|---|---|---|---|---|
| Quantity | (000) MT | 29.522 | 1,332.899 | 11.822 | 17,409.035 | 3,683.322 | 373.489 | 250.121 | 23,090.210 |
Pakistan is an importer of petroleum products and crude oil. Imports of petroleum products during FY2022 amounted to around 12.9 million tonnes, valued at more than US$11.1 billion. The major imported products are motor spirit/gasoline, high-speed diesel, and furnace oil, with import quantities of 6,502 thousand tonnes, 3,950 thousand tonnes, and 2,258 thousand tonnes, respectively.
| Product | MS | HOBC | HSD | FO | JP-1 | Total | |
|---|---|---|---|---|---|---|---|
| Quantity | (000) MT | 6,502.07 | 125.62 | 3,949.97 | 2,258.20 | 53.87 | 12,889.730 |
| Value | Million US$ | 6,070.38 | 115.94 | 3,462.71 | 1,414.40 | 47.42 | 11,110.852 |
The total production of refineries in Pakistan for fiscal year 2020–21 reached 10.66 million tons. Among these refineries, PARCO holds the largest share, accounting for 41%, followed by ARL, BPPL, NRL, and PRL with shares of 17%, 16%, 14%, and 12% respectively. OGRA, founded in March 2002, serves as the regulatory body with the primary goals of promoting competition and enhancing private investment and ownership within the petroleum sector by implementing effective and efficient regulations. Oil Marketing Companies (OMCs) have established their infrastructure, including storage facilities and retail outlets, to market Petroleum, Oil, and Lubricant (POL) products. Motor Spirit (MS) and High-Speed Diesel (HSD) together make up nearly 80% of OMCs' sales. By the conclusion of fiscal year 2021, OMCs had developed a storage capacity of 0.58 million tons for MS and 0.88 million tons for HSD, distributed across various depots throughout the country. Oil Marketing Companies (OMCs) operate a total of 9,978 retail outlets nationwide. Among these, Pakistan State Oil (PSO) holds the highest number of retail outlets, boasting 3,158 outlets, which accounts for approximately 31.65 percent of the total.[108]
Indigenous natural gas supplies accounted for approximately 30 percent of Pakistan's total primary energy supply mix in FY2022. Pakistan maintains an extensive gas network comprising over 13,775 kilometers of transmission pipelines, 157,395 kilometers of main pipelines, and 41,352 kilometers of service pipelines. This network serves the needs of more than 10.7 million consumers throughout the country. During FY 2021–22, the natural gas supply in Pakistan reached 3,982 MMCFD. The country relies on several major gas fields, including Sui, Uch, Qadirpur, Sawan, Zamzama, Badin, Bhit, Kandhkot, Mari, and Manzalai, to meet its domestic demand. Additionally, Pakistan has been importing liquefied natural gas (LNG) since 2015, with regasified liquefied natural gas (RLNG) playing a significant role in alleviating natural gas shortages. In the year 2021–22, approximately 24 percent of the country's gas supplies were sourced from imported RLNG.
In FY 2020–21, the primary consumer of natural gas was the power sector, which accounted for more than 30 percent of the total consumption, equivalent to 1,208 MMCFD. Following the power sector, the domestic sector consumed 21 percent, or 850 MMCFD, while the fertilizer sector consumed 20 percent, totaling 834 MMCFD.[108]
Services[edit | edit source]
Pakistan's service sector contributes approximately 61.7% to the GDP.[78] Within this sector, transport, storage, communications, finance, and insurance comprise 24%, while wholesale and retail trade constitute about 30%. Pakistan is actively promoting the growth of the information industry and other modern service industries by offering incentives such as long-term tax holidays.
| List | FY 2008 | FY 2009 | FY 2010 | FY 2011 | FY 2012 | FY 2013 | FY 2014 | FY 2015 | FY 2016 | FY 2017 | FY 2018 | FY 2019 | FY 2020 | FY 2021 | FY 2022 | FY 2023 | FY 2024 | FY 2025 |
|---|---|---|---|---|---|---|---|---|---|---|---|---|---|---|---|---|---|---|
| Service sector | 4.72
|
1.84
|
2.63
|
2.86
|
3.48
|
5.13
|
3.82
|
4.20
|
5.03
|
5.62
|
5.95
|
5.00
|
-1.21
|
5.91
|
6.69
|
0.04
|
2.19
|
2.91
|
Education[edit | edit source]
Healthcare[edit | edit source]
Telecommunications[edit | edit source]

After the deregulation of the telecommunications industry, the sector has experienced exponential growth. Pakistan Telecommunication Company Ltd (PTCL) has emerged as a successful Forbes 2000 conglomerate with over US$1 billion in sales in 2005. The mobile telephone market has expanded many-fold since 2003, reaching a subscriber base of 140 million users in July 2017, one of the highest mobile teledensities in the world.[109] Pakistan won the prestigious Government Leadership award of GSM Association in 2006.[110]
In Pakistan, the following are the top mobile phone operators:
- Jazz Pakistan (parent: VEON, Netherlands)
- Ufone (parent: PTCL (Etisalat), Pakistan/UAE)
- Telenor (parent: Telenor, Norway)
- Zong (parent: China Mobile, China)
By March 2009, Pakistan had 91 million mobile subscribers – 25 million more subscribers than reported in the same period in 2008. In addition to the 3.1 million fixed lines, as many as 2.4 million are using Wireless Local Loop connections. Sony Ericsson, Nokia and Motorola along with Samsung and LG remain the most popular brands among customers.[111]
After liberalisation, between 2003 to 2007, the Pakistani telecom sector attracted more than $9 billion in foreign investments.[112] During 2007–08, the Pakistani communication sector alone received $1.62 billion in Foreign Direct Investment (FDI) – about 30% of the country's total foreign direct investment.
According to the PC World, a total of 6.37 billion text messages were sent through Acision messaging systems across Asia Pacific over the 2008/2009 Christmas and New Year period.[113] Pakistan was amongst the top five rankers with one of the highest SMS traffic with 763 million messages.
On 14 August 2010, Pakistan became the first country in the world to experience EVDO's RevB 3G technology that offers maximum speeds of 9.3 Mbit/s.
3G and 4G were simultaneously launched in Pakistan on 23 April 2014 through a SMRA auction. Three out of five companies got a 3G licence i.e. Ufone, Mobilink and Telenor while China Mobile's Zong got 3G as well as a 4G licence. Whereas the fifth company, Warid Pakistan did not participate in the auction procedure, but they launched 4G LTE services on their existing 2G 1800 MHz spectrum due to Technology-neutral terms and became the world's first Telecom Company to transform directly from 2G to 4G. With that, Pakistan joined the 3G and 4G world. In December 2017, 3G and 4G subscribers in Pakistan reached 46 million.[109]
After the successful implementation of the Device Identification Registration and Blocking System (DIRBS) in 2019 along with a comprehensive mobile manufacturing policy, it created a favourable environment for mobile device manufacturing in Pakistan. For the first time in the history of Pakistan, local mobile phone manufacturing exceeded the number of mobile phones that were imported in 2021. Mobile device manufacturing licences have been issued to 26 companies, including Samsung, Redmi, Realme, Nokia, Oppo, TECNO, Infinix, Itel, Vgotel, and Q-Mobile.[114]
| Indicators | 2003 | 2004 | 2005 | 2006 | 2007 | 2017 | 2018 | 2019 | 2020 | 2021 | 2022 | 2023 | 2024 |
|---|---|---|---|---|---|---|---|---|---|---|---|---|---|
| Teledensity | 4.31% | 6.25% | 11.9% | 26.24% | 44.06% | 72.4% | 74.1% | 75.1% | 76.3% | 81.7% | 84.6% | 81.4% | 80.5% |
| Telecom subscribers (millions) | 2.4 | 5.0 | 12.7 | 34.5 | 62.3 | 139.8 | 151.5 | 165.0 | 171.1 | 186.8 | 197.2 | 193.5 | 195.1 |
| Broadband subscribers (millions) | 0.03 | 0.05 | 44.8 | 58.7 | 71.5 | 83.8 | 102.7 | 118.8 | 127.6 | 138.3 | |||
| Broadband penetration | 0.0% | 0.0% | 22.7% | 28.1% | 32.6% | 37.4% | 44.9% | 51.0% | 53.6% | 57.0% | |||
| Cellular mobile data usage (petabytes) | 690 | 1,262 | 2,493 | 4,510 | 6,853 | 8,970 | 10,850 | 13,021 | |||||
| Telecom revenues (billion PKR) | 118 | 144 | 195 | 236 | 528 | 540 | 604 | 595 | 641 | 717 | 817 | 955 | |
| Telecom contribution to exchequer (billion PKR) | 30.0 | 38 | 67 | 77 | 100 | 161 | 163 | 111 | 286 | 222 | 329 | 341 | 335 |
| Total telecom investment (million US $) | 1,473 | 1,731 | 4,109 | 1,133 | 1,132 | 882 | 1,140 | 1,214 | 1,657 | 770 | 765 | ||
| Mobile (CBU) imports (million units) | 18.11 | 12.07 | 16.28 | 24.51 | 10.26 | 1.53 | 1.58 | 1.71 | |||||
| Local assembly / manufacturing (million units) | 1.72 | 5.2 | 11.74 | 13.05 | 24.66 | 21.94 | 21.28 | 31.38 | |||||
Information technology[edit | edit source]
Transportation[edit | edit source]
Air linkage[edit | edit source]

The year 1955 marked the inauguration of the Pakistan airline's first scheduled international service – to London, via Cairo and Rome. In 1959, the Government of Pakistan appointed Air Commodore Nur Khan as the managing director of PIA. With his visionary leadership, PIA 'took off' and within a short span of 6 years, gained the stature and status of one of the world's frontline carriers. In aviation circles, this period has often been referred to as the "golden years of PIA". On 29 April 1964, with a Boeing 720B, PIA earned the distinction of becoming the first airline from a non-communist country to fly into the People's Republic of China. Private sector airlines in Pakistan include Airblue, which serves the main cities within Pakistan in addition to destinations in the Persian Gulf and Manchester in the United Kingdom.
| Indicators | 2003 | 2008 | 2013 | 2018 | 2019 | 2020 | 2021 | 2022 | 2023 | 2024 |
|---|---|---|---|---|---|---|---|---|---|---|
| Route kilometers | 290,129 | 311,131 | 411,936 | 332,303 | 389,725 | 705,820 | 374,054 | 341,821 | 301,832 | 593,063 |
| Passengers carried (000) | 4,556 | 5,617 | 4,449 | 5,203 | 5,290 | 2,541 | 2,657 | 4,281 | 4,496 | 3,904 |
| Operating revenue (billion PKR) | 47.952 | 88.863 | 95.771 | 103.490 | 147.500 | 94.989 | 86.185 | 172.038 | 237.883 | 204.164 |
| Operating expenses (billion PKR) | 42.574 | 120.499 | 123.151 | 150.524 | 153.631 | 95.670 | 101.212 | 183.354 | 233.988 | 194.807 |
| Profit+/-loss after tax (billion PKR) | +1.298 | -36.138 | -44.322 | -67.328 | -52.602 | -34.643 | -50.101 | -88.008 | -104.501 | +26.204 |
Railway linkage[edit | edit source]

Pakistan Railways (PR) is a major mode of transport in the public sector, contributing to the country's economic growth and providing national integration. 13 May 1861 was a historical day when the first railway line was opened for public between Karachi City and Kotri, a distance of 169 km. In 1885, the Sindh, Punjab and Delhi Railways were purchased by the Secretary of State for India. On 1 January 1886 this line and other State Railways were integrated and North Western State Railway was formed; this was later renamed as North Western Railways (NWR). At the time of Independence, the NWR was bifurcated with 1,847 route miles lying in India and 5,048 route miles in Pakistan. In 2022, Pakistan Railways comprised a total of 467 locomotives (462 diesel engines and 05 steam engines) for the 7,479 km route length. Pakistan Railways employed 60,643 people in 2022.
| Indicators | 2016 | 2017 | 2018 | 2019 | 2020 | 2021 | 2022 | 2023 | 2024 |
|---|---|---|---|---|---|---|---|---|---|
| Route kilometers | 7,791 | 7,791 | 7,791 | 7,791 | 7,791 | 7,791 | 7,479 | 7,791 | 7,791 |
| Track kilometers | 11,881 | 11,881 | 11,881 | 11,881 | 11,881 | 11,881 | 11,492 | 11,881 | 11,881 |
| Passengers carried (000) | 52,192 | 52,388 | 54,907 | 60,387 | 44,304 | 28,424 | 35,681 | 35,404 | 42,103 |
| Goods carried (000 tonnes) | 5,001 | 5,630 | 8,355 | 8,376 | 7,412 | 8,213 | 8,098 | 5,748 | 7,854 |
| Operating revenue (billion PKR) | 36.58 | 40.06 | 49.57 | 54.51 | 47.58 | 48.65 | 60.09 | 63.29 | 88.73 |
| Operating expenses (billion PKR) | 41.86 | 50.07 | 52.07 | 53.77 | 59.29 | 56.33 | 67.56 | 72.12 | 88.31 |
| Net loss (billion PKR) | 26.53 | 40.79 | 37.12 | 33.49 | 50.27 | 47.71 | 48.49 | 47.77 | 53.32 |
Road linkage[edit | edit source]

The National Highway Authority (NHA) was established in 1991 through an Act of Parliament for the planning, development, operation, repair, and maintenance of National Highways and Strategic Roads specially entrusted to NHA by the Federal Government or by a Provincial Government or other authority concerned. NHA is the custodian of 39 national highways, motorways, expressways, and strategic routes, with a total length of 12,131 km, constituting 4.6% of the total national roads network, which is 263,775 km. However, it carries 80% of commercial traffic, and the N-5 National Highway, which is the lifeline of Pakistan, carries 65% of this load in the country.
Maritime linkage[edit | edit source]
Pakistan National Shipping Corporation (PNSC) is a national flag carrier. It was formed through the merger of the National Shipping Corporation and Pakistan Shipping Corporation in 1979. PNSC has had worldwide operations in the dry bulk segment of the shipping market since its inception, and has been involved in the transportation of liquid cargo since 1998, both locally and internationally. The corporation's head office is located in Karachi. Currently, the PNSC fleet comprises eleven vessels of various types and sizes (five bulk carriers, four Aframax tankers, and two LR-1 Clean Product tankers) with a total deadweight capacity (cargo carrying capacity) of 831,711 metric tons, the highest ever carrying capacity since the inception of PNSC.[119]
Finance[edit | edit source]
Pakistan has a large and diverse banking system. In 1974, a nationalization programme led to the creation of six government-owned banks.[120] A privatization programme in the 1990s led to the entry of foreign-owned and local banks into the industry.[120] As of 2010, there were five publicly owned commercial banks in Pakistan, as well as 25 domestic private banks, six multinational banks, and four specialised banks.[120]

Since 2000, Pakistani banks have begun aggressive marketing of consumer finance to the emerging middle class, allowing for a consumption boom (more than a seven-month waiting list for certain car models) as well as a construction bonanza. Pakistan's banking sector remained remarkably strong and resilient during the 2008 financial crisis, a feature which has served to attract a substantial amount of FDI in the sector. Stress tests conducted in June 2008 data indicate that the large banks are relatively robust, with the medium and small-sized banks positioning themselves in niche markets.
The Pakistan Bureau of Statistics provisionally valued this sector at Rs.807,807 million in 2012, thus registering over 510% growth since 2000.[121]
An article published in the Journal of the Asia Pacific Economy by Mete Feridun of the University of Greenwich in London with his Pakistani colleague Abdul Jalil presents strong econometric evidence that financial development fosters economic growth in Pakistan.[122]
| Bank | Total assets | Revenue | Profit after tax |
|---|---|---|---|
| State Bank of Pakistan | 19,687 | 1,218 | 1,143.0 |
| Habib Bank Ltd | 5,202 | 277 | 56.9 |
| Meezan Bank | 3,012 | 249 | 84.5 |
| National Bank of Pakistan | 6,653 | 209 | 51.8 |
| MCB BANK LTD. | 2,427 | 181 | 59.6 |
| United Bank Limited | 5,575 | 166 | 53.2 |
| Bank Alfalah | 3,346 | 154 | 36.5 |
| Bank AL Habib | 2,741 | 147 | 35.3 |
| Allied Bank Limited | 2,329 | 138 | 40.7 |
| Standard Chartered Bank Ltd. | 1,002 | 107 | 42.6 |
| HabibMetro | 1,556 | 87 | 24.4 |
In recent years, banking through digital channels has been gaining popularity in the country. These channels offer alternatives resulting in faster delivery of financial services to a wide range of customers. Significant progress has been observed in the usage of internet banking and mobile banking channels during the last few years. In the last five years,[when?] internet banking transactions saw compound annualised growth of 31%, whereas mobile banking transactions grew by 86%.
| FY 2020 | FY 2021 | FY 2022 | FY 2023 | FY 2024 | |
|---|---|---|---|---|---|
| Commercial banks + MFBs | 44 | 44 | 44 | 44 | 45 |
| Bank branches | 16,067 | 16,308 | 17,031 | 17,693 | 18,450 |
| Total number of ATMs | 15,612 | 16,355 | 17,133 | 17,808 | 18,957 |
| Internet banking users (000) | 3,983 | 5,239 | 8,370 | 9,637 | 11,996 |
| Mobile phone banking users (000) | 8,452 | 10,873 | 12,339 | 16,061 | 18,678 |
| POS machines | 49,067 | 71,907 | 104,865 | 115,288 | 125,593 |
| Credit cards (million) | 1.66 | 1.72 | 1.80 | 2.01 | 2.04 |
| Debit cards (million) | 26.7 | 29.8 | 34.6 | 39.0 | 48.3 |
| FY 2020 | FY 2021 | FY 2022 | FY 2023 | FY 2024 | ||
|---|---|---|---|---|---|---|
| PRISM system* | Transactions (millions) | 2.6 | 4.2
|
4.4
|
4.9
|
5.8
|
| Amount (trillion PKR) | 394.3 | 444.6
|
681.6
|
640.4
|
1,043.1
| |
| Paper based | Transactions (millions) | 598.4 | 582.3
|
599.1
|
574.2
|
571.2
|
| Amount (trillion PKR) | 185.6 | 218.9
|
295.7
|
342.7
|
447.7
| |
| Mobile banking | Transactions (millions) | 82.8 | 193.4
|
387.5
|
660.6
|
1,122.8
|
| Amount (trillion PKR) | 1.8 | 4.9
|
11.8
|
23.8
|
46.3
| |
| E-commerce | Transactions (millions) | 10.2 | 21.9
|
45.5
|
31.8
|
39.9
|
| Amount (billion PKR) | 34.9 | 60.6
|
106.0
|
142.0
|
194.3
| |
* Real-time gross settlement (RTGS) mechanism in Pakistan is named the Pakistan Real-time Interbank Settlement Mechanism (PRISM).
Housing[edit | edit source]

The property sector has expanded 23-fold since 2001, particularly in metropolises like Lahore.[126] Nevertheless, the Karachi Chamber of Commerce and Industry estimated in late 2006 that the overall production of housing units in Pakistan has to be increased to 0.5 million units annually to address 6.1 million backlog of housing in Pakistan for meeting the housing shortfall in next 20 years. The report noted that the present housing stock is also rapidly aging and an estimate suggests that more than 50% of stock is over 50 years old. It is also estimated that 50% of the urban population now lives in slums and squatter settlements. The report said that meeting the backlog in housing, besides replacement of out-lived housing units, is beyond the financial resources of the government. This necessitates putting in place a framework to facilitate financing in the formal private sector and mobilise non-government resources for a market-based housing finance system.[127] To promote affordable housing and home ownership among low to middle-income group, who currently do not own a house, SBP in 2020 introduced the Government's Mark-Up Subsidy Scheme, through which subsidized financing is provided to individuals for construction or purchase of a new house. Since then, a huge demand for house financing has been witnessed by the commercial banks.
| Jun 2006 | Jun 2010 | Jun 2015 | Jun 2016 | Jun 2017 | Jun 2018 | Jun 2019 | Jun 2020 | Jun 2021 | Jun 2022 | Jun 2023 | Jun 2024 |
|---|---|---|---|---|---|---|---|---|---|---|---|
| 43.205 | 54.500 | 40.207 | 48.153 | 60.688 | 82.939 | 92.561 | 79.803 | 103.631 | 200.765 | 212.315 | 203.580 |
Tourism[edit | edit source]
Tourism in Pakistan has been hailed as the tourism industry's "next big thing". Pakistan, with its diverse cultures, people, and landscapes, has attracted 90 million tourists to the country, almost double that of a decade ago. Currently, Pakistan ranks 130th in the world by tourist income. Due to the threat of terrorism, the number of foreign tourists has gradually declined, and the shock of the 2013 Nanga Parbat tourist shooting has severely adversely affected the tourism industry.[128] As of 2016[update], tourism has begun to recover in Pakistan, albeit gradually, with a current global rank of 130.[129]
Science and technology[edit | edit source]
Labour[edit | edit source]
Foreign trade, remittances, aid, and investment[edit | edit source]
Investment[edit | edit source]
Foreign investment significantly declined by 2010, dropping by 54.6% due to Pakistan's political instability and weak law and order, according to the Bank of Pakistan.[130]
Business regulations have been overhauled along liberal lines, especially since 1999. Most barriers to the flow of capital and international direct investment have been removed. Foreign investors do not face any restrictions on the inflow of capital, and investment of up to 100% of equity participation is allowed in most sectors. Unlimited remittance of profits, dividends, service fees or capital is now the rule. However, doing business has been becoming increasingly difficult over the past decade due to political instability, rising domestic insurgency and insecurity and vehement corruption. This can be confirmed by the World Bank's Ease of Doing Business Index report degrading its ratings for Pakistan each year since September 2009.
The World Bank (WB) and International Finance Corporation's flagship report Ease of Doing Business Index 2020 ranked Pakistan 108 among 190 countries around the globe, indicating a continuous improvement and taking a jump from 136 last year. The top five countries were New Zealand, Singapore, Denmark, Hong Kong and South Korea.[131]
With improvement in ease of doing business ranking and giving an investment friendly road map from government, many new auto sector giants like France's Renault, South Korean's Hyundai and Kia, Chinese JW Forland and German auto giant Volkswagen are considering entry into Pakistan auto market through joint ventures with local manufacturers like Dewan Farooque Motors, Khalid Mushtaq Motors and United Motors.[132] As of March 2022, only the Hyundai Nishat JV materialised.
US oil and gas giant Exxon Mobil returned to Pakistan after nearly three decades gap and has acquired 25% shares in offshore drilling in May 2018, with initial survey showing a potential of huge hydrocarbon reserves discovery offshore.[133]
To boost Pakistan's unstable foreign-exchange reserves, Qatar announced to invest $3 billion in the form of deposits and direct investments in the country.[134] By the end of June 2019, Qatar sent the first $500 million to Pakistan.[135][136]
| List | FY 2008 | FY 2009 | FY 2010 | FY 2011 | FY 2012 | FY 2013 | FY 2014 | FY 2015 | FY 2016 | FY 2017 | FY 2018 | FY 2019 | FY 2020 | FY 2021 | FY 2022 | FY 2023 | FY 2024 |
|---|---|---|---|---|---|---|---|---|---|---|---|---|---|---|---|---|---|
| Foreign direct investment | 5,410
|
3,720
|
2,151
|
1,635
|
821
|
1,457
|
1,699
|
1,034
|
2,393
|
2,407
|
2,780
|
1,362
|
2,598
|
1,821
|
1,936
|
1,627
|
1,902
|
Foreign acquisitions and mergers[edit | edit source]
With the rapid growth in Pakistan's economy, foreign investors are taking a keen interest in the corporate sector of Pakistan. In recent years, majority stakes in many corporations have been acquired by multinational groups.
- PICIC by Singapore-based Temasek Holdings for $339 million
- Union Bank by Standard Chartered Bank for $487 million
- Prime Commercial Bank by ABN Amro for $228 million
- PakTel by China Mobile for $460 million
- PTCL by Etisalat for $1.8 billion
- Additional 57.6% shares of Lakson Tobacco Company acquired by Philip Morris International for $382 million
- In 2016, Arçelik acquired Dawlance for $243 million.[139]
- In 2016, FrieslandCampina acquired 51% stake in Engro Foods for $446.81 million.[140]
- In 2016, The Abraaj Group sold its 66.4% stake in K-Electric to Shanghai Electric for $1.77 billion.[141]
The foreign exchange receipts from these sales are also helping cover the current account deficit.[142]
Foreign trade[edit | edit source]

Pakistan witnessed the highest export of US$25.4 billion in the FY 2011. However, in subsequent years exports have declined considerably. This decline started from the financial year 2015 when an international commodity slump set in. This was compounded by structural supply-side constraints including energy shortages, high input costs, and an overvalued exchange rate. From the financial year 2014 to 2016, exports declined by 12.4 percent. The exports growth trend over this period was similar to the world trade growth patterns. Pakistan's external sector continued facing stress during 2017. Still, Pakistan's merchandise trade exports grew by 0.1 percent during the fiscal year 2017. The imports continued to grow at a much faster rate and grew by a large percentage of 18.0 during the FY 2017 as compared to the previous year.[143]
Note: This is the trade data (export and import) as released by the SBP.[144][145] This may differ from the data compiled by Pakistan Bureau of Statistics.
| List | FY 2008 | FY 2009 | FY 2010 | FY 2011 | FY 2012 | FY 2013 | FY 2014 | FY 2015 | FY 2016 | FY 2017 | FY 2018 | FY 2019 | FY 2020 | FY 2021 | FY 2022 | FY 2023 | FY 2024 | FY 2025 |
|---|---|---|---|---|---|---|---|---|---|---|---|---|---|---|---|---|---|---|
| Total exports | 24.01
|
23.21
|
24.89
|
31.11
|
29.73
|
31.53
|
30.42
|
29.96
|
27.43
|
27.92
|
30.62
|
30.22
|
27.97
|
31.58
|
39.60
|
35.47
|
38.67
|
40.69
|
| Goods | 20.45
|
19.13
|
19.68
|
25.37
|
24.72
|
24.80
|
25.08
|
24.09
|
21.97
|
22.00
|
24.77
|
24.26
|
22.54
|
25.64
|
32.49
|
27.88
|
30.98
|
32.30
|
| Services | 3.56
|
4.09
|
5.21
|
5.75
|
5.01
|
6.72
|
5.35
|
5.87
|
5.46
|
5.92
|
5.85
|
5.97
|
5.44
|
5.95
|
7.10
|
7.60
|
7.69
|
8.39
|
| Total imports | 45.44
|
39.22
|
38.12
|
43.57
|
48.69
|
48.45
|
49.66
|
50.21
|
50.12
|
58.58
|
67.95
|
62.81
|
52.40
|
62.73
|
84.49
|
61.33
|
63.96
|
70.09
|
| Goods | 35.28
|
31.67
|
31.13
|
35.80
|
40.37
|
40.16
|
41.67
|
41.36
|
41.12
|
48.00
|
55.67
|
51.87
|
43.65
|
54.27
|
71.54
|
52.70
|
53.16
|
59.08
|
| Services | 10.16
|
7.56
|
6.99
|
7.77
|
8.32
|
8.29
|
8.00
|
8.85
|
9.00
|
10.58
|
12.28
|
10.94
|
8.75
|
8.46
|
12.94
|
8.64
|
10.80
|
11.01
|
| Trade deficit | 21.43
|
16.01
|
13.23
|
12.46
|
18.96
|
16.92
|
19.24
|
20.24
|
22.69
|
30.66
|
37.33
|
32.58
|
24.43
|
31.15
|
44.89
|
25.86
|
25.29
|
29.40
|
Pakistan's imports are showing a rising trend at a relatively faster rate due to increased economic activity as part of the China Pakistan Economic Corridor (CPEC), particularly in the energy sector. The construction projects under CPEC require heavy machinery that has to be imported. It is also observed that the economy is currently being led both by investments as well as consumption, resulting in relatively higher levels of imports. During FY 2018, Pakistan's exports picked up and reached US$24.8 billion, showing a growth of 12.6 percent over the previous year, FY 2017. Imports, on the other hand, also increased by 16.2 percent, reaching the highest figure of US$56.6 billion. As a result, the trade deficit widened to US$31.8 billion, which was the highest in the last ten years. Pakistan's exports of goods recorded their highest level of $25.6 billion during the fiscal year 2021, higher than the $25.3 billion recorded in 2011.
Exports[edit | edit source]
Pakistan's major export commodities since fiscal year 2014 are listed in the table below.[146]
| Commodities | FY 2015 | FY 2016 | FY 2017 | FY 2018 | FY 2019 | FY 2020 | FY 2021 | FY 2022 | FY 2023 | FY 2024 |
|---|---|---|---|---|---|---|---|---|---|---|
| Knitwear | 2,264
|
2,309
|
2,335
|
2,615
|
2,854
|
2,688
|
3,372
|
4,516
|
4,244
|
4,018
|
| Ready-made garments | 2,044
|
2,156
|
2,279
|
2,477
|
2,568
|
2,595
|
2,820
|
3,698
|
3,496
|
3,471
|
| Bed wear | 2,207
|
2,126
|
2,157
|
2,346
|
2,347
|
2,230
|
2,691
|
3,255
|
2,804
|
2,790
|
| Rice | 2,038
|
1,853
|
1,575
|
1,933
|
2,163
|
2,274
|
2,211
|
2,760
|
2,109
|
3,684
|
| Cotton cloth | 2,487
|
2,332
|
2,123
|
2,176
|
2,174
|
1,942
|
1,884
|
2,338
|
2,155
|
1,898
|
| Chemical and pharmaceutical | 1,250
|
1,052
|
1,113
|
1,390
|
1,227
|
1,074
|
1,147
|
1,482
|
1,429
|
1,420
|
| Cotton yarn | 1,818
|
1,266
|
1,140
|
1,249
|
1,202
|
1,081
|
921
|
1,200
|
870
|
1,052
|
| Towels | 716
|
721
|
679
|
750
|
713
|
680
|
882
|
1,080
|
931
|
954
|
| Leather manufactures | 547
|
488
|
487
|
615
|
503
|
480
|
560
|
649
|
628
|
606
|
| Sports goods | 585
|
539
|
552
|
551
|
519
|
458
|
471
|
507
|
460
|
439
|
| Surgical goods & medical instruments | 401
|
424
|
396
|
442
|
438
|
411
|
480
|
475
|
454
|
456
|
Imports[edit | edit source]
Pakistan's major import commodities since fiscal year 2014 are listed in the table below.[147][148]
| Commodities | FY 2014 | FY 2015 | FY 2016 | FY 2017 | FY 2018 | FY 2019 | FY 2020 | FY 2021 | FY 2022 |
|---|---|---|---|---|---|---|---|---|---|
| Petroleum products | 9,020 | 7,774
|
5,098
|
6,380
|
6,768
|
6,039
|
4,190
|
4,641
|
10,296
|
| Petroleum crude | 5,755 | 4,393
|
2,570 | 2,765
|
4,310
|
4,915
|
2,606
|
3,190
|
4,602
|
| Liquefied natural gas (LNG) | 0 | 135
|
579
|
1,271
|
2,036
|
2,872
|
2,375
|
1,776
|
3,681
|
| Plastic material | 1,680 | 1,772
|
1,791
|
1,875
|
2,312
|
2,273
|
1,941
|
2,460
|
3,251
|
| Palm oil | 1,922 | 1,681
|
1,600
|
1,775
|
1,908
|
1,662
|
1,752
|
2,443
|
3,151
|
| Road vehicles | 861 | 1,025
|
1,264
|
1,774
|
2,182
|
1,934
|
1,276
|
2,143
|
3,010
|
| Iron and steel | 1,540 | 1,813
|
2,094
|
1980
|
2,523
|
2,008
|
1,491
|
2,197
|
2,854
|
| Raw cotton | 532 | 449
|
1,127
|
909
|
1,198
|
1,181
|
1,342
|
1,894
|
2,283
|
| Telecom | 1,217 | 1,225
|
1,201
|
1,023
|
1,397
|
1,172
|
1,637
|
2,513
|
2,252
|
| Electrical machinery & apparatus | 722 | 935
|
1,651
|
1,317
|
1,801
|
1,287
|
1,135
|
1,452
|
1,817
|
| Textile machinery | 658 | 492
|
529
|
652
|
615
|
654
|
588
|
855
|
1,212
|
| Power generating machinery | 675 | 898
|
1,356
|
1,337
|
1,577
|
732
|
734
|
930
|
795
|
External imbalances[edit | edit source]
During FY 2017, the increase in imports of capital equipment and fuel significantly put pressure on the external account. A reversal in global oil prices led to an increase in POL imports, accompanied by falling exports; as a result, the merchandise trade deficit grew by 39.4 percent to US$26.885 billion in FY 2017. While remittances and Coalition Support Fund inflows both declined slightly over the same period last year, however, the impact was offset by an improvement in the income account, mainly due to lower profit repatriations by oil and gas firms.[149]
The current account deficit increased to US$19.2 billion in FY 2018.[150]
However, the impact of high current deficit on foreign exchange reserves was not severe, as financial inflows were available to the country to partially offset the gap; these inflows helped ensure stability in the exchange rate. Net FDI grew by 12.4 percent and reached US$1.6 billion in the nine-month period, whereas net FPI saw an inflow of US$631 million, against an outflow of US$393 million last year. Encouragingly for the country, the period saw the completion of multiple merger and acquisition deals between local and foreign companies. Moreover, multiple foreign automakers announced their intention to enter the Pakistani market, and some also entered into joint ventures with local conglomerates. This indicates that Pakistan is clearly on foreign investors' radar, and provides a positive outlook for FDI inflows going forward. government's successful issuance of a US$1.0 billion Sukuk in the international capital market, at an extremely low rate of 5.5 percent.
Pakistan continued to enjoy support from international financial institutions (IFIs) like the World Bank and Asian Development Bank, and from bilateral partners like China, in the post-EFF period: net official loan inflows of US$1.1 billion were recorded during the period. As a result, the country's FX reserve amounted to US$20.8 billion by 4 May 2017 sufficient to finance around four months of import payments.[149]
| List | FY 2008 | FY 2009 | FY 2010 | FY 2011 | FY 2012 | FY 2013 | FY 2014 | FY 2015 | FY 2016 | FY 2017 | FY 2018 | FY 2019 | FY 2020 | FY 2021 | FY 2022 | FY 2023 | FY 2024 | FY 2025 |
|---|---|---|---|---|---|---|---|---|---|---|---|---|---|---|---|---|---|---|
| Credit | 37.25 | 35.36 | 38.14 | 47.70 | 48.24 | 50.20 | 51.15 | 52.90 | 51.24 | 52.22 | 55.15 | 55.79 | 54.25 | 65.12 | 73.20 | 64.79 | 72.25 | 82.71 |
| Debit | 51.12 | 44.62 | 42.08 | 47.49 | 52.90 | 52.69 | 54.28 | 55.71 | 56.20 | 64.49 | 74.34 | 69.23 | 58.70 | 67.94 | 90.68 | 68.06 | 74.32 | 80.60 |
| Net | −13.87 | −9.26 | −3.95 | +0.21 | −4.66 | −2.50 | −3.13 | −2.82 | −4.96 | −12.27 | −19.20 | −13.43 | −4.45 | −2.82 | −17.48 | −3.28 | -2.07 | +2.11 |
| As % of GDP | ||||||||||||||||||
| Net | -8.9
|
-5.7
|
-2.3
|
+0.1
|
-2.1
|
-1.1
|
-1.3
|
-1.0
|
-1.7
|
-4.0
|
-6.1
|
-4.8
|
-1.7
|
-0.6
|
-4.7
|
-0.9
|
-0.6
|
|
Economic aid[edit | edit source]
Pakistan receives economic aid from several sources as loans and grants. The International Monetary Fund (IMF), World Bank (WB), Asian Development Bank (ADB), etc. provide long-term loans to Pakistan. Pakistan also receives bilateral aid from developed and oil-rich countries. Foreign aid has been one of the main sources of money for the Pakistani economy. Collection of foreign aid has been one of the priorities of almost every Pakistani Government with the Prime Minister himself leading delegations on a regular basis to collect foreign aid.[151][152]
The Asian Development Bank will provide close to $6 billion development assistance to Pakistan during 2006–9.[153] The World Bank unveiled a lending programme of up to $6.5 billion for Pakistan under a new four-year, 2006–2009, aid strategy showing a significant increase in funding aimed largely at beefing up the country's infrastructure.[154] Japan will provide $500 million annual economic aid to Pakistan.[155] In November 2008, the International Monetary Fund (IMF) has approved a loan of 7.6 billion to Pakistan, to help stabilise and rebuild the country's economy. Between the 2008 and 2010 fiscal years, the IMF extended loans to Pakistan totalling 5.2 billion dollars.[156] The government decided in 2011 to cut off ties with the IMF. However, the government newly elected in 2013 re-established these ties, and a negotiated a three-year $6.6 billion package which would allow it to deal with ongoing debt issues.[157] In May 2019, Pakistan finalised a US$6 billion foreign aid with IMF.[158] This is Pakistan's 22nd such bailout from the IMF.[159]
The China–Pakistan Economic Corridor is being developed with a contribution of mainly concessionary loans from China under the Belt and Road Initiative. Much like BRI, the value of CPEC investments transcends any fiat currency and is only estimated vaguely as it spans over decades of past and future industrial development and global economic influence.
Remittances[edit | edit source]
The remittances of Pakistanis living abroad have played an important role in Pakistan's economy and foreign exchange reserves. Pakistanis settled in Western Europe and North America are significant sources of remittances to Pakistan. Since 1973, Pakistani workers in the oil-rich Arab states have been sources of billions of dollars of remittances.
The 9 million-strong Pakistani diaspora contributed US$19.3 billion to the economy in FY2017.[160] The major source countries of remittances to Pakistan include UAE, US, Saudi Arabia, GCC countries (including Bahrain, Kuwait, Qatar, and Oman), Australia, Canada, Japan, Norway, Switzerland, UK, and EU countries.
Remittances sent home by overseas Pakistani workers saw a negative growth of 3.0% in the fiscal year 2017 compared to the previous year when remittances reached an all-time high of 19.9 billion US dollars. This decline in remittances is mainly due to the adverse economic conditions in Arabian and Gulf countries after the fall in oil prices in 2016. However, recent development activities in the Qatar FIFA World Cup, Dubai Expo, Saudi Arabia's implementation of its Vision 2030, and particularly the recent visit of the PM to Kuwait should all be helpful in opening new avenues for employment in these countries. Going forward, one can expect improvements in the coming years. The SBP's data showed that remittances amounted to $29.4 billion for the year 2021. The government and SBP took measures to incentivise the use of formal channels of sending money home. The orderly foreign exchange market conditions also contributed to the rise in remittances. Remittances helped improve the country's external sector position despite the challenging global economic conditions due to the coronavirus pandemic.
Data is taken from SBP and Ministry of Finance.[161][162][83]
| List | FY 2008 | FY 2009 | FY 2010 | FY 2011 | FY 2012 | FY 2013 | FY 2014 | FY 2015 | FY 2016 | FY 2017 | FY 2018 | FY 2019 | FY 2020 | FY 2021 | FY 2022 | FY 2023 | FY 2024 | FY 2025 |
|---|---|---|---|---|---|---|---|---|---|---|---|---|---|---|---|---|---|---|
| Workers' remittances | 6.4
|
7.8
|
8.9
|
11.2
|
13.1
|
13.9
|
15.8
|
18.7
|
19.9
|
19.4
|
19.9
|
21.7
|
23.1
|
29.5
|
31.3
|
27.3
|
30.3
|
38.3
|
Remittances sent home by overseas Pakistanis in the fiscal year 2020/21 are as follows:[143]
| Country | (billion US$) |
|---|---|
 Saudi Arabia Saudi Arabia |
7.667 |
 UAE UAE |
6.114 |
 UK UK |
4.067 |
| Template:Country data Gulf Cooperation Council | 3.310 |
 USA USA |
2.754 |
 European Union European Union |
2.709 |
 Australia Australia |
0.594 |
 Canada Canada |
0.586 |
 Malaysia Malaysia
|
0.204 |
 Norway Norway |
0.111 |
 Japan Japan |
0.085 |
 Switzerland Switzerland |
0.041 |
| Other countries | 1.130 |
Economic issues[edit | edit source]
2021-2024 economic crisis[edit | edit source]
 Inverted yield curve in 2019–2020 and 2022 20 year 10 year 5 year 1 year |
 |
Taxation Issues[edit | edit source]
In fiscal year 2023, tax exemptions and concessions granted to influential sectors such as real estate, manufacturing and energy, cost the state 4.61 percent of GDP.[163]
The Finance Act 2025[edit | edit source]
The Finance Act 2025 drew significant controversy due to its stringent taxation measures and expanded enforcement powers granted to the Federal Board of Revenue (FBR). Key provisions, including Sections 37A and 37B, allowed for the arrest of individuals without prior notice, raising concerns over potential misuse and arbitrary enforcement. Additionally, measures such as the disallowance of business expenditures linked to cash transactions, penalties for purchases from non-National Tax Number (NTN) holders, mandatory digital invoicing, and an increased withholding tax on cash withdrawals by non-filers were widely criticized as burdensome and unclear by tax experts and business stakeholders.[164][165]
In response, major business communities across Pakistan staged protests and strikes, describing the measures as "anti-business." On 19 July 2025, a nationwide strike was observed, with complete shutdowns in key markets, including Karachi’s New Sabzi Mandi for the first time. Leading chambers of commerce, including those in Karachi and Lahore, supported the strike, demanding the rollback of the new policies and restoration of previously abolished regimes. While some business groups entered talks with the government, others warned of further action if concerns remained unaddressed.[164][165]
Corruption[edit | edit source]
.png)
Corruption is an ongoing issue in the government, with claims of initiatives against it,[166] particularly at the government and lower levels of police forces.[167] In 2011, the country consistently ranked poorly on the Transparency International's Corruption Perceptions Index, with scores of 2.5,[168] 2.3 in 2010,[169] and 2.5 in 2009[170] out of 10.[171] In 2011, Pakistan ranked 134th on the index, with 42 countries ranking worse.[172] In 2012, Pakistan's ranking dropped further from 134 to 139, making Pakistan the 34th most corrupt country in the world, tied with Azerbaijan, Kenya, Nepal, and Nigeria.[173] However, during the Sharif regime (2013–17), Pakistan improved its ranking to 117th out of 180 countries in 2017 (with an improvement in score from 28, 29, 30, 32, 32 [2013–17]), equal to Egypt (better than 59 countries).[174] Due to the adverse effects of corruption on the country, the National Accountability Bureau (NAB) was established in 1999. The primary purpose of NAB was to recover looted money from corrupt elements and deposit it in the national exchequer. From 2018 to 2020, NAB recovered Rs 502 billion from corrupt elements, a record achievement. Since the bureau's inception, NAB has recovered Rs 814 billion directly or indirectly from corrupt elements, exceeding the recovery of other such anti-corruption organizations.[175]
According to the IMF’s 2025 Governance and Corruption Diagnostic Assessment, Pakistan’s economy loses an estimated 5–6.5 percent of its GDP to corruption due to entrenched "elite capture," in which influential groups shape public policy for their own benefit. The system has led to market distortions and wastage of public resources.[163]
Interference by Pakistan Military[edit | edit source]
The Pakistani military maintains significant influence over the country's economy, as illustrated by a July 2025 meeting between foreign exchange company representatives and a senior intelligence official, Major General Faisal Naseer of the Inter-Services Intelligence (ISI), to discuss the depreciation of the Pakistani rupee. While monetary policy and currency regulation traditionally fall under civilian institutions such as the State Bank of Pakistan, the involvement of a high-ranking military officer reflects the broader role the military plays in national economic matters.[176]
According to Ayesha Siddiqa's Military Inc.: Inside Pakistan’s Military Economy, Pakistan's military controls a vast commercial network known as "Milbus," comprising businesses run for the personal benefit of military personnel but excluded from the official defense budget. These ventures include banks, factories, real estate, and retail operations, giving the military significant economic power. This financial autonomy strengthens the military's political dominance, distorts markets, and hinders democratic development by entrenching military influence in civilian affairs.[177]
Despite Pakistan's severe economic crisis marked by hyperinflation, rising debt, and low foreign reserves, the military has remained financially insulated. Military assets grew from A$30 billion in 2016 to over A$39.8 billion, even as state reserves fell to A$5.2 billion and debt surged. In the same period, the military received an increased budget allocation of A$11.27 billion. Senior officers, including Generals Qamar Javed Bajwa and Asim Saleem Bajwa, reportedly amassed significant wealth, while military-run businesses continued to thrive. This resilience is attributed to the military's vast economic network, institutional autonomy, and strong political influence.[178] In 2025 too, for instance, as Pakistan faced 38 percent inflation, low foreign reserves, and widespread poverty, the military elite reportedly remained insulated from the crisis. They maintained affluent lifestyles, exclusive housing, and substantial business interests, in contrast to the hardships faced by the broader population.[179]
Poverty and Income inequality[edit | edit source]
In 1965, Pakistan’s chief economist Mahbub ul Haq asserted that 22 families dominated the country’s economic and financial sectors. He contended that these families controlled roughly two-thirds of industrial assets, 80 percent of banking, and 79 percent of insurance assets.[180][181]
In 2015, Pakistan's pre-tax income distribution was highly concentrated at the top, with estimates indicating that the richest 1 percent received 30.2 percent of national income, the top 0.1 percent received 13.4 percent, and the top 0.01 percent received 5.1 percent.[180]
The UNDP’s National Human Development Report (NHDR) 2020 stated that public spending in Pakistan had not benefited all income groups equally. The poorest category received only 14.2 percent of the overall share of expenditure, while the richest received 37.2 percent. According to NHDR 2021, the richest 20 percent held 49.6 percent of national income, compared with just 7 percent held by the poorest 20 percent.[182]
Link between remittance inflows and migration trends[edit | edit source]
In 2024, personal remittance inflows to Pakistan accounted for 9.4% of the country's gross domestic product, a figure notably higher than India's 3.5% and significantly increased from the pre-COVID-19 level of 6%. This economic reliance on remittances reflects underlying challenges in domestic opportunities, which the 2024 report by the National Commission for Human Rights links to a rise in illegal migration. According to the report, over 6,000 Pakistanis undertook illegal journeys to Europe in 2023 alone.[183]
Ease of doing business[edit | edit source]
Pakistan's economy faces significant challenges impacting its ease of doing business, including weak macroeconomic indicators, reliance on imports, and low foreign direct investment (FDI). Investors point to high inflation, complex regulations, inconsistent policies, poor intellectual property protection, corruption, political instability, and security concerns as key obstacles. Pakistan's Ease of Doing Business ranking fell from 61st in 2006 to 147th in 2018, before improving to 108th in 2020. To address these issues, the government secured a $3 billion IMF Stand-By Arrangement in 2023 and established the Special Investment Facilitation Council to attract foreign investment, especially from Gulf Cooperation Council countries.[184][185]
Since 2022, many MNCs, including Eli Lilly, Shell, Microsoft, Uber, and Yamaha, have exited Pakistan, driven by a combination of sector-specific challenges, weak intellectual property enforcement, shrinking margins, and an unstable economic environment. Former Pakistan Business Council CEO Ehsan Malik cited delays in regulatory approvals, rising local competition, and a depreciating rupee as key reasons behind the retreat. He noted that pharmaceutical multinationals often exit due to prolonged delays in price adjustment approvals and the unethical marketing practices employed by certain local firms.[186] In October 2025, Procter & Gamble (P&G) announced its exit after 34 years in the country, winding down the manufacturing and commercial operations of both P&G Pakistan and Gillette Pakistan Ltd. The company cited weak demand, high energy costs, and repatriation restrictions. Gillette's board endorsed the decision and began delisting procedures from the Pakistan Stock Exchange (PSX). Former Gillette CEO Saad Amanullah Khan stated that such corporate departures should serve as a wake-up call for policymakers, highlighting concerns over high operating costs, poor infrastructure, and regulatory pressures.[187][188][189]
Startup funding in Pakistan dropped sharply from $355 million in 2022 to $43 million in 2024, an 88% decline. Analysts cite rupee depreciation, regulatory hurdles, and tax uncertainty as key factors, with industry performance lagging behind regional peers like India and Bangladesh.[190]
As of 2025, Pakistan's FDI averaged just 0.6% of its GDP.[191]
Debt[edit | edit source]

According to the CIA World Factbook, in 2017, Pakistan ranked 57th in the world in terms of public external debt to various international monetary authorities (owing ~$107.527 billion in 2019), accounting for a total of 67.1% of GDP (in 2017).[192]
Government debt and liabilities data is sourced from the State Bank of Pakistan.[193][194][195]
| List | Jun 2010 | Jun 2011 | Jun 2012 | Jun 2013 | Jun 2014 | Jun 2015 | Jun 2016 | Jun 2017 | Jun 2018 | Jun 2019 | Jun 2020 | Jun 2021 | Jun 2022 | Jun 2023 | Jun 2024 | Jun 2025 |
|---|---|---|---|---|---|---|---|---|---|---|---|---|---|---|---|---|
| (Amounts are in billion PKR.) | ||||||||||||||||
| Gross public debt | 9,010
|
10,771
|
12,697
|
14,292
|
15,991
|
17,380
|
19,677
|
21,409
|
24,953
|
32,708
|
36,399
|
39,866
|
49,242
|
62,881
|
71,246
|
80,518
|
| Total debt of govt. | 8,411
|
9,928
|
11,890
|
13,457
|
14,624
|
15,986
|
17,823
|
19,635
|
23,024
|
29,521
|
33,235
|
35,669
|
44,362
|
57,779
|
65,105
|
73,271
|
| (Amounts are in billion US$.) | ||||||||||||||||
| Public external debt | 53.6
|
57.9
|
55.9
|
51.2
|
54.7
|
54.7
|
61.4
|
66.1
|
75.4
|
83.9
|
87.9
|
95.2
|
100.0
|
94.9
|
98.3
|
103.8
|
| As % of GDP | ||||||||||||||||
| Gross public debt | 60.6
|
58.9
|
63.3
|
63.9
|
63.5
|
63.3
|
60.1
|
60.2
|
63.7
|
74.7
|
76.6
|
71.5
|
73.9
|
75.0
|
67.8
|
70.2
|
| Total debt of govt. | 56.6
|
54.3
|
59.3
|
60.1
|
58.1
|
58.3
|
54.5
|
55.2
|
58.7
|
67.4
|
69.9
|
63.9
|
66.6
|
68.9
|
61.9
|
63.9
|
| Public external debt | 30.8
|
27.2
|
26.4
|
22.7
|
21.5
|
20.3
|
19.6
|
19.5
|
23.4
|
31.2
|
31.1
|
26.9
|
30.5
|
32.3
|
26.0
|
25.7
|
Pakistan's external debt servicing includes the repayment of both the principal amount borrowed and the accrued interest.[196]
| List | FY 2010 | FY 2011 | FY 2012 | FY 2013 | FY 2014 | FY 2015 | FY 2016 | FY 2017 | FY 2018 | FY 2019 | FY 2020 | FY 2021 | FY 2022 | FY 2023 | FY 2024 |
|---|---|---|---|---|---|---|---|---|---|---|---|---|---|---|---|
| Principal | 3,140
|
2,458
|
3,294
|
5,046
|
5,659
|
3,499
|
3,076
|
4,439
|
3,326
|
6,527
|
9,630
|
10,188
|
11,577
|
15,061
|
9,273
|
| Interest | 1,015
|
1,074
|
1,019
|
933
|
909
|
1,172
|
1,346
|
1,626
|
2,317
|
2,951
|
3,229
|
2,229
|
2,985
|
4,421
|
5,457
|
| Total | 4,155
|
3,532
|
4,313
|
5,979
|
6,568
|
4,671
|
4,422
|
6,065
|
5,642
|
9,478
|
12,859
|
12,417
|
14,562
|
19,482
|
14,730
|
See also[edit | edit source]
- List of companies of Pakistan
- Trade unions in Pakistan
- Nationalisation in Pakistan
- Privatisation in Pakistan
- Economy of Punjab, Pakistan
- Economy of Sindh
- Economy of Khyber Pakhtunkhwa
- Economy of Balochistan, Pakistan
- Economy of Azad Kashmir
- Economy of Gilgit Baltistan
Notes[edit | edit source]
References[edit | edit source]
- ↑ "About Karachi". Government of Pakistan. Retrieved 13 September 2025.
- ↑ "World Economic Outlook Database, April 2019". International Monetary Fund. Archived from the original on 22 December 2019. Retrieved 29 September 2019.
- ↑ "World Bank Country and Lending Groups". datahelpdesk.worldbank.org. World Bank. Retrieved 29 September 2019.
- ↑ 4.0 4.1 4.2 4.3 "World Economic Outlook (October 2025)".
- ↑ 5.0 5.1 5.2 5.3 5.4 "IMF DataMapper: Pakistan". International Monetary Fund. 2025. Retrieved 19 May 2025.
- ↑ "Sectoral Shares in GDP" (PDF). Pakistan Bureau of Statistics. Retrieved 17 April 2024.
- ↑ "GDP – composition, by end use-CIA World Factbook". The World Factbook. Archived from the original on 8 January 2021. Retrieved 23 May 2022.
- ↑ "Pakistan Economic Survey 2025".
- ↑ https://www.imf.org/external/datamapper/PCPIPCH@WEO/WEOWORLD/PAK
- ↑ World Bank (October 2021). Shifting Gears : Digitization and Services-Led Development. South Asia Economic Focus. World Bank. p. 218. doi:10.1596/978-1-4648-1797-7. hdl:10986/36317. ISBN 978-1-4648-1797-7. S2CID 244900022. Retrieved 23 May 2022.
- ↑ "Country Profile-Pakistan" (PDF). Macro Poverty Oulook. World Bank. Retrieved 23 May 2022.
- ↑ "Poverty headcount ratio at $3.20 a day (2011 PPP) (% of population) – Pakistan". data.worldbank.org. World Bank. Retrieved 20 October 2020.
- ↑ "Select by country:Pakistan". World Poverty Clock. Retrieved 23 May 2022.
- ↑ "GINI index (World Bank estimate)". data.worldbank.org. World Bank. Retrieved 18 July 2021.
- ↑ 15.0 15.1 "Human Development Index (HDI)". hdr.undp.org. HDRO (Human Development Report Office) United Nations Development Programme. Retrieved 31 August 2025.
- ↑ 16.0 16.1 "Pakistan Labour Survey" (PDF). PBS. Retrieved 23 March 2023.
- ↑ "Unemployment rate". International Monetary Fund.
- ↑ 18.0 18.1 "Exports and Imports of Goods & Services" (PDF). SBP. Retrieved 8 August 2025.
- ↑ "External Sector" (PDF). SBP. Retrieved 10 August 2024.
- ↑ "SBP Export Receipts by Country" (PDF). SBP. 2021–2022. Retrieved 10 August 2024.
- ↑ "Imports Payments by Commodity" (PDF). SBP. Retrieved 10 August 2024.
- ↑ "Import Payments by Selected Countries/Regions" (PDF). SBP. Retrieved 10 August 2024.
- ↑ "Pakistan: Foreign Investment" (PDF). SBP. Retrieved 27 July 2023.
- ↑ "Pakistan Economic Survey 2025".
- ↑ "External Sector" (PDF). SBP. Retrieved 27 July 2023.
- ↑ "Pakistan's Debt and Liabilities-Summary" (PDF). SBP. Retrieved 13 September 2024.
- ↑ 27.0 27.1 "Consolidated Fiscal Operations". Finance Division. 30 July 2024. Retrieved 13 September 2024.
- ↑ "Net official development assistance and official aid received (current US$)". World Bank. Retrieved 14 March 2023.
- ↑ "Sovereigns rating list". Standard & Poor's. Retrieved 30 July 2024.
- ↑ "Moody's upgrades Pakistan's rating to Caa2; outlook positive". 2 September 2024.
- ↑ "Fitch Revises Pakistan's Outlook to Negative; Affirms at 'B-'". Fitch Ratings. 18 July 2022. Retrieved 19 July 2025.
- ↑ "Fitch Upgrades Pakistan's Rating Citing Improved External Liquidity". Fitch. 15 April 2025.
- ↑ "Liquid Foreign Exchange Reserves" (PDF). www.sbp.org.pk. Retrieved 6 November 2024.
- ↑ 34.0 34.1 "World Economic Outlook database: April 2025". imf.org. Retrieved 21 October 2025.
- ↑ "https://www.imf.org/external/datamapper/profile/PAK". www.imf.org. Retrieved 29 October 2025.
{{cite web}}: External link in|title= - ↑ Dunn, Kawana, Brewer, Trade Globalization since 1795, American Sociological Review, 2000 February, Vol. 65 article, Appendix with the country list Archived 18 July 2010 at the Wayback Machine
- ↑ Henneberry, S. (2000). "An analysis of industrial–agricultural interactions: A case study in Pakistan" (PDF). Agricultural Economics. 22: 17–27. doi:10.1016/S0169-5150(99)00041-9 ( (inactive $1) 25 August 2025).
{{cite journal}}: CS1 maint: DOI inactive as of August 2025 (link) - ↑ "World Bank Document" (PDF). 2008. p. 14. Retrieved 2 January 2010.
- ↑ "Pakistan Country Report" (PDF). RAD-AID. 2010. pp. 3, 7. Archived from the original (PDF) on 12 January 2012. Retrieved 26 December 2011.
- ↑ "Privatisation process: Govt to sell assets in sole offering". The Express Tribune. 27 January 2014.
- ↑ Shahid, Ariba (11 February 2026). "Pakistan central bank chief expects broader recovery than IMF forecast".
- ↑ 42.0 42.1 "World Bank Document" (PDF). 2008. p. 14. Retrieved 2 January 2010.
- ↑ "Arquivo.pt". arquivo.pt. Archived from the original on 20 July 2009. Retrieved 6 April 2022.
- ↑ Design, Websynergi. "Pakistan Trade, Pakistan Industries, India Pakistan Trade Unit". iptu.co.uk. Archived from the original on 14 September 2019. Retrieved 9 October 2014.
- ↑ "Pakistan's Top 10 Exports 2020". worldstopexports.com. Retrieved 6 April 2022.
- ↑ 46.0 46.1 46.2 46.3 46.4 46.5 46.6 Anjum, Muhammad Iqbal; Michael Sgro, Pasquale (26 June 2017). "A brief history of Pakistan's economic development" (PDF). Real-World Economics Review (80): 171–178.
- ↑ Dawn.com (27 December 2021). "2021 in review: Business stories that captured the waves". Dawn. Retrieved 1 March 2026.
- ↑ Schmall, Emily; Masood, Salman (23 November 2021). "As Inflation Surges, Pakistan Seeks a $6 Billion I.M.F. Lifeline". The New York Times. ISSN 0362-4331. Retrieved 1 March 2026.
- ↑ Ahmed, Ali (1 January 2022). "December: Inflation reading comes in at 12.3%, highest in 22 months". Brecorder. Retrieved 1 March 2026.
- ↑ Shirajiv, Sirimane. "Pakistan-Sri Lanka trade zooming to US$ one billion mark". Retrieved 23 May 2007.
{{cite news}}: CS1 maint: deprecated archival service (link) - ↑ "Data – Finance". Web.worldbank.org. Archived from the original on 5 April 2010. Retrieved 29 July 2010.
- ↑ "Pakistan Stock Exchange formally launched Index". Dawn News. 11 January 2016. Retrieved 12 September 2017.
- ↑ "Market dips as MSCI reclassifies PSX to Emerging Markets Index". Dawn News. 16 May 2017. Retrieved 12 September 2017.
- ↑ "Pakistan economic survey" (PDF). Finance Division. Archived (PDF) from the original on 10 June 2021. Retrieved 3 September 2021.
- ↑ "Social Indicators | Pakistan Economic Survey 2024-25" (PDF).
- ↑ "Financial Statements Analysis (Non-financial Companies)" (PDF). sbp.org.pk. Retrieved 14 September 2024.
- ↑ Bokhari, Jawaid (2 December 2024). "Documenting the informal economy". Dawn. Retrieved 21 January 2026.
- ↑ "Over 72% of workers employed in informal sector in Pakistan during 2024-25". www.inp.net.pk. Retrieved 21 January 2026.
- ↑ Kardar, Nadeem ul Haque | Shahid (18 July 2025). "In defence of the informal economy". Dawn. Retrieved 21 January 2026.
- ↑ "How much gold do Pakistanis own? | Nukta". nukta.com. Retrieved 21 January 2026.
- ↑ 61.0 61.1 "Credit for Housing and Construction". sbp.org.pk. Retrieved 22 August 2022.
- ↑ "Pakistan's middle class continues to grow at a rapid pace". The Express Tribune. 2 May 2017. Retrieved 30 September 2018.
- ↑ 63.0 63.1 63.2 "Credit/Loans Classified by Borrowers – Archive". sbp.org.pk. Archived from the original on 30 November 2010. Retrieved 5 October 2021.
- ↑ "Pakistan – Data". data.worldbank.org.
- ↑ Kiani, Khaleeq (6 June 2025). "45pc of Pakistanis live below poverty line: WB". DAWN.COM. Retrieved 17 June 2025.
- ↑ Rana, Shahbaz (3 April 2024). "Over 10m Pakistanis may slip into poverty: WB". The Express Tribune. Retrieved 17 June 2025.
- ↑ "Financial Statements Analysis of Companies" (PDF). sbp.org.pk. SBP. Archived (PDF) from the original on 3 March 2019. Retrieved 25 July 2022.
- ↑ "The World Factbook — Central Intelligence Agency". cia.gov. Archived from the original on 22 April 2016. Retrieved 30 May 2007.
- ↑ "consolidated fiscal operations". Ministry of Finance. Archived from the original on 8 June 2010. Retrieved 3 August 2024.
- ↑ "State Bank of Pakistan". sbp.org.pk. Retrieved 6 April 2022.
- ↑ Dawn.com (9 November 2021). "SBP rejects reports of new designs for currency notes". Dawn. Retrieved 6 April 2022.
- ↑ "State Bank of Pakistan". sbp.org.pk. Retrieved 6 April 2022.
- ↑ "Monthly Average Exchange Rates". SBP. Archived from the original on 30 November 2010. Retrieved 21 August 2023.
- ↑ "Forex Currency Rates Pakistan – Forex Open Market Rates – Prize Bond Draw Result – Rates and schedule – Finance News & Updates". Forexpk.com. 6 January 2014. Retrieved 11 January 2014.
- ↑ "State Bank of Pakistan forex reserves rise to $11.5bln". thenews.com.pk. 10 January 2020. Retrieved 6 November 2020.
- ↑ "Liquid Foreign Exchange Reserves". SBP. Retrieved 15 May 2020.
- ↑ "Liquid Foreign Exchange Reserves". SBP. Retrieved 27 July 2023.
- ↑ 78.0 78.1 78.2 "Sectoral Shares in GDP (at constant basic prices)" (PDF). PBS. Retrieved 19 December 2025.
- ↑ "Agriculture" (PDF). SBP. Retrieved 22 February 2020.
- ↑ "wheat production". fao.org. Retrieved 20 April 2019.
- ↑ "Pakistan Grain and Feed Update". gain.fas.usda.gov. Retrieved 22 February 2020.
- ↑ "Pakistan Business Facts". Archived from the original on 20 April 2020.
- ↑ 83.0 83.1 "Social Indicators" (PDF). Finance Division. Retrieved 19 December 2025.
- ↑ 84.0 84.1 84.2 84.3 "Real Growth Rates of GDP at constant basic prices" (PDF). Pakistan Bureau of Statistics. Retrieved 19 December 2025.
- ↑ "Manufacturing sector grows by 5.2 percent". Associated Press Of Pakistan. 4 June 2014. Archived from the original on 8 August 2014.
- ↑ "Manufacturing, value added (% of GDP)". The World Bank.
- ↑ "Chapter 3: Manufacturing and Mining" (PDF). Pakistan Economic Survey 2017–18. Ministry of Finance. Retrieved 25 May 2019.
- ↑ M. Rizwan Manzoor. The Sectoral Analysis of Surgical Instruments of Pakistan (PDF) (Report). PITAD. Retrieved 25 May 2019.
- ↑ Aaliya Ahmed (1 September 2010). Pakistan Surgical Industry (PDF) (Report). The Rawalpindi Chamber of Commerce & Industry. Archived from the original (PDF) on 8 March 2018. Retrieved 25 May 2019.
- ↑ Surgical & Medical Instruments Industry of Pakistan (PDF) (Report). TDAP. Archived from the original (PDF) on 5 August 2020. Retrieved 25 May 2019.
- ↑ Chin (24 May 2012). "World's Leading Surgical Instruments Producers". TradeFord.
- ↑ Khan, Mubarak Zeb (22 August 2016). "Pakistan's shadow surgical instruments' sector". Dawn News. Retrieved 25 May 2019.
- ↑ "PBS statistics". pbs.gov.pk. Retrieved 17 September 2024.
- ↑ "Financial Statements Analysis of Companies (Non-Financial) Listed at Pakistan Stock Exchange 2023" (PDF). sbp.org.pk. Retrieved 14 September 2024.
- ↑ "Pakistan Economic Survey 2020–21" (PDF). Archived (PDF) from the original on 10 June 2021. Retrieved 2 September 2021.
- ↑ "Pakistan Economic Survey 2022–23" (PDF). finance.gov.pk. Retrieved 31 July 2023.
- ↑ "Cement dispatches declined" (PDF). Retrieved 29 August 2023.
- ↑ "Historical Data on Fertilizer Offtake by Nutrients". National Fertilizer Development Center. Retrieved 31 July 2024.
- ↑ "Performance of Textile Industry" (PDF). tco.com.pk. Retrieved 31 August 2023.
- ↑ "The Wait Is Over". DND. 7 July 2021. Archived from the original on 7 July 2021. Retrieved 2 September 2021.
- ↑ "Here's The Status of Each New Car Company in Pakistan". propakistani.pk. 8 March 2021. Archived from the original on 9 March 2021. Retrieved 5 September 2021.
- ↑ "Production (P) & Sale (S) of Vehicles" (PDF). pama.org.pk. Retrieved 11 August 2025.
- ↑ "Extraction of Principal Minerals" (PDF). Finance division. Archived (PDF) from the original on 10 June 2021. Retrieved 10 June 2022.
- ↑ "Statistical Bulletin - August 2024" (PDF). sbp.org.pk. Retrieved 14 September 2024.
- ↑ 105.0 105.1 "Nepra reports". NEPRA. Archived from the original on 24 February 2020. Retrieved 3 October 2021.
- ↑ Distribution Companies
- ↑ "Pakistan Economic Survey 2022–2023" (PDF). finance.gov.pk. Retrieved 4 September 2023.
- ↑ 108.0 108.1 "State of petroleum industry report 2020-21". ogra.org.pk. Archived from the original on 3 August 2023. Retrieved 5 September 2023.
- ↑ 109.0 109.1 "Home". PTA. Retrieved 4 March 2022.
- ↑ "Pakistan Recognised by GSMA for Exceptional Work in Developing Mobile Communications". Archived from the original on 4 September 2006. Retrieved 25 August 2006.
- ↑ "Business Recorder [Pakistan's First Financial Daily]". Brecorder.com. 1 January 2004. Archived from the original on 11 June 2010. Retrieved 29 July 2010.
- ↑ "Leading News Resource of Pakistan". Daily Times. Archived from the original on 11 June 2010. Retrieved 29 July 2010.
- ↑ "Guess Which County Texts the Heaviest". PCWorld. 1 February 2009. Archived from the original on 14 January 2012. Retrieved 8 April 2009.
- ↑ "Local Mobile Manufacturing Surpasses Mobile Phone Import". PTA. Archived from the original on 27 August 2021. Retrieved 14 September 2021.
- ↑ "Annual Reports". PTA. Retrieved 17 September 2024.
- ↑ "telecom Indicators". PTA. Retrieved 17 September 2024.
- ↑ "PIA Annual reports". PIA. Retrieved 11 August 2025.
- ↑ "Railway Yearbooks". pakrail.gov.pk. Archived from the original on 30 November 2020. Retrieved 24 July 2023.
- ↑ "Segmental Review of Maritime Business Performance" (PDF). pnsc.com.pk. Archived (PDF) from the original on 2 September 2021. Retrieved 2 September 2021.
- ↑ 120.0 120.1 120.2 "History of banking in Pakistan – of humble origins and vast potential". 4 November 2011. Retrieved 23 October 2018.
- ↑ "Gross National Product of Pakistan (at current factor cost)" (PDF). pbs.gov.pk. Retrieved 16 September 2023.
- ↑ Jalil, Abdul and Feridun, Mete (2011) Impact of financial development on economic growth: empirical evidence from Pakistan. Journal of the Asia Pacific Economy, 16 (1). pp. 71–80. ISSN 1354-7860 (print), 1469-9648 (online) (doi:10.1080/13547860.2011.539403)
- ↑ "Financial Statement Analysis of Financial Sector" (PDF). SBP. Retrieved 17 September 2024.
- ↑ "Consolidated Financial Statements of SBP" (PDF). SBP. Retrieved 17 September 2024.
- ↑ 125.0 125.1 "Payment Systems Yearly Review" (PDF). SBP. Retrieved 28 September 2023.
- ↑ Pakistan's post-9/11 economic boom BBC News, 21 September 2006
- ↑ 0.5 million housing units needed annually to meet shortfall: KCCI Archived 4 August 2020 at the Wayback Machine Business Recorder, 7 October 2006
- ↑ "Extremism Mars Daughter of Alps | Pakistan Alpine Institute". Pakistanalpine.com. Archived from the original on 2 January 2014. Retrieved 11 January 2014.
- ↑ "Pakistan's tourism industry gradually recovering". 16 November 2016. Archived from the original on 16 November 2016. Retrieved 6 April 2022.
- ↑ "Significant Decline In Foreign Investment To Pakistan". Malick, Sajid Ibrahim. 15 February 2010. Archived from the original on 11 September 2010. Retrieved 1 November 2010.
- ↑ "Doing Business 2019 – 17th edition" (PDF). doingbusiness.org. Retrieved 29 February 2020.
- ↑ "New auto players to invest over $800m in Pakistan". tribune.com.pk. 7 January 2018. Retrieved 3 January 2019.
- ↑ "ExxonMobil set for comeback in Pakistan after nearly three decades: Report". profit.pakistantoday.com.pk. 26 November 2018. Retrieved 3 January 2019.
- ↑ "Qatar will invest $3 billion in Pakistan, state news agency says". Reuters. 24 June 2019. Retrieved 24 June 2019.
- ↑ "Qatar Sends First Tranche of $3 Billion Payment to Pakistan". Bloomberg. 29 June 2019. Retrieved 29 June 2019.
- ↑ "Qatar sends $500 million payment to Pakistan". Pakistan Today. Retrieved 30 June 2019.
- ↑ "Summary of Foreign Investment in Pakistan" (PDF). sbp.org.pk. Retrieved 17 September 2024.
- ↑ "Monthly Position Inflow, Outflow and Net basis". SBP. Retrieved 15 May 2020.
- ↑ Nafees, Shahab (16 November 2016). "Turkish company acquires Dawlance for $243m". Dawn News. Retrieved 3 January 2017.
- ↑ Siddiqui, Salman (20 December 2016). "Dutch company acquires Engro Foods for $446.81m". Express Tribune. Retrieved 3 January 2017.
- ↑ Crofts, Dale (31 October 2016). "Shanghai Electric to Pay $1.8 Billion for Stake in K-Electric". Bloomberg L.P. Retrieved 3 January 2017.
- ↑ Mohiuddin Aazim (9 July 2007). "Rising foreign stakes in local companies". Dawn News. Retrieved 25 May 2019.
- ↑ 143.0 143.1 "Workers' Remittances" (PDF). Archived (PDF) from the original on 28 August 2021. Retrieved 28 August 2021.
- ↑ "Exports and Imports of Goods & Services". sbp.org.pk. Retrieved 23 July 2023.
- ↑ "Exports and Imports of Goods & Services" (PDF). www.sbp.org.pk/. Retrieved 12 August 2025.
- ↑ "Export Receipts by Commodities and Groups". SBPx. Retrieved 18 September 2024.
- ↑ "Imports Payments by Commodity and Groups" (PDF). SBP. Archived (PDF) from the original on 15 July 2021. Retrieved 21 July 2021.
- ↑ "Imports Payments by Commodity". SBP. Archived from the original on 12 July 2021. Retrieved 27 May 2021.
- ↑ 149.0 149.1 "Trade and Payments" (PDF). finance.gov.pk. Retrieved 16 September 2023.
- ↑ 150.0 150.1 "Summary Balance of Payments" (PDF). SBP. Retrieved 4 August 2023.
- ↑ Tridivesh Singh Maini. "After Khan's Visit, Pakistan Doubles Down on China Dependence". The Diplomat. Retrieved 19 May 2019.
- ↑ Saber, Israa (10 December 2018). "Experts discuss Pakistan's Imran Khan's first 100 days in office". Brookings. Retrieved 19 May 2019.
- ↑ "Business Recorder [Pakistan's First Financial Daily]". Brecorder.com. 1 January 2004. Archived from the original on 11 June 2010. Retrieved 29 July 2010.
- ↑ "World Bank plans 6.5 bln usd lending to Pakistan". Forbes.com. 2 January 2006. Archived from the original on 4 September 2006. Retrieved 6 March 2006.
- ↑ "Japan to resume USD 500 mn annual funding for Pak". Chennai, India: The Hindu News Update Service. 29 May 2006. Archived from the original on 30 September 2007. Retrieved 3 June 2006.
- ↑ "Transactions with the Fund, Pakistan". imf.org.
- ↑ "Aid to Pakistan by the Numbers". Center for Global Development. September 2013. Retrieved 4 January 2019.
- ↑ "IMF Agrees to $6 Billion Bailout to Help Pakistan Ease Crisis". Bloomberg.com. 12 May 2019. Retrieved 19 May 2019.
- ↑ "Pakistan growth to hit eight-year low as IMF bailout looms". gulfnews.com. 10 May 2019. Retrieved 19 May 2019.
- ↑ "Pakistan | State Bank of Pakistan" (PDF). sbp.org. Retrieved 7 September 2017.
- ↑ "Workers' Remittances" (PDF). SBP. Archived (PDF) from the original on 8 December 2004. Retrieved 12 June 2021.
- ↑ "Country-wise Workers' Remittances". SBP. Archived from the original on 30 July 2020. Retrieved 22 August 2020.
- ↑ 163.0 163.1 Hussain, Abid. "'Elite capture': How Pakistan is losing 6 percent of its GDP to corruption". Al Jazeera. Retrieved 25 November 2025.
- ↑ 164.0 164.1 Waleed, Hamid (11 July 2025). "Finance Act 2025 tightens tax rules for businesses, filers". Brecorder. Retrieved 13 August 2025.
- ↑ 165.0 165.1 Khan, Gohar Ali (19 July 2025). "Karachi, Lahore hit by strike against 'anti-business' tax measures". Brecorder. Retrieved 13 August 2025.
- ↑ Susan Rose-Ackerman (1997). Corruption and good governa. United Nations Development Programme. p. 4. ISBN 9789211260823.
- ↑ "Pakistan" (PDF), Country Reports on Human Rights Practices, United States Department of State: Bureau of Democracy, Human Rights, and Labor, 4 August 2011, retrieved 10 December 2011
- ↑ "Corruption Perceptions Index (2011)". Transparency International. Archived from the original on 24 December 2018. Retrieved 10 December 2011.
- ↑ "Corruption Perceptions Index (2010)". Transparency International. Archived from the original on 26 December 2018. Retrieved 10 December 2011.
- ↑ "Corruption Perceptions Index (2009)". Transparency International. Retrieved 10 December 2011.
- ↑ Marie Chêne, Overview of corruption in Pakistan, U4 Anti-Corruption Resource Centre, archived from the original on 30 September 2011, retrieved 19 April 2020
- ↑ "Pakistan less corrupt, according to global corruption list". The Express Tribune. 1 December 2011. Retrieved 10 December 2011.
- ↑ 'Rule of law can end corruption in Pakistan' | Asia | DW.DE | 06.12.2012. DW.DE. Retrieved on 12 July 2013.
- ↑ e.V, Transparency International (21 February 2018). "Corruption Perceptions Index 2017". transparency.org. Archived from the original on 21 February 2018. Retrieved 19 April 2020.
- ↑ "Press Releases". NAB. Archived from the original on 12 August 2021. Retrieved 3 September 2021.
- ↑ Kaur Makol, Malvika; Haider, Kamran (24 July 2025). "Pakistan Army Intelligence Officer Meets FX Body as Rupee Falls". Bloomberg.
- ↑ "Military Inc. – Inside Pakistan's Military Economy - GSDRC". 10 February 2013. Retrieved 28 July 2025.[permanent dead link]
- ↑ Jehangir, Ayesha (23 May 2023). "Explainer: A historical trail of Pakistan's powerful military enterprise". The Conversation. Retrieved 28 July 2025.
- ↑ "Pakistan's military economy: An empire thriving amid national ruin". Firstpost. 11 March 2025. Retrieved 28 July 2025.
- ↑ 180.0 180.1 https://econ.berkeley.edu/sites/default/files/Ahmed_Ali_thesis.pdf [bare URL PDF]
- ↑ Haq, Khadija (2018). Haq, Khadija (ed.). "'Pakistan's 22 Families', in Khadija Haq (ed.), Economic Growth with Social Justice: Collected Writings of Mahbub ul Haq (Delhi, 2017; online edn, Oxford Academic, 18 Jan. 2018)". Oxford Academic. 1. doi:10.1093/oso/9780199474684.003.0014.
- ↑ Hashim, Asad. "Elite privilege consumes $17.4bn of Pakistan's economy: UNDP". Al Jazeera. Retrieved 26 November 2025.
- ↑ "Illegal Pakistani migrants disguised as soccer players sent to Japan". Nikkei Asia. Retrieved 25 September 2025.
- ↑ "Pakistan". United States Department of State. Retrieved 7 October 2025.
- ↑ Salman, Ali (8 July 2024). "Ease of doing business: cases of Malaysia, Pakistan". The Express Tribune. Retrieved 7 October 2025.
- ↑ Dawn.com (2 October 2025). "Why are multinationals exiting Pakistan? Here's what analysts have to say". Dawn. Retrieved 7 October 2025.
- ↑ "P&G exits Pakistan". The Express Tribune. 3 October 2025. Retrieved 7 October 2025.
- ↑ "Procter & Gamble Will Shut Down Business in Pakistan, Following Shell and Pfizer Exits". Bloomberg.com. 2 October 2025. Retrieved 7 October 2025.
- ↑ "Why is Procter & Gamble exiting cash-strapped Pakistan after 34 years?". Wion. Retrieved 7 October 2025.
- ↑ Virani, Faiza (3 July 2025). "Pakistan's shrinking tech landscape: global companies exit amidst capital crunch". Brecorder. Retrieved 7 October 2025.
- ↑ Why Pakistan fails to unlock its economic potential – DW – 11/04/2025. Retrieved 11 December 2025 – via www.dw.com.
- ↑ "Pakistan", The World Factbook, Central Intelligence Agency, 30 March 2022, archived from the original on 28 March 2022, retrieved 6 April 2022
- ↑ "Pakistan's Debt and Liabilities-Summary". SBP. Archived from the original on 25 October 2017. Retrieved 18 February 2021.
- ↑ "Pakistan's External Debt and Liabilities – Outstanding" (PDF). SBP. Archived (PDF) from the original on 27 May 2003. Retrieved 30 December 2021.
- ↑ Pakistan's Debt and Liabilities-Summary. "Pakistan's Debt and Liabilities-Summary" (PDF). SBP. Archived (PDF) from the original on 2 December 2011. Retrieved 30 December 2021.
- ↑ "Pakistan's External Debt Servicing -Principal (Archive)". SBP. Archived from the original on 30 November 2010. Retrieved 17 August 2023.
Further reading[edit | edit source]
- Gabol, Nasir (1990). Privatisation in Pakistan. Paris, France: Organisation for Economic Cooperation and Development. ISBN 92-64-15310-1.
- Ahmad, Viqar and Rashid Amjad. 1986. The Management of Pakistan's Economy, 1947–82. Karachi: Oxford University Press.
- Ali, Imran. 1997. 'Telecommunications Development in Pakistan', in E.M. Noam (ed.), Telecommunications in Western Asia and the Middle East. New York: Oxford University Press.
- Ali, Imran. 2001a. 'The Historical Lineages of Poverty and Exclusion in Pakistan'. Paper presented at Conference on Realm, Society and Nation in South Asia. National University of Singapore.
- Ali, Imran. 2001b. 'Business and Power in Pakistan', in A.M. Weiss and S.Z. Gilani (eds), Power and Civil Society in Pakistan. Karachi: Oxford University Press.
- Ali, Imran. 2002. 'Past and Present: The Making of the State in Pakistan', in Imran Ali, S. Mumtaz and J.L. Racine (eds), Pakistan: The Contours of State and Society. Karachi: Oxford University Press.
- Ali, Imran, A. Hussain. 2002. Pakistan National Human Development Report. Islamabad: UNDP.
- Ali, Imran, S. Mumtaz and J.L. Racine (eds). 2002. Pakistan: The Contours of State and Society. Karachi: Oxford University Press.
- Amjad, Rashid. 1982. Private Industrial Investment in Pakistan, 1960–70. London: Cambridge University Press.
- Andrus, J.R. and A.F. Mohammed. 1958. The Economy of Pakistan. Stanford: Stanford University Press.
- Bahl, R., & Cyan, M. (2009). Local Government Taxation in Pakistan (No. paper0909). International Center for Public Policy, Andrew Young School of Policy Studies, Georgia State University.
- Barrier, N.G. 1966. The Punjab Alienation of Land Bill of 1900. Durham, NC: Duke University South Asia Series.
- Jahan, Rounaq. 1972. Pakistan: Failure in National Integration. New York: Columbia University Press.
- Kessinger, T.G. 1974. Vilyatpur, 1848–1968. Berkeley and Los Angeles: University of California Press.
- Kochanek, S.A. 1983. Interest Groups and Development: Business and Politics in Pakistan. New Delhi: Oxford University Press.
- LaPorte, Jr, Robert and M.B. Ahmad. 1989. Public Enterprises in Pakistan. Boulder, Colorado: Westview Press.
- Latif, S.M. 1892. Lahore. Lahore: New Imperial Press, reprinted 1981, Lahore: Sandhu Printers.
- Low, D.A. (ed.). 1991. The Political Inheritance of Pakistan. London: Macmillan.
- Noman, Omar. 1988. The Political Economy of Pakistan. London: KPI.
- Papanek, G.F. 1967. Pakistan's Development: Social Goals and Private Incentives. Cambridge, Massachusetts: Harvard University Press.
- Raychaudhuri, Tapan and Irfan Habib (eds). 1982. The Cambridge Economic History of India, 2 vols. Cambridge: Cambridge University Press
- White, L.J. 1974. Industrial Concentration and Economic Power. Princeton, N.J.: Princeton University Press.
- Ziring, Lawrence. 1980. Pakistan: The Enigma of Political Development. Boulder, Colorado: Folkestone.
- Ali, Imran. 1987. 'Malign Growth? Agricultural Colonisation and the Roots of Backwardness in the Punjab', Past and Present, 114
- Ali, Imran. August 2002. 'The Historical Lineages of Poverty and Exclusion in Pakistan', South Asia, XXV(2).
- Ali, Imran and S. Mumtaz. 2002. 'Understanding Pakistan—The Impact of Global, Regional, National and Local Interactions', in Imran Ali, S. Mumtaz and J.L. Racine (eds), Pakistan: the Contours of State and Society. Karachi: Oxford University Press.
- Hasan, Parvez. 1998. Pakistan's Economy at the Crossroads: Past Policies and Present Imperatives. Karachi: Oxford University Press.
- Hussain, Ishrat. 1999. Pakistan: The Economy of an Elitist State. Karachi: Oxford University Press.
- Khan, Shahrukh Rafi. 1999. Fifty Years of Pakistan's Economy: Traditional Topics and Contemporary Concerns. Karachi: Oxford University Press.
- Kibria, Ghulam. 1999. Shattered Dream: Understanding Pakistan's Development. Karachi: Oxford University Press.
- Kukreja, Veena. 2003. Contemporary Pakistan: Political Processes, Conflicts and Crises. New Delhi: Sage Publications.
- Zaidi, S. Akbar. 1999. Issues in Pakistan's Economy. Karachi: Oxford University Press
- Faheem, Khan. 2010. Issues in Pakistan's Economy. Peshawar:
- https://www.thenews.com.pk/tns/detail/710478-retail-sector-a-5-billion-tax-potential
External links[edit | edit source]
- Statistics Division, Government of Pakistan
- Ministry of Finance, Government of Pakistan
- Ministry of Commerce, Government of Pakistan
- World Bank Summary Trade Statistics Pakistan
- Pakistan. The World Factbook. Central Intelligence Agency.
Pakistan articles | |||||||||||||||||||
|---|---|---|---|---|---|---|---|---|---|---|---|---|---|---|---|---|---|---|---|
| |||||||||||||||||||
| |||||||||||||||||||
| |||||||||||||||||||
| |||||||||||||||||||
| |||||||||||||||||||


Template:SAFTA Template:World Trade Organization
