Jehanabad district
This article possibly contains original research. (June 2021) |
Jehanabad district | |
|---|---|
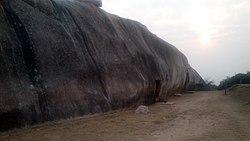
 Cave in Jehanabad district | |
 Location of Jehanabad district in Bihar | |
| Coordinates (Jehanabad): Coordinates: 24°45′N 85°00′E / 24.750°N 85.000°E | |
| Country | |
| State | Bihar |
| Division | Magadh |
| Headquarters | Jehanabad |
| Government | |
| • Lok Sabha constituencies | Jahanabad |
| Area | |
| • Total | 932 km2 (360 sq mi) |
| Population (2011) | |
| • Total | 1,125,313 |
| • Density | 1,200/km2 (3,100/sq mi) |
| Demographics | |
| • Sex ratio | 918[1] |
| Time zone | UTC+05:30 (IST) |
| Major highways | NH 83 |
| Average annual precipitation | 1074 mm |
| Website | http://jehanabad.bih.nic.in/ |
Jehanabad district is one of the thirty-eight districts of Bihar state, India. Jehanabad town is the administrative headquarters of this district. Jehanabad district is a part of Magadh Division, and is located on the confluence of two small rivers called Dardha and Yamunaiya.
History[edit]
The territory of the present-day district became Jehanabad sub-division of Gaya district in 1872. The district came into existence on 1 August 1986. It is surrounded by Patna in north, Arwal is east, Nalanda in west and Gaya in south.
Jehanabad has a long history of caste wars between upper caste militia landlords and naxalites. It is currently a part of the Red Corridor.[2]
Geography[edit]
Jehanabad district occupies an area of 932 square kilometres (360 sq mi),[3] comparatively equivalent to Mexico's Isla Ángel de la Guarda.[4]
Demographics[edit]
According to the 2011 census Jehanabad district has a population of 1,125,313,[1] roughly equal to the nation of Cyprus[6] or the US state of Rhode Island.[7] This gives it a ranking of 412th in India (out of a total of 640).[1] The district has a population density of 1,206 inhabitants per square kilometre (3,120/sq mi) .[1] Its population growth rate over the decade 2001–2011 was 21.34%.[1] Jehanabad has a sex ratio of 918 females for every 1000 males,[1] and a literacy rate of 78.27%. Scheduled Castes and Scheduled Tribes make up 19.81% and 0.11% of the population respectively.[1]
At the time of the 2011 Census of India, 66.00% of the population in the district spoke Magahi, 29.01% Hindi and 4.83% Urdu as their first language.[8]
| Year | Pop. | ±% p.a. |
|---|---|---|
| 1901 | 237,802 | — |
| 1911 | 249,238 | +0.47% |
| 1921 | 248,306 | −0.04% |
| 1931 | 275,471 | +1.04% |
| 1941 | 320,093 | +1.51% |
| 1951 | 354,133 | +1.02% |
| 1961 | 415,062 | +1.60% |
| 1971 | 495,614 | +1.79% |
| 1981 | 599,143 | +1.92% |
| 1991 | 709,862 | +1.71% |
| 2001 | 926,489 | +2.70% |
| 2011 | 1,125,313 | +1.96% |
| source:[9] | ||
Villages[edit]
References[edit]
- ↑ 1.0 1.1 1.2 1.3 1.4 1.5 1.6 "District Census 2011". Census2011.co.in. 2011. Retrieved 2011-09-30.
- ↑ "83 districts under the Security Related Expenditure Scheme". IntelliBriefs. 2009-12-11. Retrieved 2011-09-17.
- ↑ Srivastava, Dayawanti et al. (ed.) (2010). "States and Union Territories: Bihar: Government". India 2010: A Reference Annual (54th ed.). New Delhi, India: Additional Director General, Publications Division, Ministry of Information and Broadcasting (India), Government of India. pp. 1118–1119. ISBN 978-81-230-1617-7.
{{cite book}}:|last1=has generic name (help) - ↑ "Island Directory Tables: Islands by Land Area". United Nations Environment Program. 1998-02-18. Retrieved 2011-10-11.
Isla Ángel de la Guarda 931km2
- ↑ "Population by Religious Community – 2011". Census of India, 2011. Office of the Registrar General & Census Commissioner, India.
- ↑ US Directorate of Intelligence. "Country Comparison:Population". Retrieved 2011-10-01.
Cyprus 1,120,489 July 2011 est.
- ↑ "2010 Resident Population Data". U. S. Census Bureau. Archived from the original on 2013-10-19. Retrieved 2011-09-30.
Rhode Island 1,052,567
- ↑ 8.0 8.1 2011 Census of India, Population By Mother Tongue
- ↑ Decadal Variation In Population Since 1901
External links[edit]
Template:Districts of Bihar Template:Magadh Division Template:Magadh Division topics