
File:Carbon dioxide pressure-temperature phase diagram.svg

Size of this PNG preview of this SVG file: 220 × 208 pixels. Other resolution: 254 × 240 pixels.
Original file (SVG file, nominally 742 × 700 pixels, file size: 26 KB)
Summary
| DescriptionCarbon dioxide pressure-temperature phase diagram.svg |
English: Phase diagram of CO2 (carbon dioxide).
X axis is temperature in kelvin; Y axis is pressure in bar. |
| Date | |
| Source | Commons, Carbon dioxide pressure-temperature phase diagram.jpg |
| Author |
|
| Other versions |
[] .svg:
.jpg:
.png:
|
| SVG development InfoField |


.svg)


Licensing
I, the copyright holder of this work, hereby publish it under the following license:
 
|
This file is made available under the Creative Commons CC0 1.0 Universal Public Domain Dedication. |
| The person who associated a work with this deed has dedicated the work to the public domain by waiving all of their rights to the work worldwide under copyright law, including all related and neighboring rights, to the extent allowed by law. You can copy, modify, distribute and perform the work, even for commercial purposes, all without asking permission.
http://creativecommons.org/publicdomain/zero/1.0/deed.enCC0Creative Commons Zero, Public Domain Dedicationfalsefalse |
Captions
Add a one-line explanation of what this file represents
File history
Click on a date/time to view the file as it appeared at that time.
| Date/Time | Thumbnail | Dimensions | User | Comment | |
|---|---|---|---|---|---|
| current | 16:39, 30 December 2011 | 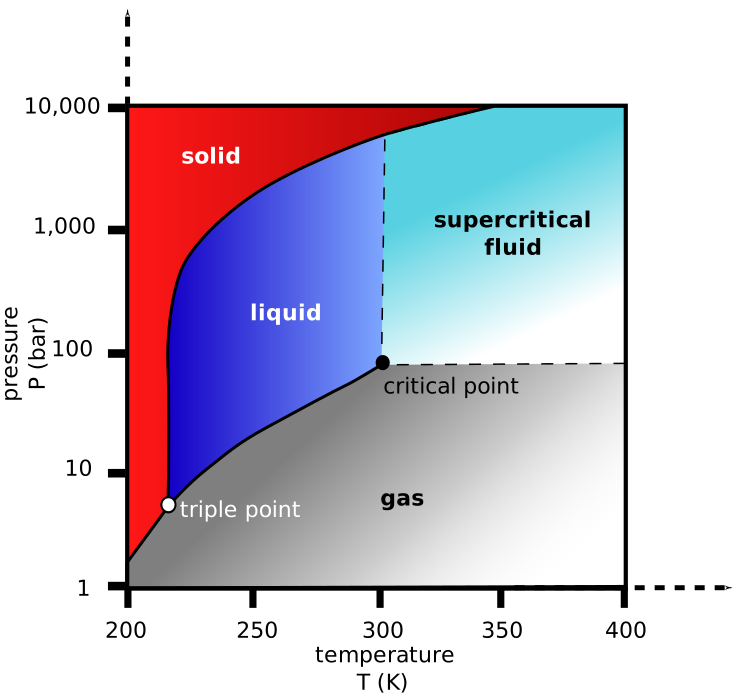 | 742 × 700 (26 KB) | (username removed) |
File usage
The following page uses this file:
