


File:Map latitudinal gradient of biodiversity mannion 2014.png

Size of this preview: 220 × 114 pixels. Other resolutions: 320 × 166 pixels | 549 × 285 pixels.
Original file (549 × 285 pixels, file size: 192 KB, MIME type: image/png)

Summary
| DescriptionMap latitudinal gradient of biodiversity mannion 2014.png |
English: example of latitudinal gradient of species diversity: distribution of living terrestrial vertebrate species, highest concentration of diversity shown in red in equatorial
regions, declining polewards (towards the blue end of the spectrum)
Deutsch: Beispiel für den latitudinalen Biodiversitätsgradienten: Verteilung lebender terrestrischer Wirbeltierarten. Die höchste Artenzahl pro Flächeneinheit finden sich nahe dem Äquator (rote Farben), sie nimmt Richtung beider Pole ab (zunehmend blauer Farbton). |
| Date | |
| Source | Palaeontology [online] (www.palaeontologyonline.com): Mannion, P. D. 2014. Patterns in Palaeontology: The latitudinal biodiversity gradient. Palaeontology Online, Volume 4, Article 3, 1-8. Map created by GLOBAÏA. |
| Author | Mannion, P. D., Upchurch, P., Benson, R. B. J. & Goswami, A., based on work by Clinton Jenkins |
Paleontology Online publishes work under Creative Commons license. For copyright details see: http://www.palaeontologyonline.com/site-information/copyright/.
Licensing


This file is licensed under the Creative Commons Attribution 3.0 Unported license.
Attribution:
Mannion, P. D. 2014. Patterns in Palaeontology: The latitudinal biodiversity gradient. Palaeontology Online, Volume 4, Article 3, 1-8.
- You are free:
- to share – to copy, distribute and transmit the work
- to remix – to adapt the work
- Under the following conditions:
- attribution – You must give appropriate credit, provide a link to the license, and indicate if changes were made. You may do so in any reasonable manner, but not in any way that suggests the licensor endorses you or your use.
Captions
Add a one-line explanation of what this file represents
Verspreiding van de gewervelde landsoorten. De hoogste concentratie aan diversiteit wordt in het rood weergegeven (vooral in gebieden dicht bij de evenaar), lage concentraties in het blauw (vooral naar de polen toe en bij woestijnen).
File history
Click on a date/time to view the file as it appeared at that time.
| Date/Time | Thumbnail | Dimensions | User | Comment | |
|---|---|---|---|---|---|
| current | 05:11, 25 November 2017 | 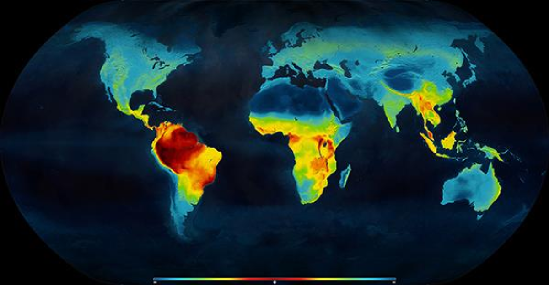 | 549 × 285 (192 KB) | smartcommons>DeWikiMan | {{Information |Description ={{en|1=example of latitudinal gradient of species diversity: distribution of living terrestrial vertebrate species, highest concentration of diversity shown in red in eq... |
File usage
There are no pages that use this file.
